

Key Insights
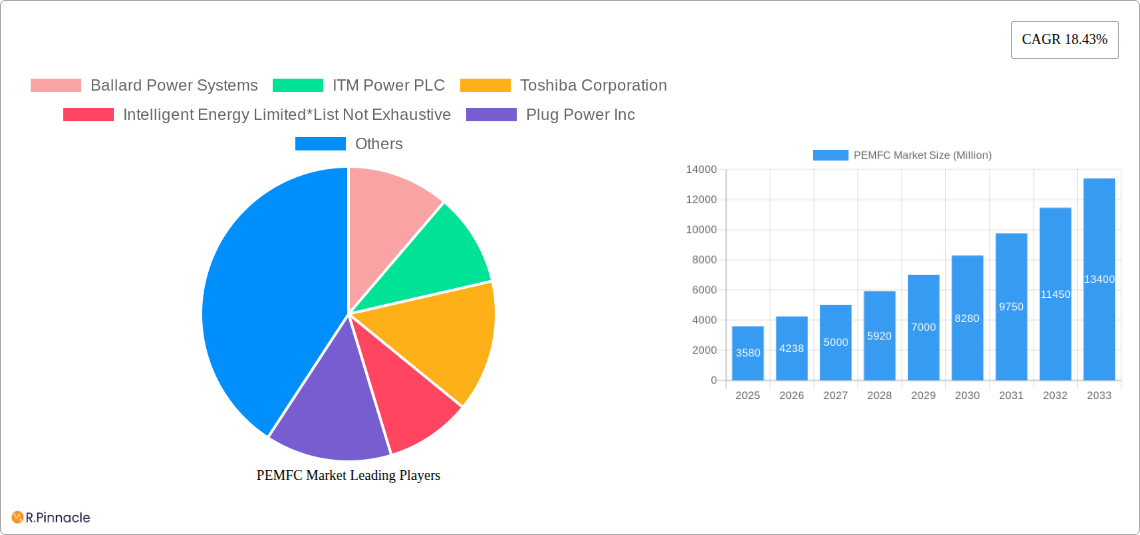
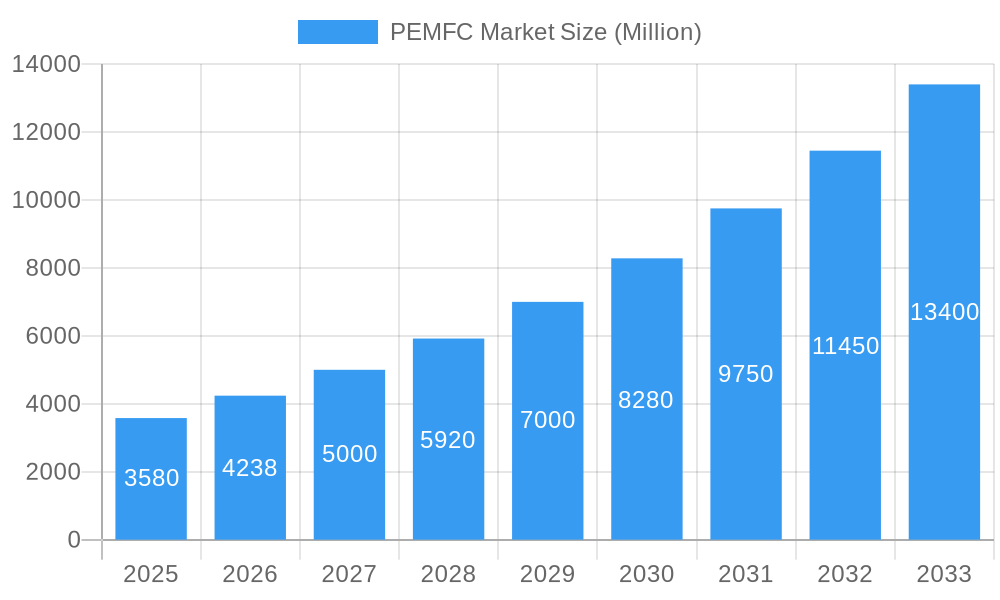
The Polymer Electrolyte Membrane Fuel Cell (PEMFC) market is experiencing robust growth, projected to reach $3.58 billion by 2025 and exhibiting a Compound Annual Growth Rate (CAGR) of 18.43% from 2025 to 2033. This expansion is driven by increasing demand for clean energy solutions across diverse sectors, including transportation (automotive, buses, forklifts), stationary power generation (residential, commercial, industrial), and portable power applications (consumer electronics, military). Government initiatives promoting renewable energy and stricter emission regulations are significantly boosting market adoption. Technological advancements, particularly in high-temperature PEMFCs which offer enhanced efficiency and durability, further fuel market growth. The market is segmented by fuel type (primarily hydrogen and methanol), installation type (on-board and off-board), and end-user application, each demonstrating unique growth trajectories. The automotive sector, particularly electric vehicles and buses, is a key driver, contributing significantly to PEMFC market expansion. However, high initial investment costs associated with PEMFC technology and the need for extensive hydrogen refueling infrastructure remain as significant restraints. Nevertheless, ongoing research and development efforts aimed at improving cost-effectiveness and expanding hydrogen production capacity are expected to mitigate these challenges.
PEMFC Market Market Size (In Billion)
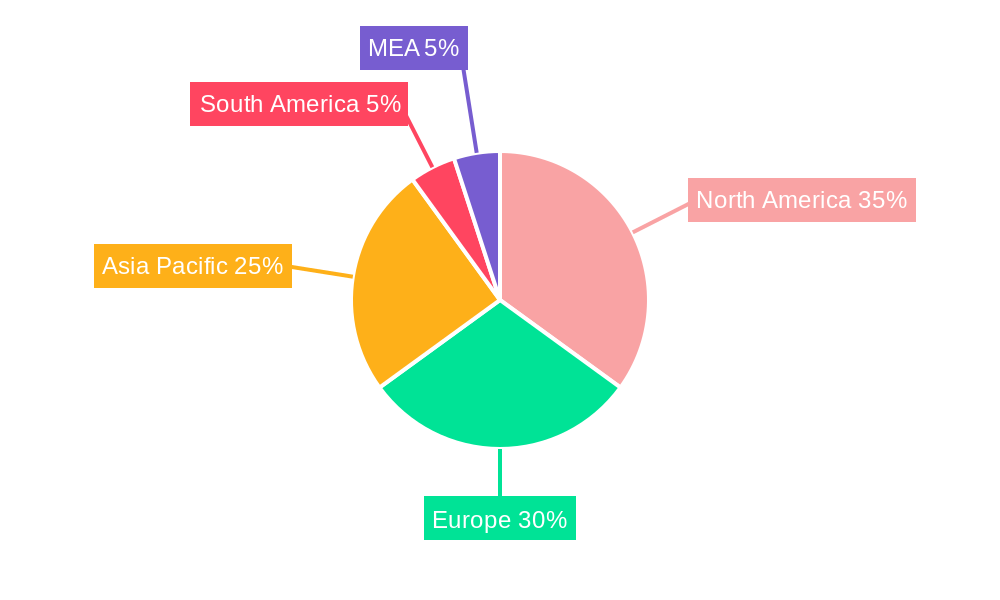
The geographical distribution of the PEMFC market reveals significant regional variations. North America and Europe currently hold substantial market shares, driven by established fuel cell industries and supportive government policies. However, the Asia-Pacific region, particularly China, Japan, and South Korea, is poised for rapid growth due to increasing investments in renewable energy infrastructure and a strong focus on reducing carbon emissions. The South American and MEA (Middle East and Africa) regions are also expected to witness gradual market penetration as awareness of sustainable energy solutions increases and supportive government policies are implemented. Key players like Ballard Power Systems, Plug Power, and Toshiba are strategically investing in research and development, expanding their product portfolios, and forging partnerships to enhance their market positioning within this rapidly evolving landscape. The competitive landscape is characterized by both established players and emerging companies, leading to innovation and price competitiveness. Future growth will depend on overcoming challenges related to cost reduction, scalability, and the development of a robust hydrogen supply chain.
PEMFC Market Company Market Share
PEMFC Market Report: A Comprehensive Analysis (2019-2033)
This in-depth report provides a comprehensive analysis of the PEMFC (Proton Exchange Membrane Fuel Cell) market, offering valuable insights for industry professionals, investors, and strategic decision-makers. The study period covers 2019-2033, with a base year of 2025 and a forecast period of 2025-2033. The report delves into market dynamics, technological advancements, regional variations, and competitive landscapes, providing a clear picture of the PEMFC market's trajectory. This report is invaluable for understanding the current market conditions and anticipating future trends. The global market size is predicted to reach xx Million by 2033, exhibiting a healthy CAGR of xx% during the forecast period.
PEMFC Market Structure & Innovation Trends
The PEMFC market is characterized by a moderately concentrated structure, with key players such as Ballard Power Systems, ITM Power PLC, Toshiba Corporation, Plug Power Inc., and Cummins Inc. holding significant market share. However, the presence of numerous smaller players and startups indicates a dynamic and competitive environment. Innovation is a key driver, fueled by advancements in materials science, improved efficiency, and the need for cleaner energy solutions. Stringent environmental regulations globally are also pushing innovation and adoption. Mergers and acquisitions (M&A) activities are significant, with deal values totaling xx Million in the past five years, primarily focused on consolidating market share and acquiring technological expertise.
- Market Concentration: Moderately concentrated, with top 5 players holding approximately xx% market share (2024).
- Innovation Drivers: Improved efficiency, cost reduction, material science advancements, and stringent environmental regulations.
- Regulatory Framework: Varying across regions, influencing market growth and adoption rates.
- Product Substitutes: Other renewable energy sources, such as solar and wind power, pose some level of competition.
- M&A Activity: Significant activity with total deal values of approximately xx Million in 2019-2024.
PEMFC Market Dynamics & Trends
The PEMFC market is experiencing robust growth driven by increasing demand for clean energy, supportive government policies (including subsidies and tax incentives), and advancements in fuel cell technology. The market is witnessing significant technological disruptions, including the development of high-temperature PEMFCs, which offer improved performance and efficiency. Consumer preferences are shifting towards sustainable energy solutions, creating a favorable environment for PEMFC adoption. However, high initial costs and the need for robust hydrogen infrastructure remain significant challenges. The market is expected to witness a significant shift towards green hydrogen production in the coming years, which will affect the costs and adoption rate of PEMFC technology.
Dominant Regions & Segments in PEMFC Market
The North American market currently holds the largest share of the global PEMFC market, driven primarily by strong government support for clean energy initiatives, robust R&D investments, and a large automotive sector. Within the various segments, Polymer Electrolyte Membrane Fuel Cells (PEMFCs) dominate over Direct Methanol Fuel Cells (DMFCs) due to higher efficiency and wider applications. The transportation sector (automotive, buses, forklifts) accounts for the largest share of end-user applications, followed by stationary power generation (residential, commercial, and industrial).
- Key Drivers in North America: Strong government support for clean energy, robust R&D investments, and a large automotive sector.
- PEMFC Dominance: Higher efficiency and wider applications compared to DMFCs.
- Transportation Sector Lead: Largest end-user application, followed by stationary power generation.
- Other significant regions: Europe and Asia are growing rapidly, spurred by government incentives and rising environmental concerns.
PEMFC Market Product Innovations
Recent innovations focus on improving efficiency, durability, and reducing the cost of PEMFCs. High-temperature PEMFCs are gaining traction, offering advantages in terms of performance and cost-effectiveness. New materials and manufacturing processes are also contributing to enhanced performance and longevity. These advancements are expanding the applications of PEMFCs into diverse sectors, such as portable power, consumer electronics, and military applications.
Report Scope & Segmentation Analysis
This report provides a granular segmentation of the PEMFC market based on several factors:
- Type of Fuel Cell: Polymer Electrolyte Membrane Fuel Cell (PEMFC) and Direct Methanol Fuel Cell (DMFC), with PEMFC exhibiting the larger market share and faster growth.
- End-User Application: Transportation (Automotive, Buses, Forklifts), Stationary Power Generation (Residential, Commercial, Industrial), Portable Power, Consumer Electronics, and Military Applications, with transportation currently dominating the market.
- Technology: High-Temperature PEMFC and Low-Temperature PEMFC, with low-temperature PEMFC currently holding the larger market share.
- Installation Type: On-Board Fuel Cells and Off-Board Fuel Cells.
- Fuel Type: Hydrogen, Methanol, and Others, with hydrogen-based PEMFCs leading the market.
Each segment's market size, growth projections, and competitive dynamics are analyzed in detail within the report.
Key Drivers of PEMFC Market Growth
Several factors are driving the growth of the PEMFC market, including:
- Increasing demand for clean energy: Growing environmental concerns and government regulations are pushing the adoption of clean energy technologies.
- Technological advancements: Improved efficiency, durability, and cost reduction of PEMFCs are making them more attractive.
- Government support: Various countries are providing subsidies, tax incentives, and other forms of support to promote the adoption of PEMFCs.
Challenges in the PEMFC Market Sector
Despite its growth potential, the PEMFC market faces several challenges:
- High initial costs: The high cost of PEMFCs remains a barrier to widespread adoption.
- Limited hydrogen infrastructure: The lack of a widespread hydrogen refueling infrastructure hinders the growth of transportation applications.
- Competition from other renewable energy sources: PEMFCs face competition from other renewable energy technologies, such as solar and wind power.
Emerging Opportunities in PEMFC Market
Despite challenges, significant opportunities exist in the PEMFC market, including:
- Growing demand in emerging economies: Developing countries are increasingly investing in clean energy technologies, presenting significant growth opportunities.
- Advancements in hydrogen production and storage: Technological breakthroughs in hydrogen production and storage are making PEMFCs more viable.
- New applications in diverse sectors: PEMFCs are finding new applications in various sectors, such as portable power, consumer electronics, and military applications.
Leading Players in the PEMFC Market
- Ballard Power Systems
- ITM Power PLC
- Toshiba Corporation
- Intelligent Energy Limited
- Plug Power Inc
- Powercell Sweden AB
- Bramble Energy
- Cummins Inc
- Bloom Energy
- Hydrogenics (a Cummins Inc. company)
Key Developments in PEMFC Market Industry
- October 2021: Panasonic Corporation announced the development of a pure hydrogen fuel cell generator.
- April 2022: SFC Energy and FC TecNrgy signed a deal to produce methanol and hydrogen fuel cells in India, launching the EFOY hydrogen fuel cell.
- August 2022: NREL collaborated with Toyota to build a 1-MW PEM fuel cell power generation system.
Future Outlook for PEMFC Market
The PEMFC market is poised for significant growth in the coming years, driven by increasing demand for clean energy, technological advancements, and supportive government policies. Strategic partnerships, R&D investments, and expansion into new markets will be crucial for success. The market is expected to witness further consolidation through M&A activities, leading to increased efficiency and a more streamlined supply chain. The focus on green hydrogen production will significantly influence the future growth trajectory and cost-effectiveness of the PEMFC technology.
PEMFC Market Segmentation
- 1. Production Analysis
- 2. Consumption Analysis
- 3. Import Market Analysis (Value & Volume)
- 4. Export Market Analysis (Value & Volume)
- 5. Price Trend Analysis
PEMFC Market Segmentation By Geography
- 1. North America
- 2. Europe
- 3. Asia Pacific
- 4. Rest of the World
PEMFC Market Regional Market Share
Geographic Coverage of PEMFC Market
PEMFC Market REPORT HIGHLIGHTS
| Aspects | Details |
|---|---|
| Study Period | 2020-2034 |
| Base Year | 2025 |
| Estimated Year | 2026 |
| Forecast Period | 2026-2034 |
| Historical Period | 2020-2025 |
| Growth Rate | CAGR of 18.43% from 2020-2034 |
| Segmentation |
|
Table of Contents
- 1. Introduction
- 1.1. Research Scope
- 1.2. Market Segmentation
- 1.3. Research Objective
- 1.4. Definitions and Assumptions
- 2. Executive Summary
- 2.1. Market Snapshot
- 3. Market Dynamics
- 3.1. Market Drivers
- 3.2. Market Restrains
- 3.3. Market Trends
- 3.4. Market Opportunities
- 4. Market Factor Analysis
- 4.1. Porters Five Forces
- 4.1.1. Bargaining Power of Suppliers
- 4.1.2. Bargaining Power of Buyers
- 4.1.3. Threat of New Entrants
- 4.1.4. Threat of Substitutes
- 4.1.5. Competitive Rivalry
- 4.2. PESTEL analysis
- 4.3. BCG Analysis
- 4.3.1. Stars (High Growth, High Market Share)
- 4.3.2. Cash Cows (Low Growth, High Market Share)
- 4.3.3. Question Mark (High Growth, Low Market Share)
- 4.3.4. Dogs (Low Growth, Low Market Share)
- 4.4. Ansoff Matrix Analysis
- 4.5. Supply Chain Analysis
- 4.6. Regulatory Landscape
- 4.7. Current Market Potential and Opportunity Assessment (TAM–SAM–SOM Framework)
- 4.8. PRI Analyst Note
- 4.1. Porters Five Forces
- 5. Market Analysis, Insights and Forecast 2021-2033
- 5.1. Market Analysis, Insights and Forecast - by Production Analysis
- 5.2. Market Analysis, Insights and Forecast - by Consumption Analysis
- 5.3. Market Analysis, Insights and Forecast - by Import Market Analysis (Value & Volume)
- 5.4. Market Analysis, Insights and Forecast - by Export Market Analysis (Value & Volume)
- 5.5. Market Analysis, Insights and Forecast - by Price Trend Analysis
- 5.6. Market Analysis, Insights and Forecast - by Region
- 5.6.1. North America
- 5.6.2. Europe
- 5.6.3. Asia Pacific
- 5.6.4. Rest of the World
- 6. Global PEMFC Market Analysis, Insights and Forecast, 2021-2033
- 6.1. Market Analysis, Insights and Forecast - by Production Analysis
- 6.2. Market Analysis, Insights and Forecast - by Consumption Analysis
- 6.3. Market Analysis, Insights and Forecast - by Import Market Analysis (Value & Volume)
- 6.4. Market Analysis, Insights and Forecast - by Export Market Analysis (Value & Volume)
- 6.5. Market Analysis, Insights and Forecast - by Price Trend Analysis
- 7. North America PEMFC Market Analysis, Insights and Forecast, 2020-2032
- 7.1. Market Analysis, Insights and Forecast - by Production Analysis
- 7.2. Market Analysis, Insights and Forecast - by Consumption Analysis
- 7.3. Market Analysis, Insights and Forecast - by Import Market Analysis (Value & Volume)
- 7.4. Market Analysis, Insights and Forecast - by Export Market Analysis (Value & Volume)
- 7.5. Market Analysis, Insights and Forecast - by Price Trend Analysis
- 8. Europe PEMFC Market Analysis, Insights and Forecast, 2020-2032
- 8.1. Market Analysis, Insights and Forecast - by Production Analysis
- 8.2. Market Analysis, Insights and Forecast - by Consumption Analysis
- 8.3. Market Analysis, Insights and Forecast - by Import Market Analysis (Value & Volume)
- 8.4. Market Analysis, Insights and Forecast - by Export Market Analysis (Value & Volume)
- 8.5. Market Analysis, Insights and Forecast - by Price Trend Analysis
- 9. Asia Pacific PEMFC Market Analysis, Insights and Forecast, 2020-2032
- 9.1. Market Analysis, Insights and Forecast - by Production Analysis
- 9.2. Market Analysis, Insights and Forecast - by Consumption Analysis
- 9.3. Market Analysis, Insights and Forecast - by Import Market Analysis (Value & Volume)
- 9.4. Market Analysis, Insights and Forecast - by Export Market Analysis (Value & Volume)
- 9.5. Market Analysis, Insights and Forecast - by Price Trend Analysis
- 10. Rest of the World PEMFC Market Analysis, Insights and Forecast, 2020-2032
- 10.1. Market Analysis, Insights and Forecast - by Production Analysis
- 10.2. Market Analysis, Insights and Forecast - by Consumption Analysis
- 10.3. Market Analysis, Insights and Forecast - by Import Market Analysis (Value & Volume)
- 10.4. Market Analysis, Insights and Forecast - by Export Market Analysis (Value & Volume)
- 10.5. Market Analysis, Insights and Forecast - by Price Trend Analysis
- 11. Competitive Analysis
- 11.1. Company Profiles
- 11.1.1 Ballard Power Systems
- 11.1.1.1. Company Overview
- 11.1.1.2. Products
- 11.1.1.3. Company Financials
- 11.1.1.4. SWOT Analysis
- 11.1.2 ITM Power PLC
- 11.1.2.1. Company Overview
- 11.1.2.2. Products
- 11.1.2.3. Company Financials
- 11.1.2.4. SWOT Analysis
- 11.1.3 Toshiba Corporation
- 11.1.3.1. Company Overview
- 11.1.3.2. Products
- 11.1.3.3. Company Financials
- 11.1.3.4. SWOT Analysis
- 11.1.4 Intelligent Energy Limited*List Not Exhaustive
- 11.1.4.1. Company Overview
- 11.1.4.2. Products
- 11.1.4.3. Company Financials
- 11.1.4.4. SWOT Analysis
- 11.1.5 Plug Power Inc
- 11.1.5.1. Company Overview
- 11.1.5.2. Products
- 11.1.5.3. Company Financials
- 11.1.5.4. SWOT Analysis
- 11.1.6 Powercell Sweden AB
- 11.1.6.1. Company Overview
- 11.1.6.2. Products
- 11.1.6.3. Company Financials
- 11.1.6.4. SWOT Analysis
- 11.1.7 Bramble Energy
- 11.1.7.1. Company Overview
- 11.1.7.2. Products
- 11.1.7.3. Company Financials
- 11.1.7.4. SWOT Analysis
- 11.1.8 Cummins Inc
- 11.1.8.1. Company Overview
- 11.1.8.2. Products
- 11.1.8.3. Company Financials
- 11.1.8.4. SWOT Analysis
- 11.1.9 Bloom Energy
- 11.1.9.1. Company Overview
- 11.1.9.2. Products
- 11.1.9.3. Company Financials
- 11.1.9.4. SWOT Analysis
- 11.1.10 Hydrogenics (a Cummins Inc. company)
- 11.1.10.1. Company Overview
- 11.1.10.2. Products
- 11.1.10.3. Company Financials
- 11.1.10.4. SWOT Analysis
- 11.1.1 Ballard Power Systems
- 11.2. Market Entropy
- 11.2.1 Company's Key Areas Served
- 11.2.2 Recent Developments
- 11.3. Company Market Share Analysis 2025
- 11.3.1 Top 5 Companies Market Share Analysis
- 11.3.2 Top 3 Companies Market Share Analysis
- 11.4. List of Potential Customers
- 12. Research Methodology
List of Figures
- Figure 1: Global PEMFC Market Revenue Breakdown (Million, %) by Region 2025 & 2033
- Figure 2: Global PEMFC Market Volume Breakdown (Gigawatt, %) by Region 2025 & 2033
- Figure 3: North America PEMFC Market Revenue (Million), by Production Analysis 2025 & 2033
- Figure 4: North America PEMFC Market Volume (Gigawatt), by Production Analysis 2025 & 2033
- Figure 5: North America PEMFC Market Revenue Share (%), by Production Analysis 2025 & 2033
- Figure 6: North America PEMFC Market Volume Share (%), by Production Analysis 2025 & 2033
- Figure 7: North America PEMFC Market Revenue (Million), by Consumption Analysis 2025 & 2033
- Figure 8: North America PEMFC Market Volume (Gigawatt), by Consumption Analysis 2025 & 2033
- Figure 9: North America PEMFC Market Revenue Share (%), by Consumption Analysis 2025 & 2033
- Figure 10: North America PEMFC Market Volume Share (%), by Consumption Analysis 2025 & 2033
- Figure 11: North America PEMFC Market Revenue (Million), by Import Market Analysis (Value & Volume) 2025 & 2033
- Figure 12: North America PEMFC Market Volume (Gigawatt), by Import Market Analysis (Value & Volume) 2025 & 2033
- Figure 13: North America PEMFC Market Revenue Share (%), by Import Market Analysis (Value & Volume) 2025 & 2033
- Figure 14: North America PEMFC Market Volume Share (%), by Import Market Analysis (Value & Volume) 2025 & 2033
- Figure 15: North America PEMFC Market Revenue (Million), by Export Market Analysis (Value & Volume) 2025 & 2033
- Figure 16: North America PEMFC Market Volume (Gigawatt), by Export Market Analysis (Value & Volume) 2025 & 2033
- Figure 17: North America PEMFC Market Revenue Share (%), by Export Market Analysis (Value & Volume) 2025 & 2033
- Figure 18: North America PEMFC Market Volume Share (%), by Export Market Analysis (Value & Volume) 2025 & 2033
- Figure 19: North America PEMFC Market Revenue (Million), by Price Trend Analysis 2025 & 2033
- Figure 20: North America PEMFC Market Volume (Gigawatt), by Price Trend Analysis 2025 & 2033
- Figure 21: North America PEMFC Market Revenue Share (%), by Price Trend Analysis 2025 & 2033
- Figure 22: North America PEMFC Market Volume Share (%), by Price Trend Analysis 2025 & 2033
- Figure 23: North America PEMFC Market Revenue (Million), by Country 2025 & 2033
- Figure 24: North America PEMFC Market Volume (Gigawatt), by Country 2025 & 2033
- Figure 25: North America PEMFC Market Revenue Share (%), by Country 2025 & 2033
- Figure 26: North America PEMFC Market Volume Share (%), by Country 2025 & 2033
- Figure 27: Europe PEMFC Market Revenue (Million), by Production Analysis 2025 & 2033
- Figure 28: Europe PEMFC Market Volume (Gigawatt), by Production Analysis 2025 & 2033
- Figure 29: Europe PEMFC Market Revenue Share (%), by Production Analysis 2025 & 2033
- Figure 30: Europe PEMFC Market Volume Share (%), by Production Analysis 2025 & 2033
- Figure 31: Europe PEMFC Market Revenue (Million), by Consumption Analysis 2025 & 2033
- Figure 32: Europe PEMFC Market Volume (Gigawatt), by Consumption Analysis 2025 & 2033
- Figure 33: Europe PEMFC Market Revenue Share (%), by Consumption Analysis 2025 & 2033
- Figure 34: Europe PEMFC Market Volume Share (%), by Consumption Analysis 2025 & 2033
- Figure 35: Europe PEMFC Market Revenue (Million), by Import Market Analysis (Value & Volume) 2025 & 2033
- Figure 36: Europe PEMFC Market Volume (Gigawatt), by Import Market Analysis (Value & Volume) 2025 & 2033
- Figure 37: Europe PEMFC Market Revenue Share (%), by Import Market Analysis (Value & Volume) 2025 & 2033
- Figure 38: Europe PEMFC Market Volume Share (%), by Import Market Analysis (Value & Volume) 2025 & 2033
- Figure 39: Europe PEMFC Market Revenue (Million), by Export Market Analysis (Value & Volume) 2025 & 2033
- Figure 40: Europe PEMFC Market Volume (Gigawatt), by Export Market Analysis (Value & Volume) 2025 & 2033
- Figure 41: Europe PEMFC Market Revenue Share (%), by Export Market Analysis (Value & Volume) 2025 & 2033
- Figure 42: Europe PEMFC Market Volume Share (%), by Export Market Analysis (Value & Volume) 2025 & 2033
- Figure 43: Europe PEMFC Market Revenue (Million), by Price Trend Analysis 2025 & 2033
- Figure 44: Europe PEMFC Market Volume (Gigawatt), by Price Trend Analysis 2025 & 2033
- Figure 45: Europe PEMFC Market Revenue Share (%), by Price Trend Analysis 2025 & 2033
- Figure 46: Europe PEMFC Market Volume Share (%), by Price Trend Analysis 2025 & 2033
- Figure 47: Europe PEMFC Market Revenue (Million), by Country 2025 & 2033
- Figure 48: Europe PEMFC Market Volume (Gigawatt), by Country 2025 & 2033
- Figure 49: Europe PEMFC Market Revenue Share (%), by Country 2025 & 2033
- Figure 50: Europe PEMFC Market Volume Share (%), by Country 2025 & 2033
- Figure 51: Asia Pacific PEMFC Market Revenue (Million), by Production Analysis 2025 & 2033
- Figure 52: Asia Pacific PEMFC Market Volume (Gigawatt), by Production Analysis 2025 & 2033
- Figure 53: Asia Pacific PEMFC Market Revenue Share (%), by Production Analysis 2025 & 2033
- Figure 54: Asia Pacific PEMFC Market Volume Share (%), by Production Analysis 2025 & 2033
- Figure 55: Asia Pacific PEMFC Market Revenue (Million), by Consumption Analysis 2025 & 2033
- Figure 56: Asia Pacific PEMFC Market Volume (Gigawatt), by Consumption Analysis 2025 & 2033
- Figure 57: Asia Pacific PEMFC Market Revenue Share (%), by Consumption Analysis 2025 & 2033
- Figure 58: Asia Pacific PEMFC Market Volume Share (%), by Consumption Analysis 2025 & 2033
- Figure 59: Asia Pacific PEMFC Market Revenue (Million), by Import Market Analysis (Value & Volume) 2025 & 2033
- Figure 60: Asia Pacific PEMFC Market Volume (Gigawatt), by Import Market Analysis (Value & Volume) 2025 & 2033
- Figure 61: Asia Pacific PEMFC Market Revenue Share (%), by Import Market Analysis (Value & Volume) 2025 & 2033
- Figure 62: Asia Pacific PEMFC Market Volume Share (%), by Import Market Analysis (Value & Volume) 2025 & 2033
- Figure 63: Asia Pacific PEMFC Market Revenue (Million), by Export Market Analysis (Value & Volume) 2025 & 2033
- Figure 64: Asia Pacific PEMFC Market Volume (Gigawatt), by Export Market Analysis (Value & Volume) 2025 & 2033
- Figure 65: Asia Pacific PEMFC Market Revenue Share (%), by Export Market Analysis (Value & Volume) 2025 & 2033
- Figure 66: Asia Pacific PEMFC Market Volume Share (%), by Export Market Analysis (Value & Volume) 2025 & 2033
- Figure 67: Asia Pacific PEMFC Market Revenue (Million), by Price Trend Analysis 2025 & 2033
- Figure 68: Asia Pacific PEMFC Market Volume (Gigawatt), by Price Trend Analysis 2025 & 2033
- Figure 69: Asia Pacific PEMFC Market Revenue Share (%), by Price Trend Analysis 2025 & 2033
- Figure 70: Asia Pacific PEMFC Market Volume Share (%), by Price Trend Analysis 2025 & 2033
- Figure 71: Asia Pacific PEMFC Market Revenue (Million), by Country 2025 & 2033
- Figure 72: Asia Pacific PEMFC Market Volume (Gigawatt), by Country 2025 & 2033
- Figure 73: Asia Pacific PEMFC Market Revenue Share (%), by Country 2025 & 2033
- Figure 74: Asia Pacific PEMFC Market Volume Share (%), by Country 2025 & 2033
- Figure 75: Rest of the World PEMFC Market Revenue (Million), by Production Analysis 2025 & 2033
- Figure 76: Rest of the World PEMFC Market Volume (Gigawatt), by Production Analysis 2025 & 2033
- Figure 77: Rest of the World PEMFC Market Revenue Share (%), by Production Analysis 2025 & 2033
- Figure 78: Rest of the World PEMFC Market Volume Share (%), by Production Analysis 2025 & 2033
- Figure 79: Rest of the World PEMFC Market Revenue (Million), by Consumption Analysis 2025 & 2033
- Figure 80: Rest of the World PEMFC Market Volume (Gigawatt), by Consumption Analysis 2025 & 2033
- Figure 81: Rest of the World PEMFC Market Revenue Share (%), by Consumption Analysis 2025 & 2033
- Figure 82: Rest of the World PEMFC Market Volume Share (%), by Consumption Analysis 2025 & 2033
- Figure 83: Rest of the World PEMFC Market Revenue (Million), by Import Market Analysis (Value & Volume) 2025 & 2033
- Figure 84: Rest of the World PEMFC Market Volume (Gigawatt), by Import Market Analysis (Value & Volume) 2025 & 2033
- Figure 85: Rest of the World PEMFC Market Revenue Share (%), by Import Market Analysis (Value & Volume) 2025 & 2033
- Figure 86: Rest of the World PEMFC Market Volume Share (%), by Import Market Analysis (Value & Volume) 2025 & 2033
- Figure 87: Rest of the World PEMFC Market Revenue (Million), by Export Market Analysis (Value & Volume) 2025 & 2033
- Figure 88: Rest of the World PEMFC Market Volume (Gigawatt), by Export Market Analysis (Value & Volume) 2025 & 2033
- Figure 89: Rest of the World PEMFC Market Revenue Share (%), by Export Market Analysis (Value & Volume) 2025 & 2033
- Figure 90: Rest of the World PEMFC Market Volume Share (%), by Export Market Analysis (Value & Volume) 2025 & 2033
- Figure 91: Rest of the World PEMFC Market Revenue (Million), by Price Trend Analysis 2025 & 2033
- Figure 92: Rest of the World PEMFC Market Volume (Gigawatt), by Price Trend Analysis 2025 & 2033
- Figure 93: Rest of the World PEMFC Market Revenue Share (%), by Price Trend Analysis 2025 & 2033
- Figure 94: Rest of the World PEMFC Market Volume Share (%), by Price Trend Analysis 2025 & 2033
- Figure 95: Rest of the World PEMFC Market Revenue (Million), by Country 2025 & 2033
- Figure 96: Rest of the World PEMFC Market Volume (Gigawatt), by Country 2025 & 2033
- Figure 97: Rest of the World PEMFC Market Revenue Share (%), by Country 2025 & 2033
- Figure 98: Rest of the World PEMFC Market Volume Share (%), by Country 2025 & 2033
List of Tables
- Table 1: Global PEMFC Market Revenue Million Forecast, by Production Analysis 2020 & 2033
- Table 2: Global PEMFC Market Volume Gigawatt Forecast, by Production Analysis 2020 & 2033
- Table 3: Global PEMFC Market Revenue Million Forecast, by Consumption Analysis 2020 & 2033
- Table 4: Global PEMFC Market Volume Gigawatt Forecast, by Consumption Analysis 2020 & 2033
- Table 5: Global PEMFC Market Revenue Million Forecast, by Import Market Analysis (Value & Volume) 2020 & 2033
- Table 6: Global PEMFC Market Volume Gigawatt Forecast, by Import Market Analysis (Value & Volume) 2020 & 2033
- Table 7: Global PEMFC Market Revenue Million Forecast, by Export Market Analysis (Value & Volume) 2020 & 2033
- Table 8: Global PEMFC Market Volume Gigawatt Forecast, by Export Market Analysis (Value & Volume) 2020 & 2033
- Table 9: Global PEMFC Market Revenue Million Forecast, by Price Trend Analysis 2020 & 2033
- Table 10: Global PEMFC Market Volume Gigawatt Forecast, by Price Trend Analysis 2020 & 2033
- Table 11: Global PEMFC Market Revenue Million Forecast, by Region 2020 & 2033
- Table 12: Global PEMFC Market Volume Gigawatt Forecast, by Region 2020 & 2033
- Table 13: Global PEMFC Market Revenue Million Forecast, by Production Analysis 2020 & 2033
- Table 14: Global PEMFC Market Volume Gigawatt Forecast, by Production Analysis 2020 & 2033
- Table 15: Global PEMFC Market Revenue Million Forecast, by Consumption Analysis 2020 & 2033
- Table 16: Global PEMFC Market Volume Gigawatt Forecast, by Consumption Analysis 2020 & 2033
- Table 17: Global PEMFC Market Revenue Million Forecast, by Import Market Analysis (Value & Volume) 2020 & 2033
- Table 18: Global PEMFC Market Volume Gigawatt Forecast, by Import Market Analysis (Value & Volume) 2020 & 2033
- Table 19: Global PEMFC Market Revenue Million Forecast, by Export Market Analysis (Value & Volume) 2020 & 2033
- Table 20: Global PEMFC Market Volume Gigawatt Forecast, by Export Market Analysis (Value & Volume) 2020 & 2033
- Table 21: Global PEMFC Market Revenue Million Forecast, by Price Trend Analysis 2020 & 2033
- Table 22: Global PEMFC Market Volume Gigawatt Forecast, by Price Trend Analysis 2020 & 2033
- Table 23: Global PEMFC Market Revenue Million Forecast, by Country 2020 & 2033
- Table 24: Global PEMFC Market Volume Gigawatt Forecast, by Country 2020 & 2033
- Table 25: Global PEMFC Market Revenue Million Forecast, by Production Analysis 2020 & 2033
- Table 26: Global PEMFC Market Volume Gigawatt Forecast, by Production Analysis 2020 & 2033
- Table 27: Global PEMFC Market Revenue Million Forecast, by Consumption Analysis 2020 & 2033
- Table 28: Global PEMFC Market Volume Gigawatt Forecast, by Consumption Analysis 2020 & 2033
- Table 29: Global PEMFC Market Revenue Million Forecast, by Import Market Analysis (Value & Volume) 2020 & 2033
- Table 30: Global PEMFC Market Volume Gigawatt Forecast, by Import Market Analysis (Value & Volume) 2020 & 2033
- Table 31: Global PEMFC Market Revenue Million Forecast, by Export Market Analysis (Value & Volume) 2020 & 2033
- Table 32: Global PEMFC Market Volume Gigawatt Forecast, by Export Market Analysis (Value & Volume) 2020 & 2033
- Table 33: Global PEMFC Market Revenue Million Forecast, by Price Trend Analysis 2020 & 2033
- Table 34: Global PEMFC Market Volume Gigawatt Forecast, by Price Trend Analysis 2020 & 2033
- Table 35: Global PEMFC Market Revenue Million Forecast, by Country 2020 & 2033
- Table 36: Global PEMFC Market Volume Gigawatt Forecast, by Country 2020 & 2033
- Table 37: Global PEMFC Market Revenue Million Forecast, by Production Analysis 2020 & 2033
- Table 38: Global PEMFC Market Volume Gigawatt Forecast, by Production Analysis 2020 & 2033
- Table 39: Global PEMFC Market Revenue Million Forecast, by Consumption Analysis 2020 & 2033
- Table 40: Global PEMFC Market Volume Gigawatt Forecast, by Consumption Analysis 2020 & 2033
- Table 41: Global PEMFC Market Revenue Million Forecast, by Import Market Analysis (Value & Volume) 2020 & 2033
- Table 42: Global PEMFC Market Volume Gigawatt Forecast, by Import Market Analysis (Value & Volume) 2020 & 2033
- Table 43: Global PEMFC Market Revenue Million Forecast, by Export Market Analysis (Value & Volume) 2020 & 2033
- Table 44: Global PEMFC Market Volume Gigawatt Forecast, by Export Market Analysis (Value & Volume) 2020 & 2033
- Table 45: Global PEMFC Market Revenue Million Forecast, by Price Trend Analysis 2020 & 2033
- Table 46: Global PEMFC Market Volume Gigawatt Forecast, by Price Trend Analysis 2020 & 2033
- Table 47: Global PEMFC Market Revenue Million Forecast, by Country 2020 & 2033
- Table 48: Global PEMFC Market Volume Gigawatt Forecast, by Country 2020 & 2033
- Table 49: Global PEMFC Market Revenue Million Forecast, by Production Analysis 2020 & 2033
- Table 50: Global PEMFC Market Volume Gigawatt Forecast, by Production Analysis 2020 & 2033
- Table 51: Global PEMFC Market Revenue Million Forecast, by Consumption Analysis 2020 & 2033
- Table 52: Global PEMFC Market Volume Gigawatt Forecast, by Consumption Analysis 2020 & 2033
- Table 53: Global PEMFC Market Revenue Million Forecast, by Import Market Analysis (Value & Volume) 2020 & 2033
- Table 54: Global PEMFC Market Volume Gigawatt Forecast, by Import Market Analysis (Value & Volume) 2020 & 2033
- Table 55: Global PEMFC Market Revenue Million Forecast, by Export Market Analysis (Value & Volume) 2020 & 2033
- Table 56: Global PEMFC Market Volume Gigawatt Forecast, by Export Market Analysis (Value & Volume) 2020 & 2033
- Table 57: Global PEMFC Market Revenue Million Forecast, by Price Trend Analysis 2020 & 2033
- Table 58: Global PEMFC Market Volume Gigawatt Forecast, by Price Trend Analysis 2020 & 2033
- Table 59: Global PEMFC Market Revenue Million Forecast, by Country 2020 & 2033
- Table 60: Global PEMFC Market Volume Gigawatt Forecast, by Country 2020 & 2033
Frequently Asked Questions
1. What is the projected Compound Annual Growth Rate (CAGR) of the PEMFC Market?
The projected CAGR is approximately 18.43%.
2. Which companies are prominent players in the PEMFC Market?
Key companies in the market include Ballard Power Systems, ITM Power PLC, Toshiba Corporation, Intelligent Energy Limited*List Not Exhaustive, Plug Power Inc, Powercell Sweden AB, Bramble Energy, Cummins Inc, Bloom Energy, Hydrogenics (a Cummins Inc. company).
3. What are the main segments of the PEMFC Market?
The market segments include Production Analysis, Consumption Analysis, Import Market Analysis (Value & Volume), Export Market Analysis (Value & Volume), Price Trend Analysis.
4. Can you provide details about the market size?
The market size is estimated to be USD 3.58 Million as of 2022.
5. What are some drivers contributing to market growth?
4.; Growing Demand for Solar Energy4.; Reducing Solar Panel Costs and Associated Components for Solar Projects.
6. What are the notable trends driving market growth?
Government Initiatives and Growing Private Investments are Expected to Drive the Market.
7. Are there any restraints impacting market growth?
4.; Availability of Pure Silicon to make Solar PV Cells.
8. Can you provide examples of recent developments in the market?
August 2022: The National Renewable Energy Laboratory (NREL) began collaborating with Toyota Motor North America (Toyota) through a cooperative research and development agreement to build, install, and evaluate a 1-megawatt (MW) proton exchange membrane (PEM) fuel cell power generation system at NREL's Flatirons Campus.
9. What pricing options are available for accessing the report?
Pricing options include single-user, multi-user, and enterprise licenses priced at USD 4750, USD 5250, and USD 8750 respectively.
10. Is the market size provided in terms of value or volume?
The market size is provided in terms of value, measured in Million and volume, measured in Gigawatt.
11. Are there any specific market keywords associated with the report?
Yes, the market keyword associated with the report is "PEMFC Market," which aids in identifying and referencing the specific market segment covered.
12. How do I determine which pricing option suits my needs best?
The pricing options vary based on user requirements and access needs. Individual users may opt for single-user licenses, while businesses requiring broader access may choose multi-user or enterprise licenses for cost-effective access to the report.
13. Are there any additional resources or data provided in the PEMFC Market report?
While the report offers comprehensive insights, it's advisable to review the specific contents or supplementary materials provided to ascertain if additional resources or data are available.
14. How can I stay updated on further developments or reports in the PEMFC Market?
To stay informed about further developments, trends, and reports in the PEMFC Market, consider subscribing to industry newsletters, following relevant companies and organizations, or regularly checking reputable industry news sources and publications.
Methodology
Step 1 - Identification of Relevant Samples Size from Population Database


Step 2 - Approaches for Defining Global Market Size (Value, Volume* & Price*)

Note*: In applicable scenarios
Step 3 - Data Sources
Primary Research
- Web Analytics
- Survey Reports
- Research Institute
- Latest Research Reports
- Opinion Leaders
Secondary Research
- Annual Reports
- White Paper
- Latest Press Release
- Industry Association
- Paid Database
- Investor Presentations

Step 4 - Data Triangulation
Involves using different sources of information in order to increase the validity of a study
These sources are likely to be stakeholders in a program - participants, other researchers, program staff, other community members, and so on.
Then we put all data in single framework & apply various statistical tools to find out the dynamic on the market.
During the analysis stage, feedback from the stakeholder groups would be compared to determine areas of agreement as well as areas of divergence