
Key Insights
The global Phenol Derivatives market is experiencing robust growth, projected to maintain a Compound Annual Growth Rate (CAGR) exceeding 4.50% from 2025 to 2033. This expansion is driven by several key factors. The increasing demand for bisphenol-A, a crucial component in polycarbonate plastics used extensively in various industries like automotive, electronics, and construction, significantly fuels market growth. Furthermore, the rising adoption of phenolic resins in coatings, adhesives, and composites contributes to market expansion. The robust growth of the construction and automotive sectors, coupled with increasing infrastructure development globally, further stimulates demand for phenol derivatives. Caprolactam and adipic acid, vital components in nylon production, also contribute significantly to the market's growth trajectory. Technological advancements leading to the development of more efficient and sustainable production processes are further enhancing the market's prospects. However, fluctuating raw material prices and environmental concerns related to certain phenol derivatives pose challenges to market growth. The market is segmented by derivatives (Bisphenol-A, Phenolic Resin, Caprolactam, Adipic Acid, and Others), with Bisphenol-A and Phenolic Resin currently dominating the market share due to their widespread applications. Geographically, the Asia-Pacific region, particularly China and India, holds a substantial market share, driven by rapid industrialization and economic growth. North America and Europe also represent significant markets, although their growth rates may be comparatively slower. Key players like DIC Corporation, Shell PLC, and BASF SE are strategically investing in capacity expansion and research & development to capitalize on the market's growth potential and meet increasing demand for sustainable and high-performance phenol derivatives.
The competitive landscape is characterized by a mix of established multinational corporations and regional players. These companies are actively pursuing strategies such as mergers and acquisitions, joint ventures, and product diversification to enhance their market share and product portfolio. The market's future trajectory will largely depend on factors such as global economic growth, technological innovations in production processes, government regulations regarding environmental sustainability, and evolving consumer preferences for eco-friendly materials. The continuous development of new applications for phenol derivatives across various industries will also play a crucial role in shaping the market's future. Continued innovation and strategic partnerships will be essential for companies to maintain a competitive edge in this dynamic market landscape.

Phenol Derivatives Market: A Comprehensive Report (2019-2033)
This in-depth report provides a comprehensive analysis of the Phenol Derivatives Market, offering invaluable insights for industry professionals, investors, and strategic decision-makers. The study covers the period 2019-2033, with a focus on the forecast period 2025-2033 and a base year of 2025. Expect detailed market sizing, segmentation, and competitive landscape analysis, all presented in an easily digestible format.
Phenol Derivatives Market Structure & Innovation Trends
This section analyzes the competitive landscape of the Phenol Derivatives market, encompassing market concentration, innovation drivers, regulatory frameworks, product substitutes, end-user demographics, and mergers & acquisitions (M&A) activities. The market exhibits a moderately concentrated structure, with key players holding significant market share. For example, BASF SE and INEOS Capital Ltd collectively hold an estimated xx% market share as of 2025. Innovation is driven primarily by the demand for sustainable and high-performance materials, leading to investments in bio-based phenol derivatives and advanced manufacturing processes.
- Market Concentration: Moderately concentrated, with top 5 players holding xx% of market share in 2025.
- Innovation Drivers: Sustainability concerns, demand for high-performance materials, and technological advancements in manufacturing.
- Regulatory Framework: Stringent environmental regulations influence product development and manufacturing processes.
- Product Substitutes: Competition from alternative materials, such as bio-based polymers, is impacting market growth.
- End-User Demographics: The market is driven by diverse end-use sectors including automotive, construction, electronics and packaging.
- M&A Activities: The last five years have witnessed xx M&A deals in the Phenol Derivatives Market, with a total deal value estimated at $xx Million.

Phenol Derivatives Market Dynamics & Trends
The Phenol Derivatives market is poised for significant growth, driven by increasing demand from various end-use industries. The Compound Annual Growth Rate (CAGR) for the forecast period (2025-2033) is projected to be xx%, fueled by factors such as rising global population, rapid industrialization, and expanding infrastructure development. Technological advancements in manufacturing processes, including the adoption of bio-based feedstocks, are also contributing to market expansion. Furthermore, evolving consumer preferences toward sustainable and eco-friendly products are driving the adoption of bio-attributed phenol derivatives. The market penetration of bio-based phenol derivatives is expected to reach xx% by 2033. Competitive dynamics are shaped by technological innovation, pricing strategies, and brand recognition.
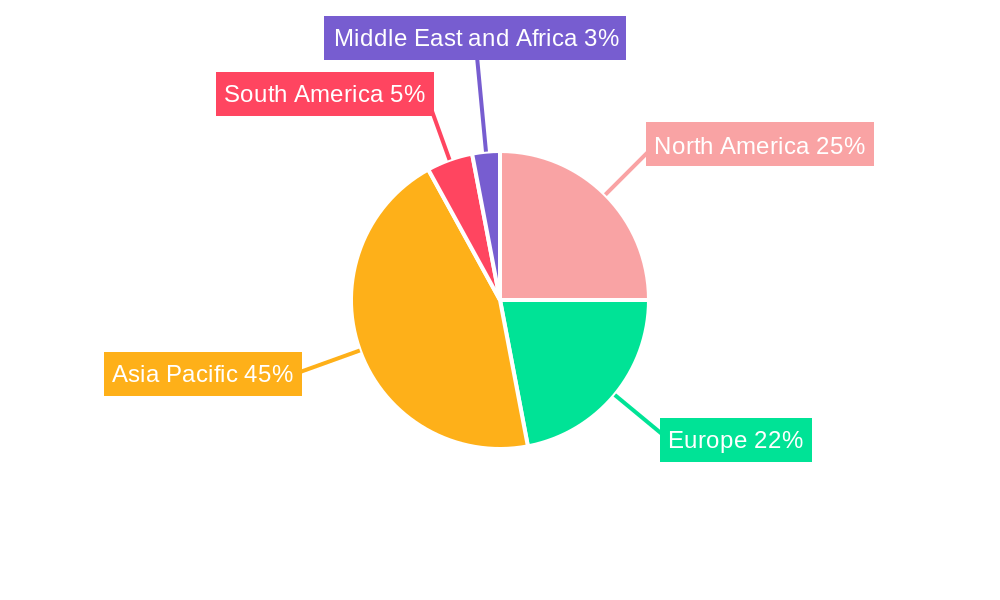
Dominant Regions & Segments in Phenol Derivatives Market
The Asia-Pacific region is currently the dominant market for Phenol Derivatives, driven by robust economic growth, expanding industrialization, and increasing demand from key sectors such as automotive and construction. Within this region, China and India are leading consumers.
Key Drivers for Asia-Pacific Dominance:
- Rapid industrialization and infrastructure development.
- Rising disposable incomes and consumer spending.
- Favorable government policies promoting manufacturing.
Segment Analysis:
- Bisphenol-A: This segment holds a significant market share due to its extensive use in polycarbonate plastics and epoxy resins. The recent opening of a new production facility in Pune, India, underscores the growing demand.
- Phenolic Resin: The phenolic resin segment demonstrates steady growth due to its wide applications in construction, adhesives, and coatings.
- Caprolactam: The caprolactam segment experiences moderate growth, fueled by its use in nylon production.
- Adipic Acid: This segment experiences a healthy growth rate, underpinned by its usage in nylon and polyurethane production.
- Other Derivatives: This segment includes various specialty chemicals exhibiting moderate growth potentials.
Detailed dominance analysis, including market size and growth projections for each segment and region, is provided in the full report.
Phenol Derivatives Market Product Innovations
Recent innovations in the Phenol Derivatives market focus on the development of sustainable and high-performance products. INEOS Phenol's launch of its bio-attributed product line, INVIRIDIS, is a prime example, demonstrating the industry's commitment to reducing reliance on fossil fuels. These innovations cater to the growing demand for environmentally friendly alternatives and enhance the competitive advantages of companies that adopt them.
Report Scope & Segmentation Analysis
This report segments the Phenol Derivatives market by derivatives: Bisphenol-A, Phenolic Resin, Caprolactam, Adipic Acid, and Other Derivatives. Each segment's growth projections, market sizes, and competitive dynamics are analyzed in detail. The market size for Bisphenol-A is projected to reach xx Million by 2033, while Phenolic Resin is expected to reach xx Million. Competitive intensity varies across segments, with Bisphenol-A and Phenolic Resin being more competitive.
Key Drivers of Phenol Derivatives Market Growth
The Phenol Derivatives market's growth is propelled by several factors: growing demand from the automotive, construction, and electronics sectors; rising disposable incomes in developing economies; and the increasing adoption of sustainable materials. Technological advancements in production processes contribute to efficiency gains and cost reductions. Favorable government policies promoting manufacturing also stimulate market expansion.
Challenges in the Phenol Derivatives Market Sector
The Phenol Derivatives market faces challenges including fluctuations in raw material prices, stringent environmental regulations, and intense competition. Supply chain disruptions can lead to production delays and increased costs. Moreover, the emergence of bio-based alternatives presents competitive pressure. These factors have a quantifiable impact on market growth, potentially reducing the CAGR by xx% in certain scenarios.
Emerging Opportunities in Phenol Derivatives Market
Emerging opportunities lie in the development of bio-based and recycled phenol derivatives, catering to growing environmental concerns. Expansion into new and developing markets offers significant potential for growth. Technological advancements in production processes and product applications continue to unlock new market avenues. Further, specialized applications in high-performance materials present exciting prospects.
Leading Players in the Phenol Derivatives Market Market
- DIC Corporation
- Shell PLC
- Fibrant
- Domo Chemical
- AdvanSix Inc
- Cepsa
- Altivia
- BASF SE
- INEOS Capital Ltd
- Fujian Yongrong Jinjiang Co Ltd
- PTT Phenol Company Limited
- Solvay SA
- Mitsubishi Chemical Corporation
- Mitsui Chemicals Inc
Key Developments in Phenol Derivatives Market Industry
- June 2022: INEOS Phenol launched its first bio-attributed product line for phenol, acetone, and alpha-methylstyrene at its Gladbeck, Germany, and Antwerp, Belgium sites, sold under the INVIRIDIS brand. This development highlights the growing shift towards sustainable production practices.
- August 2022: A new bisphenol-A production facility opened in Pune, India. This significantly reduces India's reliance on imports (1.35 lakh tons annually from the US and China), boosting domestic manufacturing and market competitiveness.
Future Outlook for Phenol Derivatives Market Market
The Phenol Derivatives market is projected to experience robust growth driven by increasing demand from various industries. The focus on sustainability and the development of innovative products will shape future market dynamics. Strategic partnerships and investments in research and development will be crucial for companies seeking to capitalize on emerging opportunities and maintain a competitive edge. The market's future is promising, with significant potential for growth in both established and emerging markets.
Phenol Derivatives Market Segmentation
-
1. Derivatives
- 1.1. Bisphenol-A
- 1.2. Phenolic Resin
- 1.3. Caprolactam
- 1.4. Adipic Acid
- 1.5. Other Derivatives
Phenol Derivatives Market Segmentation By Geography
-
1. Asia Pacific
- 1.1. China
- 1.2. India
- 1.3. Japan
- 1.4. South Korea
- 1.5. Rest of Asia Pacific
-
2. North America
- 2.1. United States
- 2.2. Canada
- 2.3. Mexico
-
3. Europe
- 3.1. Germany
- 3.2. France
- 3.3. United Kingdom
- 3.4. Italy
- 3.5. Rest of the Europe
-
4. South America
- 4.1. Brazil
- 4.2. Argentina
- 4.3. Rest of South America
-
5. Middle East and Africa
- 5.1. Saudi Arabia
- 5.2. South Africa
- 5.3. Rest of Middle East and Africa
Phenol Derivatives Market REPORT HIGHLIGHTS
| Aspects | Details |
|---|---|
| Study Period | 2019-2033 |
| Base Year | 2024 |
| Estimated Year | 2025 |
| Forecast Period | 2025-2033 |
| Historical Period | 2019-2024 |
| Growth Rate | CAGR of > 4.50% from 2019-2033 |
| Segmentation |
|
Table of Contents
- 1. Introduction
- 1.1. Research Scope
- 1.2. Market Segmentation
- 1.3. Research Methodology
- 1.4. Definitions and Assumptions
- 2. Executive Summary
- 2.1. Introduction
- 3. Market Dynamics
- 3.1. Introduction
- 3.2. Market Drivers
- 3.2.1 Growing Demand from the Pharmaceutical Industry; Increasing Use of Phenol Derivatives in the Production of Agrochemicals
- 3.2.2 Dyes
- 3.2.3 and Other Specialty Chemicals.
- 3.3. Market Restrains
- 3.3.1. Stringent Environmental Regulations; Volatility in Raw Material Prices
- 3.4. Market Trends
- 3.4.1. Soaring Demand for Phenolic Resin
- 4. Market Factor Analysis
- 4.1. Porters Five Forces
- 4.2. Supply/Value Chain
- 4.3. PESTEL analysis
- 4.4. Market Entropy
- 4.5. Patent/Trademark Analysis
- 5. Global Phenol Derivatives Market Analysis, Insights and Forecast, 2019-2031
- 5.1. Market Analysis, Insights and Forecast - by Derivatives
- 5.1.1. Bisphenol-A
- 5.1.2. Phenolic Resin
- 5.1.3. Caprolactam
- 5.1.4. Adipic Acid
- 5.1.5. Other Derivatives
- 5.2. Market Analysis, Insights and Forecast - by Region
- 5.2.1. Asia Pacific
- 5.2.2. North America
- 5.2.3. Europe
- 5.2.4. South America
- 5.2.5. Middle East and Africa
- 5.1. Market Analysis, Insights and Forecast - by Derivatives
- 6. Asia Pacific Phenol Derivatives Market Analysis, Insights and Forecast, 2019-2031
- 6.1. Market Analysis, Insights and Forecast - by Derivatives
- 6.1.1. Bisphenol-A
- 6.1.2. Phenolic Resin
- 6.1.3. Caprolactam
- 6.1.4. Adipic Acid
- 6.1.5. Other Derivatives
- 6.1. Market Analysis, Insights and Forecast - by Derivatives
- 7. North America Phenol Derivatives Market Analysis, Insights and Forecast, 2019-2031
- 7.1. Market Analysis, Insights and Forecast - by Derivatives
- 7.1.1. Bisphenol-A
- 7.1.2. Phenolic Resin
- 7.1.3. Caprolactam
- 7.1.4. Adipic Acid
- 7.1.5. Other Derivatives
- 7.1. Market Analysis, Insights and Forecast - by Derivatives
- 8. Europe Phenol Derivatives Market Analysis, Insights and Forecast, 2019-2031
- 8.1. Market Analysis, Insights and Forecast - by Derivatives
- 8.1.1. Bisphenol-A
- 8.1.2. Phenolic Resin
- 8.1.3. Caprolactam
- 8.1.4. Adipic Acid
- 8.1.5. Other Derivatives
- 8.1. Market Analysis, Insights and Forecast - by Derivatives
- 9. South America Phenol Derivatives Market Analysis, Insights and Forecast, 2019-2031
- 9.1. Market Analysis, Insights and Forecast - by Derivatives
- 9.1.1. Bisphenol-A
- 9.1.2. Phenolic Resin
- 9.1.3. Caprolactam
- 9.1.4. Adipic Acid
- 9.1.5. Other Derivatives
- 9.1. Market Analysis, Insights and Forecast - by Derivatives
- 10. Middle East and Africa Phenol Derivatives Market Analysis, Insights and Forecast, 2019-2031
- 10.1. Market Analysis, Insights and Forecast - by Derivatives
- 10.1.1. Bisphenol-A
- 10.1.2. Phenolic Resin
- 10.1.3. Caprolactam
- 10.1.4. Adipic Acid
- 10.1.5. Other Derivatives
- 10.1. Market Analysis, Insights and Forecast - by Derivatives
- 11. Asia Pacific Phenol Derivatives Market Analysis, Insights and Forecast, 2019-2031
- 11.1. Market Analysis, Insights and Forecast - By Country/Sub-region
- 11.1.1 China
- 11.1.2 India
- 11.1.3 Japan
- 11.1.4 South Korea
- 11.1.5 Rest of Asia Pacific
- 12. North America Phenol Derivatives Market Analysis, Insights and Forecast, 2019-2031
- 12.1. Market Analysis, Insights and Forecast - By Country/Sub-region
- 12.1.1 United States
- 12.1.2 Canada
- 12.1.3 Mexico
- 13. Europe Phenol Derivatives Market Analysis, Insights and Forecast, 2019-2031
- 13.1. Market Analysis, Insights and Forecast - By Country/Sub-region
- 13.1.1 Germany
- 13.1.2 France
- 13.1.3 United Kingdom
- 13.1.4 Italy
- 13.1.5 Rest of the Europe
- 14. South America Phenol Derivatives Market Analysis, Insights and Forecast, 2019-2031
- 14.1. Market Analysis, Insights and Forecast - By Country/Sub-region
- 14.1.1 Brazil
- 14.1.2 Argentina
- 14.1.3 Rest of South America
- 15. Middle East and Africa Phenol Derivatives Market Analysis, Insights and Forecast, 2019-2031
- 15.1. Market Analysis, Insights and Forecast - By Country/Sub-region
- 15.1.1 Saudi Arabia
- 15.1.2 South Africa
- 15.1.3 Rest of Middle East and Africa
- 16. Competitive Analysis
- 16.1. Global Market Share Analysis 2024
- 16.2. Company Profiles
- 16.2.1 DIC Corporation
- 16.2.1.1. Overview
- 16.2.1.2. Products
- 16.2.1.3. SWOT Analysis
- 16.2.1.4. Recent Developments
- 16.2.1.5. Financials (Based on Availability)
- 16.2.2 Shell PLC
- 16.2.2.1. Overview
- 16.2.2.2. Products
- 16.2.2.3. SWOT Analysis
- 16.2.2.4. Recent Developments
- 16.2.2.5. Financials (Based on Availability)
- 16.2.3 Fibrant
- 16.2.3.1. Overview
- 16.2.3.2. Products
- 16.2.3.3. SWOT Analysis
- 16.2.3.4. Recent Developments
- 16.2.3.5. Financials (Based on Availability)
- 16.2.4 Domo Chemcial
- 16.2.4.1. Overview
- 16.2.4.2. Products
- 16.2.4.3. SWOT Analysis
- 16.2.4.4. Recent Developments
- 16.2.4.5. Financials (Based on Availability)
- 16.2.5 AdvanSix Inc
- 16.2.5.1. Overview
- 16.2.5.2. Products
- 16.2.5.3. SWOT Analysis
- 16.2.5.4. Recent Developments
- 16.2.5.5. Financials (Based on Availability)
- 16.2.6 Cepsa
- 16.2.6.1. Overview
- 16.2.6.2. Products
- 16.2.6.3. SWOT Analysis
- 16.2.6.4. Recent Developments
- 16.2.6.5. Financials (Based on Availability)
- 16.2.7 Altivia
- 16.2.7.1. Overview
- 16.2.7.2. Products
- 16.2.7.3. SWOT Analysis
- 16.2.7.4. Recent Developments
- 16.2.7.5. Financials (Based on Availability)
- 16.2.8 BASF SE
- 16.2.8.1. Overview
- 16.2.8.2. Products
- 16.2.8.3. SWOT Analysis
- 16.2.8.4. Recent Developments
- 16.2.8.5. Financials (Based on Availability)
- 16.2.9 INEOS Capital Ltd
- 16.2.9.1. Overview
- 16.2.9.2. Products
- 16.2.9.3. SWOT Analysis
- 16.2.9.4. Recent Developments
- 16.2.9.5. Financials (Based on Availability)
- 16.2.10 Fujian Yongrong Jinjiang Co Ltd
- 16.2.10.1. Overview
- 16.2.10.2. Products
- 16.2.10.3. SWOT Analysis
- 16.2.10.4. Recent Developments
- 16.2.10.5. Financials (Based on Availability)
- 16.2.11 PTT Phenol Company Limited
- 16.2.11.1. Overview
- 16.2.11.2. Products
- 16.2.11.3. SWOT Analysis
- 16.2.11.4. Recent Developments
- 16.2.11.5. Financials (Based on Availability)
- 16.2.12 Solvay SA*List Not Exhaustive
- 16.2.12.1. Overview
- 16.2.12.2. Products
- 16.2.12.3. SWOT Analysis
- 16.2.12.4. Recent Developments
- 16.2.12.5. Financials (Based on Availability)
- 16.2.13 Mitsubishi Chemcial Corporation
- 16.2.13.1. Overview
- 16.2.13.2. Products
- 16.2.13.3. SWOT Analysis
- 16.2.13.4. Recent Developments
- 16.2.13.5. Financials (Based on Availability)
- 16.2.14 Mitsui Chemcials Inc
- 16.2.14.1. Overview
- 16.2.14.2. Products
- 16.2.14.3. SWOT Analysis
- 16.2.14.4. Recent Developments
- 16.2.14.5. Financials (Based on Availability)
- 16.2.1 DIC Corporation
List of Figures
- Figure 1: Global Phenol Derivatives Market Revenue Breakdown (Million, %) by Region 2024 & 2032
- Figure 2: Asia Pacific Phenol Derivatives Market Revenue (Million), by Country 2024 & 2032
- Figure 3: Asia Pacific Phenol Derivatives Market Revenue Share (%), by Country 2024 & 2032
- Figure 4: North America Phenol Derivatives Market Revenue (Million), by Country 2024 & 2032
- Figure 5: North America Phenol Derivatives Market Revenue Share (%), by Country 2024 & 2032
- Figure 6: Europe Phenol Derivatives Market Revenue (Million), by Country 2024 & 2032
- Figure 7: Europe Phenol Derivatives Market Revenue Share (%), by Country 2024 & 2032
- Figure 8: South America Phenol Derivatives Market Revenue (Million), by Country 2024 & 2032
- Figure 9: South America Phenol Derivatives Market Revenue Share (%), by Country 2024 & 2032
- Figure 10: Middle East and Africa Phenol Derivatives Market Revenue (Million), by Country 2024 & 2032
- Figure 11: Middle East and Africa Phenol Derivatives Market Revenue Share (%), by Country 2024 & 2032
- Figure 12: Asia Pacific Phenol Derivatives Market Revenue (Million), by Derivatives 2024 & 2032
- Figure 13: Asia Pacific Phenol Derivatives Market Revenue Share (%), by Derivatives 2024 & 2032
- Figure 14: Asia Pacific Phenol Derivatives Market Revenue (Million), by Country 2024 & 2032
- Figure 15: Asia Pacific Phenol Derivatives Market Revenue Share (%), by Country 2024 & 2032
- Figure 16: North America Phenol Derivatives Market Revenue (Million), by Derivatives 2024 & 2032
- Figure 17: North America Phenol Derivatives Market Revenue Share (%), by Derivatives 2024 & 2032
- Figure 18: North America Phenol Derivatives Market Revenue (Million), by Country 2024 & 2032
- Figure 19: North America Phenol Derivatives Market Revenue Share (%), by Country 2024 & 2032
- Figure 20: Europe Phenol Derivatives Market Revenue (Million), by Derivatives 2024 & 2032
- Figure 21: Europe Phenol Derivatives Market Revenue Share (%), by Derivatives 2024 & 2032
- Figure 22: Europe Phenol Derivatives Market Revenue (Million), by Country 2024 & 2032
- Figure 23: Europe Phenol Derivatives Market Revenue Share (%), by Country 2024 & 2032
- Figure 24: South America Phenol Derivatives Market Revenue (Million), by Derivatives 2024 & 2032
- Figure 25: South America Phenol Derivatives Market Revenue Share (%), by Derivatives 2024 & 2032
- Figure 26: South America Phenol Derivatives Market Revenue (Million), by Country 2024 & 2032
- Figure 27: South America Phenol Derivatives Market Revenue Share (%), by Country 2024 & 2032
- Figure 28: Middle East and Africa Phenol Derivatives Market Revenue (Million), by Derivatives 2024 & 2032
- Figure 29: Middle East and Africa Phenol Derivatives Market Revenue Share (%), by Derivatives 2024 & 2032
- Figure 30: Middle East and Africa Phenol Derivatives Market Revenue (Million), by Country 2024 & 2032
- Figure 31: Middle East and Africa Phenol Derivatives Market Revenue Share (%), by Country 2024 & 2032
List of Tables
- Table 1: Global Phenol Derivatives Market Revenue Million Forecast, by Region 2019 & 2032
- Table 2: Global Phenol Derivatives Market Revenue Million Forecast, by Derivatives 2019 & 2032
- Table 3: Global Phenol Derivatives Market Revenue Million Forecast, by Region 2019 & 2032
- Table 4: Global Phenol Derivatives Market Revenue Million Forecast, by Country 2019 & 2032
- Table 5: China Phenol Derivatives Market Revenue (Million) Forecast, by Application 2019 & 2032
- Table 6: India Phenol Derivatives Market Revenue (Million) Forecast, by Application 2019 & 2032
- Table 7: Japan Phenol Derivatives Market Revenue (Million) Forecast, by Application 2019 & 2032
- Table 8: South Korea Phenol Derivatives Market Revenue (Million) Forecast, by Application 2019 & 2032
- Table 9: Rest of Asia Pacific Phenol Derivatives Market Revenue (Million) Forecast, by Application 2019 & 2032
- Table 10: Global Phenol Derivatives Market Revenue Million Forecast, by Country 2019 & 2032
- Table 11: United States Phenol Derivatives Market Revenue (Million) Forecast, by Application 2019 & 2032
- Table 12: Canada Phenol Derivatives Market Revenue (Million) Forecast, by Application 2019 & 2032
- Table 13: Mexico Phenol Derivatives Market Revenue (Million) Forecast, by Application 2019 & 2032
- Table 14: Global Phenol Derivatives Market Revenue Million Forecast, by Country 2019 & 2032
- Table 15: Germany Phenol Derivatives Market Revenue (Million) Forecast, by Application 2019 & 2032
- Table 16: France Phenol Derivatives Market Revenue (Million) Forecast, by Application 2019 & 2032
- Table 17: United Kingdom Phenol Derivatives Market Revenue (Million) Forecast, by Application 2019 & 2032
- Table 18: Italy Phenol Derivatives Market Revenue (Million) Forecast, by Application 2019 & 2032
- Table 19: Rest of the Europe Phenol Derivatives Market Revenue (Million) Forecast, by Application 2019 & 2032
- Table 20: Global Phenol Derivatives Market Revenue Million Forecast, by Country 2019 & 2032
- Table 21: Brazil Phenol Derivatives Market Revenue (Million) Forecast, by Application 2019 & 2032
- Table 22: Argentina Phenol Derivatives Market Revenue (Million) Forecast, by Application 2019 & 2032
- Table 23: Rest of South America Phenol Derivatives Market Revenue (Million) Forecast, by Application 2019 & 2032
- Table 24: Global Phenol Derivatives Market Revenue Million Forecast, by Country 2019 & 2032
- Table 25: Saudi Arabia Phenol Derivatives Market Revenue (Million) Forecast, by Application 2019 & 2032
- Table 26: South Africa Phenol Derivatives Market Revenue (Million) Forecast, by Application 2019 & 2032
- Table 27: Rest of Middle East and Africa Phenol Derivatives Market Revenue (Million) Forecast, by Application 2019 & 2032
- Table 28: Global Phenol Derivatives Market Revenue Million Forecast, by Derivatives 2019 & 2032
- Table 29: Global Phenol Derivatives Market Revenue Million Forecast, by Country 2019 & 2032
- Table 30: China Phenol Derivatives Market Revenue (Million) Forecast, by Application 2019 & 2032
- Table 31: India Phenol Derivatives Market Revenue (Million) Forecast, by Application 2019 & 2032
- Table 32: Japan Phenol Derivatives Market Revenue (Million) Forecast, by Application 2019 & 2032
- Table 33: South Korea Phenol Derivatives Market Revenue (Million) Forecast, by Application 2019 & 2032
- Table 34: Rest of Asia Pacific Phenol Derivatives Market Revenue (Million) Forecast, by Application 2019 & 2032
- Table 35: Global Phenol Derivatives Market Revenue Million Forecast, by Derivatives 2019 & 2032
- Table 36: Global Phenol Derivatives Market Revenue Million Forecast, by Country 2019 & 2032
- Table 37: United States Phenol Derivatives Market Revenue (Million) Forecast, by Application 2019 & 2032
- Table 38: Canada Phenol Derivatives Market Revenue (Million) Forecast, by Application 2019 & 2032
- Table 39: Mexico Phenol Derivatives Market Revenue (Million) Forecast, by Application 2019 & 2032
- Table 40: Global Phenol Derivatives Market Revenue Million Forecast, by Derivatives 2019 & 2032
- Table 41: Global Phenol Derivatives Market Revenue Million Forecast, by Country 2019 & 2032
- Table 42: Germany Phenol Derivatives Market Revenue (Million) Forecast, by Application 2019 & 2032
- Table 43: France Phenol Derivatives Market Revenue (Million) Forecast, by Application 2019 & 2032
- Table 44: United Kingdom Phenol Derivatives Market Revenue (Million) Forecast, by Application 2019 & 2032
- Table 45: Italy Phenol Derivatives Market Revenue (Million) Forecast, by Application 2019 & 2032
- Table 46: Rest of the Europe Phenol Derivatives Market Revenue (Million) Forecast, by Application 2019 & 2032
- Table 47: Global Phenol Derivatives Market Revenue Million Forecast, by Derivatives 2019 & 2032
- Table 48: Global Phenol Derivatives Market Revenue Million Forecast, by Country 2019 & 2032
- Table 49: Brazil Phenol Derivatives Market Revenue (Million) Forecast, by Application 2019 & 2032
- Table 50: Argentina Phenol Derivatives Market Revenue (Million) Forecast, by Application 2019 & 2032
- Table 51: Rest of South America Phenol Derivatives Market Revenue (Million) Forecast, by Application 2019 & 2032
- Table 52: Global Phenol Derivatives Market Revenue Million Forecast, by Derivatives 2019 & 2032
- Table 53: Global Phenol Derivatives Market Revenue Million Forecast, by Country 2019 & 2032
- Table 54: Saudi Arabia Phenol Derivatives Market Revenue (Million) Forecast, by Application 2019 & 2032
- Table 55: South Africa Phenol Derivatives Market Revenue (Million) Forecast, by Application 2019 & 2032
- Table 56: Rest of Middle East and Africa Phenol Derivatives Market Revenue (Million) Forecast, by Application 2019 & 2032
Frequently Asked Questions
1. What is the projected Compound Annual Growth Rate (CAGR) of the Phenol Derivatives Market?
The projected CAGR is approximately > 4.50%.
2. Which companies are prominent players in the Phenol Derivatives Market?
Key companies in the market include DIC Corporation, Shell PLC, Fibrant, Domo Chemcial, AdvanSix Inc, Cepsa, Altivia, BASF SE, INEOS Capital Ltd, Fujian Yongrong Jinjiang Co Ltd, PTT Phenol Company Limited, Solvay SA*List Not Exhaustive, Mitsubishi Chemcial Corporation, Mitsui Chemcials Inc.
3. What are the main segments of the Phenol Derivatives Market?
The market segments include Derivatives.
4. Can you provide details about the market size?
The market size is estimated to be USD XX Million as of 2022.
5. What are some drivers contributing to market growth?
Growing Demand from the Pharmaceutical Industry; Increasing Use of Phenol Derivatives in the Production of Agrochemicals. Dyes. and Other Specialty Chemicals..
6. What are the notable trends driving market growth?
Soaring Demand for Phenolic Resin.
7. Are there any restraints impacting market growth?
Stringent Environmental Regulations; Volatility in Raw Material Prices.
8. Can you provide examples of recent developments in the market?
August 2022: A new bisphenol-A production facility was opened in Pune, India. This facility will reduce imports of bisphenol-A to India by promoting domestic manufacturing. 1.35 lakh tons of bisphenol-A are imported into India from the United States and China.
9. What pricing options are available for accessing the report?
Pricing options include single-user, multi-user, and enterprise licenses priced at USD 4750, USD 5250, and USD 8750 respectively.
10. Is the market size provided in terms of value or volume?
The market size is provided in terms of value, measured in Million.
11. Are there any specific market keywords associated with the report?
Yes, the market keyword associated with the report is "Phenol Derivatives Market," which aids in identifying and referencing the specific market segment covered.
12. How do I determine which pricing option suits my needs best?
The pricing options vary based on user requirements and access needs. Individual users may opt for single-user licenses, while businesses requiring broader access may choose multi-user or enterprise licenses for cost-effective access to the report.
13. Are there any additional resources or data provided in the Phenol Derivatives Market report?
While the report offers comprehensive insights, it's advisable to review the specific contents or supplementary materials provided to ascertain if additional resources or data are available.
14. How can I stay updated on further developments or reports in the Phenol Derivatives Market?
To stay informed about further developments, trends, and reports in the Phenol Derivatives Market, consider subscribing to industry newsletters, following relevant companies and organizations, or regularly checking reputable industry news sources and publications.
Methodology
Step 1 - Identification of Relevant Samples Size from Population Database


Step 2 - Approaches for Defining Global Market Size (Value, Volume* & Price*)

Note*: In applicable scenarios
Step 3 - Data Sources
Primary Research
- Web Analytics
- Survey Reports
- Research Institute
- Latest Research Reports
- Opinion Leaders
Secondary Research
- Annual Reports
- White Paper
- Latest Press Release
- Industry Association
- Paid Database
- Investor Presentations

Step 4 - Data Triangulation
Involves using different sources of information in order to increase the validity of a study
These sources are likely to be stakeholders in a program - participants, other researchers, program staff, other community members, and so on.
Then we put all data in single framework & apply various statistical tools to find out the dynamic on the market.
During the analysis stage, feedback from the stakeholder groups would be compared to determine areas of agreement as well as areas of divergence


