Comprehensive Overview of Phosphoramidite Market Trends: 2025-2033

Phosphoramidite Market by Type (DNA Phosphoramidites, RNA Phosphoramidites, Other Phosphoramidites), by End-User (Pharmaceutical and Biotechnology Companies, Academic and Research Institutes, Other End-Users), by North America (United States, Canada, Mexico), by Europe (Germany, United Kingdom, France, Italy, Spain, Rest of Europe), by Asia Pacific (China, Japan, India, Australia, South Korea, Rest of Asia Pacific), by Rest of the World Forecast 2025-2033

Sep 11 2025
Base Year: 2024

234 Pages
Main Logo

Comprehensive Overview of Phosphoramidite Market Trends: 2025-2033


Home
Industries
Healthcare
sponsor image
sponsor image
sponsor image
sponsor image
sponsor image
sponsor image
sponsor image

Tailored for you

  • In-depth Analysis Tailored to Specified Regions or Segments
  • Company Profiles Customized to User Preferences
  • Comprehensive Insights Focused on Specific Segments or Regions
  • Customized Evaluation of Competitive Landscape to Meet Your Needs
  • Tailored Customization to Address Other Specific Requirements
Ask for customization


Key Insights

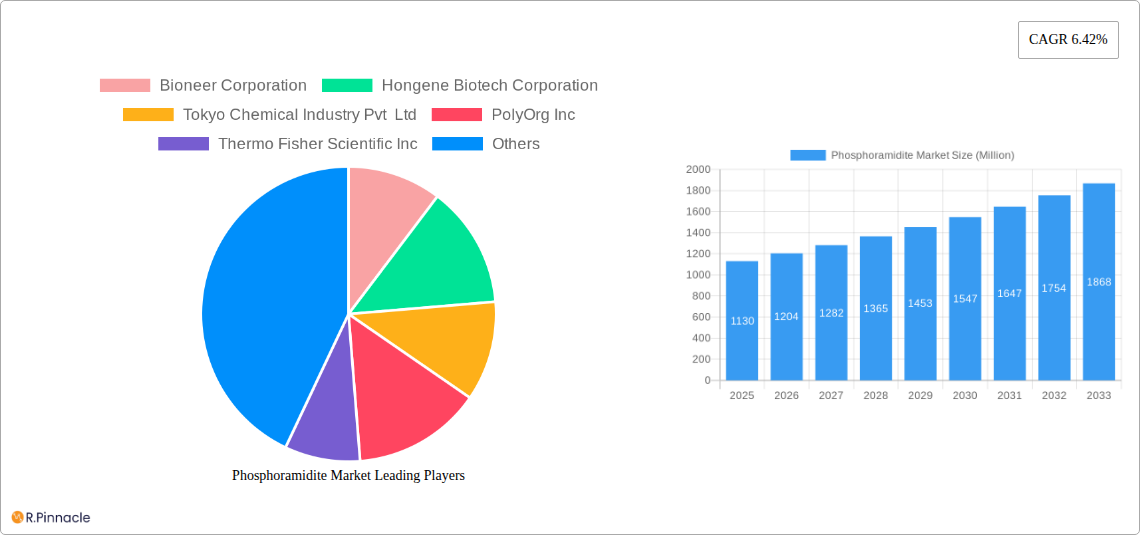
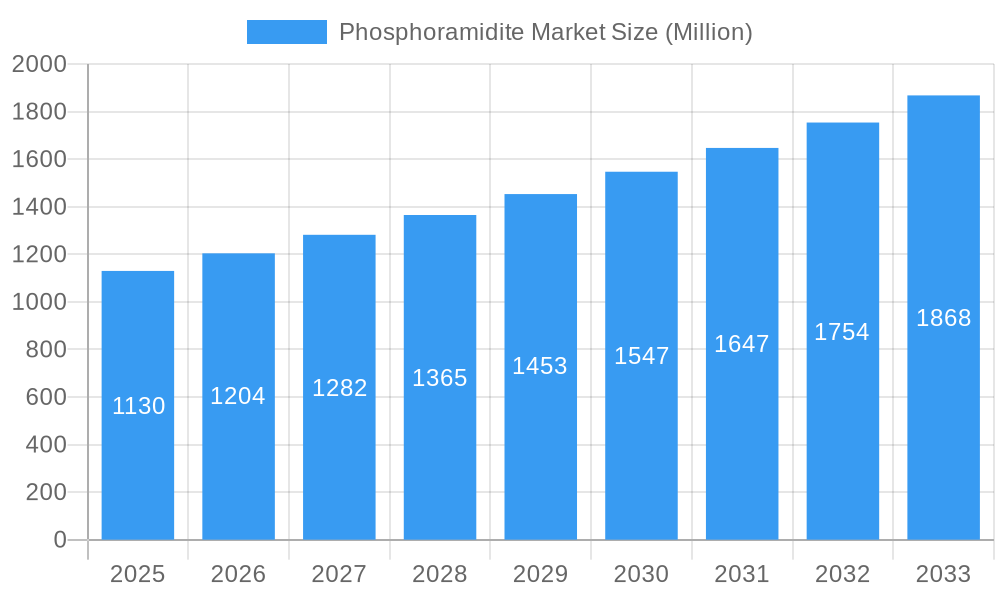
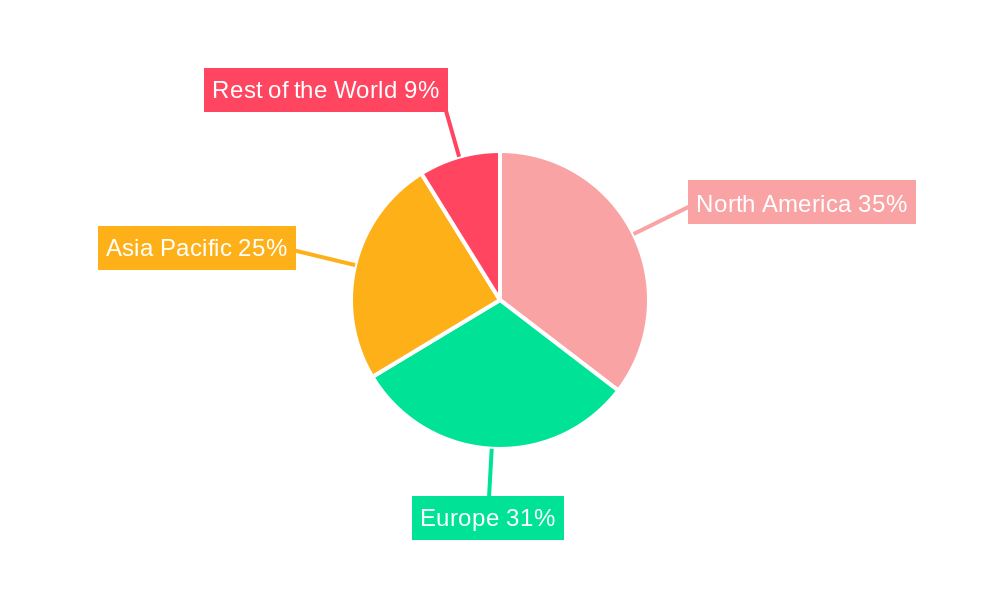
The global phosphoramidite market, valued at $1.13 billion in 2025, is projected to experience robust growth, driven by the escalating demand for oligonucleotide synthesis in pharmaceutical and biotechnology research. The market's Compound Annual Growth Rate (CAGR) of 6.42% from 2025 to 2033 indicates a significant expansion, fueled by advancements in next-generation sequencing (NGS) technologies, personalized medicine initiatives, and the increasing prevalence of genetic diseases. Key drivers include the growing adoption of phosphoramidites in the production of therapeutic oligonucleotides, such as antisense oligonucleotides (ASOs) and small interfering RNA (siRNA), along with their increasing use in diagnostic applications. The pharmaceutical and biotechnology sector constitutes a major end-user segment, followed by academic and research institutions. Growth in these sectors is further boosting market expansion. Competition within the market is intense, with several established players, including Thermo Fisher Scientific, QIAGEN, and Danaher, dominating alongside smaller specialized companies like TriLink BioTechnologies and Bioneer. Regional market distribution likely mirrors the concentration of pharmaceutical and biotechnology research, with North America and Europe holding significant market shares, followed by Asia-Pacific.

The market segmentation reveals a strong preference for DNA phosphoramidites, driven by their extensive use in DNA sequencing and diagnostics. However, RNA phosphoramidites are also experiencing substantial growth due to their applications in RNA interference (RNAi) therapeutics. Future growth will depend on technological advancements leading to higher synthesis efficiency, reduced costs, and the expansion of applications into areas such as gene editing and CRISPR-Cas9 technology. Challenges include potential regulatory hurdles for novel therapeutic oligonucleotides and the need for continuous innovation to meet the increasing demand for high-quality and specialized phosphoramidites. The market's long-term prospects remain positive, with continued investment in research and development likely to stimulate further growth throughout the forecast period.

Phosphoramidite Market: A Comprehensive Report (2019-2033)

This in-depth report provides a comprehensive analysis of the Phosphoramidite Market, offering invaluable insights for industry professionals, investors, and researchers. With a study period spanning 2019-2033, a base year of 2025, and a forecast period of 2025-2033, this report leverages rigorous data analysis to uncover key market trends, growth drivers, and emerging opportunities. The report segments the market by type (DNA Phosphoramidites, RNA Phosphoramidites, Other Phosphoramidites) and end-user (Pharmaceutical and Biotechnology Companies, Academic and Research Institutes, Other End-Users), providing a granular understanding of market dynamics across various segments. Leading companies like Bioneer Corporation, Hongene Biotech Corporation, Tokyo Chemical Industry Pvt Ltd, PolyOrg Inc, Thermo Fisher Scientific Inc, Biosynth Ltd, Lumiprobe Corporation, Danaher Corporation, QIAGEN N V, TriLink BioTechnologies, Creative Biolabs Inc, and BOC Sciences are profiled, examining their market share and competitive strategies.

Phosphoramidite Market Research Report - Market Size, Growth & Forecast

Phosphoramidite Market Market Structure & Innovation Trends

The Phosphoramidite market exhibits a moderately concentrated structure, with the top five players holding approximately xx% of the global market share in 2025. Innovation is primarily driven by advancements in oligonucleotide synthesis technologies, demand for customized phosphoramidites, and the rising adoption of next-generation sequencing (NGS) technologies. Regulatory frameworks, particularly those concerning GMP compliance and environmental regulations, significantly impact market operations. Substitutes for phosphoramidites are limited, strengthening the market's position. M&A activities have been moderate, with an estimated xx Million in deal value recorded between 2019 and 2024. Key observations include:

  • Market Concentration: Top 5 players hold xx% market share (2025).
  • Innovation Drivers: Advancements in oligonucleotide synthesis, customized phosphoramidite demand, NGS technology adoption.
  • Regulatory Landscape: GMP compliance and environmental regulations are key influencers.
  • M&A Activity: Approximately xx Million in deal value (2019-2024).
  • End-User Demographics: Pharmaceutical and Biotechnology companies dominate the end-user segment, driven by increased demand for oligonucleotide therapeutics.
Phosphoramidite Market Growth

Phosphoramidite Market Market Dynamics & Trends

The Phosphoramidite market is experiencing robust growth, with a projected CAGR of xx% during the forecast period (2025-2033). This growth is fueled by several key factors including the increasing demand for oligonucleotide therapeutics, the expanding applications of phosphoramidites in diagnostics and research, and technological advancements that enhance the efficiency and cost-effectiveness of oligonucleotide synthesis. The market penetration rate for phosphoramidites in the pharmaceutical sector is estimated at xx% in 2025, projected to increase to xx% by 2033. Competitive dynamics are shaped by factors such as pricing strategies, product innovation, and geographic expansion. Technological disruptions, such as the development of novel synthesis methods and automation technologies, are continuously reshaping the market landscape. Consumer preferences are shifting towards higher-purity, customized phosphoramidites.

Phosphoramidite Market Growth

Dominant Regions & Segments in Phosphoramidite Market

North America currently dominates the Phosphoramidite market, driven by a strong presence of pharmaceutical and biotechnology companies, robust R&D infrastructure, and favorable regulatory environments. Within the types segment, DNA Phosphoramidites hold the largest market share, followed by RNA Phosphoramidites. The pharmaceutical and biotechnology companies segment is the largest end-user segment.

  • Key Drivers of North American Dominance:

    • Strong presence of pharmaceutical and biotech companies.
    • Well-developed R&D infrastructure.
    • Favorable regulatory environment.
    • High investment in life sciences research.
  • Segment Dominance Analysis:

    • DNA Phosphoramidites: Largest market share due to widespread use in various applications.
    • Pharmaceutical and Biotechnology Companies: Highest demand due to extensive use in drug development and manufacturing.
  • Other Regions: Europe and Asia-Pacific are experiencing substantial growth driven by increasing research activities and government initiatives to support the life sciences sector.

Phosphoramidite Market Product Innovations

Recent product innovations focus on enhancing the efficiency, purity, and scalability of phosphoramidite synthesis. New modified phosphoramidites with improved properties, such as increased stability and reduced side reactions, are being developed. These innovations cater to the growing demand for high-quality oligonucleotides in various applications, providing competitive advantages through improved yield, reduced cost of goods, and expanded applications.

Report Scope & Segmentation Analysis

The report comprehensively segments the Phosphoramidite market based on type and end-user.

By Type:

  • DNA Phosphoramidites: This segment is expected to witness significant growth due to its widespread use in DNA sequencing and gene synthesis. Market size in 2025 is estimated to be xx Million, growing to xx Million by 2033.
  • RNA Phosphoramidites: This segment is driven by the increasing research on RNA interference (RNAi) and the development of RNA-based therapeutics. Market size in 2025 is estimated to be xx Million, growing to xx Million by 2033.
  • Other Phosphoramidites: This segment includes various other types of phosphoramidites used in specialized applications. The market size in 2025 is estimated to be xx Million.

By End-User:

  • Pharmaceutical and Biotechnology Companies: This is the largest segment due to the substantial use of phosphoramidites in drug discovery and development.
  • Academic and Research Institutes: This segment is driven by the rising research activities related to genomics and proteomics.
  • Other End-Users: This includes various other end-users such as diagnostic companies and agricultural biotechnology firms.

Key Drivers of Phosphoramidite Market Growth

The Phosphoramidite market is experiencing significant growth driven by several key factors: the increasing demand for oligonucleotide-based therapeutics, the expanding applications of phosphoramidites in diagnostics and research, and the ongoing advancements in oligonucleotide synthesis technologies which have led to higher efficiency, purity and reduced costs. Government initiatives supporting life sciences research further propel this expansion. Moreover, the rising prevalence of chronic diseases fuels the demand for novel therapeutics, many of which leverage oligonucleotide technology.

Challenges in the Phosphoramidite Market Sector

Challenges include stringent regulatory requirements for oligonucleotide therapeutics, potential supply chain disruptions impacting raw material availability, and intense competition from both established and emerging players. The need for specialized expertise in handling phosphoramidites and ensuring high purity adds complexity and increases costs. These factors collectively constrain market expansion, limiting the overall growth rate.

Emerging Opportunities in Phosphoramidite Market

Emerging opportunities lie in the development of novel phosphoramidites with improved properties, the expansion into new applications such as gene editing and CRISPR-Cas systems, and the growing demand for customized phosphoramidites for specific research and therapeutic applications. Focus on automation and improved synthesis processes presents further opportunities to optimize efficiency and costs. Expanding into emerging markets with growing life sciences sectors also presents significant potential.

Leading Players in the Phosphoramidite Market Market

  • Bioneer Corporation
  • Hongene Biotech Corporation
  • Tokyo Chemical Industry Pvt Ltd
  • PolyOrg Inc
  • Thermo Fisher Scientific Inc
  • Biosynth Ltd
  • Lumiprobe Corporation
  • Danaher Corporation
  • QIAGEN N V
  • TriLink BioTechnologies
  • Creative Biolabs Inc
  • BOC Sciences

Key Developments in Phosphoramidite Market Industry

  • July 2022: WuXi STA launched a new large-scale oligonucleotide and peptide manufacturing facility, enhancing its capacity to meet growing customer needs.
  • March 2023: Oligo Factory opened a new oligo manufacturing facility in Holliston, United States, expanding manufacturing capacity.

Future Outlook for Phosphoramidite Market Market

The Phosphoramidite market is poised for continued growth driven by the expanding applications of oligonucleotides in various fields, including therapeutics, diagnostics, and research. Strategic partnerships, technological advancements, and increasing investments in R&D are expected to further fuel market expansion. Companies focusing on innovation, process optimization, and meeting evolving regulatory requirements are expected to maintain a competitive advantage in this dynamic market.

Phosphoramidite Market Segmentation

  • 1. Type
    • 1.1. DNA Phosphoramidites
    • 1.2. RNA Phosphoramidites
    • 1.3. Other Phosphoramidites
  • 2. End-User
    • 2.1. Pharmaceutical and Biotechnology Companies
    • 2.2. Academic and Research Institutes
    • 2.3. Other End-Users

Phosphoramidite Market Segmentation By Geography

  • 1. North America
    • 1.1. United States
    • 1.2. Canada
    • 1.3. Mexico
  • 2. Europe
    • 2.1. Germany
    • 2.2. United Kingdom
    • 2.3. France
    • 2.4. Italy
    • 2.5. Spain
    • 2.6. Rest of Europe
  • 3. Asia Pacific
    • 3.1. China
    • 3.2. Japan
    • 3.3. India
    • 3.4. Australia
    • 3.5. South Korea
    • 3.6. Rest of Asia Pacific
  • 4. Rest of the World
Phosphoramidite Market Regional Share


Phosphoramidite Market REPORT HIGHLIGHTS

AspectsDetails
Study Period 2019-2033
Base Year 2024
Estimated Year 2025
Forecast Period2025-2033
Historical Period2019-2024
Growth RateCAGR of 6.42% from 2019-2033
Segmentation
    • By Type
      • DNA Phosphoramidites
      • RNA Phosphoramidites
      • Other Phosphoramidites
    • By End-User
      • Pharmaceutical and Biotechnology Companies
      • Academic and Research Institutes
      • Other End-Users
  • By Geography
    • North America
      • United States
      • Canada
      • Mexico
    • Europe
      • Germany
      • United Kingdom
      • France
      • Italy
      • Spain
      • Rest of Europe
    • Asia Pacific
      • China
      • Japan
      • India
      • Australia
      • South Korea
      • Rest of Asia Pacific
    • Rest of the World


Table of Contents

  1. 1. Introduction
    • 1.1. Research Scope
    • 1.2. Market Segmentation
    • 1.3. Research Methodology
    • 1.4. Definitions and Assumptions
  2. 2. Executive Summary
    • 2.1. Introduction
  3. 3. Market Dynamics
    • 3.1. Introduction
      • 3.2. Market Drivers
        • 3.2.1. Increasing Synthetic Nucleotide Applications in Therapeutics; Growth in Synthetic Biology
      • 3.3. Market Restrains
        • 3.3.1. Challenges in Developing Long Nucleotide Sequences
      • 3.4. Market Trends
        • 3.4.1. DNA Phosphoramidites is Expected to Witness Growth Over the Forecast Period
  4. 4. Market Factor Analysis
    • 4.1. Porters Five Forces
    • 4.2. Supply/Value Chain
    • 4.3. PESTEL analysis
    • 4.4. Market Entropy
    • 4.5. Patent/Trademark Analysis
  5. 5. Global Phosphoramidite Market Analysis, Insights and Forecast, 2019-2031
    • 5.1. Market Analysis, Insights and Forecast - by Type
      • 5.1.1. DNA Phosphoramidites
      • 5.1.2. RNA Phosphoramidites
      • 5.1.3. Other Phosphoramidites
    • 5.2. Market Analysis, Insights and Forecast - by End-User
      • 5.2.1. Pharmaceutical and Biotechnology Companies
      • 5.2.2. Academic and Research Institutes
      • 5.2.3. Other End-Users
    • 5.3. Market Analysis, Insights and Forecast - by Region
      • 5.3.1. North America
      • 5.3.2. Europe
      • 5.3.3. Asia Pacific
      • 5.3.4. Rest of the World
  6. 6. North America Phosphoramidite Market Analysis, Insights and Forecast, 2019-2031
    • 6.1. Market Analysis, Insights and Forecast - by Type
      • 6.1.1. DNA Phosphoramidites
      • 6.1.2. RNA Phosphoramidites
      • 6.1.3. Other Phosphoramidites
    • 6.2. Market Analysis, Insights and Forecast - by End-User
      • 6.2.1. Pharmaceutical and Biotechnology Companies
      • 6.2.2. Academic and Research Institutes
      • 6.2.3. Other End-Users
  7. 7. Europe Phosphoramidite Market Analysis, Insights and Forecast, 2019-2031
    • 7.1. Market Analysis, Insights and Forecast - by Type
      • 7.1.1. DNA Phosphoramidites
      • 7.1.2. RNA Phosphoramidites
      • 7.1.3. Other Phosphoramidites
    • 7.2. Market Analysis, Insights and Forecast - by End-User
      • 7.2.1. Pharmaceutical and Biotechnology Companies
      • 7.2.2. Academic and Research Institutes
      • 7.2.3. Other End-Users
  8. 8. Asia Pacific Phosphoramidite Market Analysis, Insights and Forecast, 2019-2031
    • 8.1. Market Analysis, Insights and Forecast - by Type
      • 8.1.1. DNA Phosphoramidites
      • 8.1.2. RNA Phosphoramidites
      • 8.1.3. Other Phosphoramidites
    • 8.2. Market Analysis, Insights and Forecast - by End-User
      • 8.2.1. Pharmaceutical and Biotechnology Companies
      • 8.2.2. Academic and Research Institutes
      • 8.2.3. Other End-Users
  9. 9. Rest of the World Phosphoramidite Market Analysis, Insights and Forecast, 2019-2031
    • 9.1. Market Analysis, Insights and Forecast - by Type
      • 9.1.1. DNA Phosphoramidites
      • 9.1.2. RNA Phosphoramidites
      • 9.1.3. Other Phosphoramidites
    • 9.2. Market Analysis, Insights and Forecast - by End-User
      • 9.2.1. Pharmaceutical and Biotechnology Companies
      • 9.2.2. Academic and Research Institutes
      • 9.2.3. Other End-Users
  10. 10. North America Phosphoramidite Market Analysis, Insights and Forecast, 2019-2031
      • 10.1. Market Analysis, Insights and Forecast - By Country/Sub-region
        • 10.1.1 United States
        • 10.1.2 Canada
        • 10.1.3 Mexico
  11. 11. Europe Phosphoramidite Market Analysis, Insights and Forecast, 2019-2031
      • 11.1. Market Analysis, Insights and Forecast - By Country/Sub-region
        • 11.1.1 Germany
        • 11.1.2 United Kingdom
        • 11.1.3 France
        • 11.1.4 Spain
        • 11.1.5 Italy
        • 11.1.6 Spain
        • 11.1.7 Belgium
        • 11.1.8 Netherland
        • 11.1.9 Nordics
        • 11.1.10 Rest of Europe
  12. 12. Asia Pacific Phosphoramidite Market Analysis, Insights and Forecast, 2019-2031
      • 12.1. Market Analysis, Insights and Forecast - By Country/Sub-region
        • 12.1.1 China
        • 12.1.2 Japan
        • 12.1.3 India
        • 12.1.4 South Korea
        • 12.1.5 Southeast Asia
        • 12.1.6 Australia
        • 12.1.7 Indonesia
        • 12.1.8 Phillipes
        • 12.1.9 Singapore
        • 12.1.10 Thailandc
        • 12.1.11 Rest of Asia Pacific
  13. 13. South America Phosphoramidite Market Analysis, Insights and Forecast, 2019-2031
      • 13.1. Market Analysis, Insights and Forecast - By Country/Sub-region
        • 13.1.1 Brazil
        • 13.1.2 Argentina
        • 13.1.3 Peru
        • 13.1.4 Chile
        • 13.1.5 Colombia
        • 13.1.6 Ecuador
        • 13.1.7 Venezuela
        • 13.1.8 Rest of South America
  14. 14. North America Phosphoramidite Market Analysis, Insights and Forecast, 2019-2031
      • 14.1. Market Analysis, Insights and Forecast - By Country/Sub-region
        • 14.1.1 United States
        • 14.1.2 Canada
        • 14.1.3 Mexico
  15. 15. MEA Phosphoramidite Market Analysis, Insights and Forecast, 2019-2031
      • 15.1. Market Analysis, Insights and Forecast - By Country/Sub-region
        • 15.1.1 United Arab Emirates
        • 15.1.2 Saudi Arabia
        • 15.1.3 South Africa
        • 15.1.4 Rest of Middle East and Africa
  16. 16. Competitive Analysis
    • 16.1. Global Market Share Analysis 2024
      • 16.2. Company Profiles
        • 16.2.1 Bioneer Corporation
          • 16.2.1.1. Overview
          • 16.2.1.2. Products
          • 16.2.1.3. SWOT Analysis
          • 16.2.1.4. Recent Developments
          • 16.2.1.5. Financials (Based on Availability)
        • 16.2.2 Hongene Biotech Corporation
          • 16.2.2.1. Overview
          • 16.2.2.2. Products
          • 16.2.2.3. SWOT Analysis
          • 16.2.2.4. Recent Developments
          • 16.2.2.5. Financials (Based on Availability)
        • 16.2.3 Tokyo Chemical Industry Pvt Ltd
          • 16.2.3.1. Overview
          • 16.2.3.2. Products
          • 16.2.3.3. SWOT Analysis
          • 16.2.3.4. Recent Developments
          • 16.2.3.5. Financials (Based on Availability)
        • 16.2.4 PolyOrg Inc
          • 16.2.4.1. Overview
          • 16.2.4.2. Products
          • 16.2.4.3. SWOT Analysis
          • 16.2.4.4. Recent Developments
          • 16.2.4.5. Financials (Based on Availability)
        • 16.2.5 Thermo Fisher Scientific Inc
          • 16.2.5.1. Overview
          • 16.2.5.2. Products
          • 16.2.5.3. SWOT Analysis
          • 16.2.5.4. Recent Developments
          • 16.2.5.5. Financials (Based on Availability)
        • 16.2.6 Biosynth Ltd
          • 16.2.6.1. Overview
          • 16.2.6.2. Products
          • 16.2.6.3. SWOT Analysis
          • 16.2.6.4. Recent Developments
          • 16.2.6.5. Financials (Based on Availability)
        • 16.2.7 Lumiprobe Corporation
          • 16.2.7.1. Overview
          • 16.2.7.2. Products
          • 16.2.7.3. SWOT Analysis
          • 16.2.7.4. Recent Developments
          • 16.2.7.5. Financials (Based on Availability)
        • 16.2.8 Danaher Corporation
          • 16.2.8.1. Overview
          • 16.2.8.2. Products
          • 16.2.8.3. SWOT Analysis
          • 16.2.8.4. Recent Developments
          • 16.2.8.5. Financials (Based on Availability)
        • 16.2.9 QIAGEN N V
          • 16.2.9.1. Overview
          • 16.2.9.2. Products
          • 16.2.9.3. SWOT Analysis
          • 16.2.9.4. Recent Developments
          • 16.2.9.5. Financials (Based on Availability)
        • 16.2.10 TriLink BioTechnologies
          • 16.2.10.1. Overview
          • 16.2.10.2. Products
          • 16.2.10.3. SWOT Analysis
          • 16.2.10.4. Recent Developments
          • 16.2.10.5. Financials (Based on Availability)
        • 16.2.11 Creative Biolabs Inc
          • 16.2.11.1. Overview
          • 16.2.11.2. Products
          • 16.2.11.3. SWOT Analysis
          • 16.2.11.4. Recent Developments
          • 16.2.11.5. Financials (Based on Availability)
        • 16.2.12 BOC Sciences
          • 16.2.12.1. Overview
          • 16.2.12.2. Products
          • 16.2.12.3. SWOT Analysis
          • 16.2.12.4. Recent Developments
          • 16.2.12.5. Financials (Based on Availability)

List of Figures

  1. Figure 1: Global Phosphoramidite Market Revenue Breakdown (Million, %) by Region 2024 & 2032
  2. Figure 2: Global Phosphoramidite Market Volume Breakdown (K Unit, %) by Region 2024 & 2032
  3. Figure 3: North America Phosphoramidite Market Revenue (Million), by Country 2024 & 2032
  4. Figure 4: North America Phosphoramidite Market Volume (K Unit), by Country 2024 & 2032
  5. Figure 5: North America Phosphoramidite Market Revenue Share (%), by Country 2024 & 2032
  6. Figure 6: North America Phosphoramidite Market Volume Share (%), by Country 2024 & 2032
  7. Figure 7: Europe Phosphoramidite Market Revenue (Million), by Country 2024 & 2032
  8. Figure 8: Europe Phosphoramidite Market Volume (K Unit), by Country 2024 & 2032
  9. Figure 9: Europe Phosphoramidite Market Revenue Share (%), by Country 2024 & 2032
  10. Figure 10: Europe Phosphoramidite Market Volume Share (%), by Country 2024 & 2032
  11. Figure 11: Asia Pacific Phosphoramidite Market Revenue (Million), by Country 2024 & 2032
  12. Figure 12: Asia Pacific Phosphoramidite Market Volume (K Unit), by Country 2024 & 2032
  13. Figure 13: Asia Pacific Phosphoramidite Market Revenue Share (%), by Country 2024 & 2032
  14. Figure 14: Asia Pacific Phosphoramidite Market Volume Share (%), by Country 2024 & 2032
  15. Figure 15: South America Phosphoramidite Market Revenue (Million), by Country 2024 & 2032
  16. Figure 16: South America Phosphoramidite Market Volume (K Unit), by Country 2024 & 2032
  17. Figure 17: South America Phosphoramidite Market Revenue Share (%), by Country 2024 & 2032
  18. Figure 18: South America Phosphoramidite Market Volume Share (%), by Country 2024 & 2032
  19. Figure 19: North America Phosphoramidite Market Revenue (Million), by Country 2024 & 2032
  20. Figure 20: North America Phosphoramidite Market Volume (K Unit), by Country 2024 & 2032
  21. Figure 21: North America Phosphoramidite Market Revenue Share (%), by Country 2024 & 2032
  22. Figure 22: North America Phosphoramidite Market Volume Share (%), by Country 2024 & 2032
  23. Figure 23: MEA Phosphoramidite Market Revenue (Million), by Country 2024 & 2032
  24. Figure 24: MEA Phosphoramidite Market Volume (K Unit), by Country 2024 & 2032
  25. Figure 25: MEA Phosphoramidite Market Revenue Share (%), by Country 2024 & 2032
  26. Figure 26: MEA Phosphoramidite Market Volume Share (%), by Country 2024 & 2032
  27. Figure 27: North America Phosphoramidite Market Revenue (Million), by Type 2024 & 2032
  28. Figure 28: North America Phosphoramidite Market Volume (K Unit), by Type 2024 & 2032
  29. Figure 29: North America Phosphoramidite Market Revenue Share (%), by Type 2024 & 2032
  30. Figure 30: North America Phosphoramidite Market Volume Share (%), by Type 2024 & 2032
  31. Figure 31: North America Phosphoramidite Market Revenue (Million), by End-User 2024 & 2032
  32. Figure 32: North America Phosphoramidite Market Volume (K Unit), by End-User 2024 & 2032
  33. Figure 33: North America Phosphoramidite Market Revenue Share (%), by End-User 2024 & 2032
  34. Figure 34: North America Phosphoramidite Market Volume Share (%), by End-User 2024 & 2032
  35. Figure 35: North America Phosphoramidite Market Revenue (Million), by Country 2024 & 2032
  36. Figure 36: North America Phosphoramidite Market Volume (K Unit), by Country 2024 & 2032
  37. Figure 37: North America Phosphoramidite Market Revenue Share (%), by Country 2024 & 2032
  38. Figure 38: North America Phosphoramidite Market Volume Share (%), by Country 2024 & 2032
  39. Figure 39: Europe Phosphoramidite Market Revenue (Million), by Type 2024 & 2032
  40. Figure 40: Europe Phosphoramidite Market Volume (K Unit), by Type 2024 & 2032
  41. Figure 41: Europe Phosphoramidite Market Revenue Share (%), by Type 2024 & 2032
  42. Figure 42: Europe Phosphoramidite Market Volume Share (%), by Type 2024 & 2032
  43. Figure 43: Europe Phosphoramidite Market Revenue (Million), by End-User 2024 & 2032
  44. Figure 44: Europe Phosphoramidite Market Volume (K Unit), by End-User 2024 & 2032
  45. Figure 45: Europe Phosphoramidite Market Revenue Share (%), by End-User 2024 & 2032
  46. Figure 46: Europe Phosphoramidite Market Volume Share (%), by End-User 2024 & 2032
  47. Figure 47: Europe Phosphoramidite Market Revenue (Million), by Country 2024 & 2032
  48. Figure 48: Europe Phosphoramidite Market Volume (K Unit), by Country 2024 & 2032
  49. Figure 49: Europe Phosphoramidite Market Revenue Share (%), by Country 2024 & 2032
  50. Figure 50: Europe Phosphoramidite Market Volume Share (%), by Country 2024 & 2032
  51. Figure 51: Asia Pacific Phosphoramidite Market Revenue (Million), by Type 2024 & 2032
  52. Figure 52: Asia Pacific Phosphoramidite Market Volume (K Unit), by Type 2024 & 2032
  53. Figure 53: Asia Pacific Phosphoramidite Market Revenue Share (%), by Type 2024 & 2032
  54. Figure 54: Asia Pacific Phosphoramidite Market Volume Share (%), by Type 2024 & 2032
  55. Figure 55: Asia Pacific Phosphoramidite Market Revenue (Million), by End-User 2024 & 2032
  56. Figure 56: Asia Pacific Phosphoramidite Market Volume (K Unit), by End-User 2024 & 2032
  57. Figure 57: Asia Pacific Phosphoramidite Market Revenue Share (%), by End-User 2024 & 2032
  58. Figure 58: Asia Pacific Phosphoramidite Market Volume Share (%), by End-User 2024 & 2032
  59. Figure 59: Asia Pacific Phosphoramidite Market Revenue (Million), by Country 2024 & 2032
  60. Figure 60: Asia Pacific Phosphoramidite Market Volume (K Unit), by Country 2024 & 2032
  61. Figure 61: Asia Pacific Phosphoramidite Market Revenue Share (%), by Country 2024 & 2032
  62. Figure 62: Asia Pacific Phosphoramidite Market Volume Share (%), by Country 2024 & 2032
  63. Figure 63: Rest of the World Phosphoramidite Market Revenue (Million), by Type 2024 & 2032
  64. Figure 64: Rest of the World Phosphoramidite Market Volume (K Unit), by Type 2024 & 2032
  65. Figure 65: Rest of the World Phosphoramidite Market Revenue Share (%), by Type 2024 & 2032
  66. Figure 66: Rest of the World Phosphoramidite Market Volume Share (%), by Type 2024 & 2032
  67. Figure 67: Rest of the World Phosphoramidite Market Revenue (Million), by End-User 2024 & 2032
  68. Figure 68: Rest of the World Phosphoramidite Market Volume (K Unit), by End-User 2024 & 2032
  69. Figure 69: Rest of the World Phosphoramidite Market Revenue Share (%), by End-User 2024 & 2032
  70. Figure 70: Rest of the World Phosphoramidite Market Volume Share (%), by End-User 2024 & 2032
  71. Figure 71: Rest of the World Phosphoramidite Market Revenue (Million), by Country 2024 & 2032
  72. Figure 72: Rest of the World Phosphoramidite Market Volume (K Unit), by Country 2024 & 2032
  73. Figure 73: Rest of the World Phosphoramidite Market Revenue Share (%), by Country 2024 & 2032
  74. Figure 74: Rest of the World Phosphoramidite Market Volume Share (%), by Country 2024 & 2032

List of Tables

  1. Table 1: Global Phosphoramidite Market Revenue Million Forecast, by Region 2019 & 2032
  2. Table 2: Global Phosphoramidite Market Volume K Unit Forecast, by Region 2019 & 2032
  3. Table 3: Global Phosphoramidite Market Revenue Million Forecast, by Type 2019 & 2032
  4. Table 4: Global Phosphoramidite Market Volume K Unit Forecast, by Type 2019 & 2032
  5. Table 5: Global Phosphoramidite Market Revenue Million Forecast, by End-User 2019 & 2032
  6. Table 6: Global Phosphoramidite Market Volume K Unit Forecast, by End-User 2019 & 2032
  7. Table 7: Global Phosphoramidite Market Revenue Million Forecast, by Region 2019 & 2032
  8. Table 8: Global Phosphoramidite Market Volume K Unit Forecast, by Region 2019 & 2032
  9. Table 9: Global Phosphoramidite Market Revenue Million Forecast, by Country 2019 & 2032
  10. Table 10: Global Phosphoramidite Market Volume K Unit Forecast, by Country 2019 & 2032
  11. Table 11: United States Phosphoramidite Market Revenue (Million) Forecast, by Application 2019 & 2032
  12. Table 12: United States Phosphoramidite Market Volume (K Unit) Forecast, by Application 2019 & 2032
  13. Table 13: Canada Phosphoramidite Market Revenue (Million) Forecast, by Application 2019 & 2032
  14. Table 14: Canada Phosphoramidite Market Volume (K Unit) Forecast, by Application 2019 & 2032
  15. Table 15: Mexico Phosphoramidite Market Revenue (Million) Forecast, by Application 2019 & 2032
  16. Table 16: Mexico Phosphoramidite Market Volume (K Unit) Forecast, by Application 2019 & 2032
  17. Table 17: Global Phosphoramidite Market Revenue Million Forecast, by Country 2019 & 2032
  18. Table 18: Global Phosphoramidite Market Volume K Unit Forecast, by Country 2019 & 2032
  19. Table 19: Germany Phosphoramidite Market Revenue (Million) Forecast, by Application 2019 & 2032
  20. Table 20: Germany Phosphoramidite Market Volume (K Unit) Forecast, by Application 2019 & 2032
  21. Table 21: United Kingdom Phosphoramidite Market Revenue (Million) Forecast, by Application 2019 & 2032
  22. Table 22: United Kingdom Phosphoramidite Market Volume (K Unit) Forecast, by Application 2019 & 2032
  23. Table 23: France Phosphoramidite Market Revenue (Million) Forecast, by Application 2019 & 2032
  24. Table 24: France Phosphoramidite Market Volume (K Unit) Forecast, by Application 2019 & 2032
  25. Table 25: Spain Phosphoramidite Market Revenue (Million) Forecast, by Application 2019 & 2032
  26. Table 26: Spain Phosphoramidite Market Volume (K Unit) Forecast, by Application 2019 & 2032
  27. Table 27: Italy Phosphoramidite Market Revenue (Million) Forecast, by Application 2019 & 2032
  28. Table 28: Italy Phosphoramidite Market Volume (K Unit) Forecast, by Application 2019 & 2032
  29. Table 29: Spain Phosphoramidite Market Revenue (Million) Forecast, by Application 2019 & 2032
  30. Table 30: Spain Phosphoramidite Market Volume (K Unit) Forecast, by Application 2019 & 2032
  31. Table 31: Belgium Phosphoramidite Market Revenue (Million) Forecast, by Application 2019 & 2032
  32. Table 32: Belgium Phosphoramidite Market Volume (K Unit) Forecast, by Application 2019 & 2032
  33. Table 33: Netherland Phosphoramidite Market Revenue (Million) Forecast, by Application 2019 & 2032
  34. Table 34: Netherland Phosphoramidite Market Volume (K Unit) Forecast, by Application 2019 & 2032
  35. Table 35: Nordics Phosphoramidite Market Revenue (Million) Forecast, by Application 2019 & 2032
  36. Table 36: Nordics Phosphoramidite Market Volume (K Unit) Forecast, by Application 2019 & 2032
  37. Table 37: Rest of Europe Phosphoramidite Market Revenue (Million) Forecast, by Application 2019 & 2032
  38. Table 38: Rest of Europe Phosphoramidite Market Volume (K Unit) Forecast, by Application 2019 & 2032
  39. Table 39: Global Phosphoramidite Market Revenue Million Forecast, by Country 2019 & 2032
  40. Table 40: Global Phosphoramidite Market Volume K Unit Forecast, by Country 2019 & 2032
  41. Table 41: China Phosphoramidite Market Revenue (Million) Forecast, by Application 2019 & 2032
  42. Table 42: China Phosphoramidite Market Volume (K Unit) Forecast, by Application 2019 & 2032
  43. Table 43: Japan Phosphoramidite Market Revenue (Million) Forecast, by Application 2019 & 2032
  44. Table 44: Japan Phosphoramidite Market Volume (K Unit) Forecast, by Application 2019 & 2032
  45. Table 45: India Phosphoramidite Market Revenue (Million) Forecast, by Application 2019 & 2032
  46. Table 46: India Phosphoramidite Market Volume (K Unit) Forecast, by Application 2019 & 2032
  47. Table 47: South Korea Phosphoramidite Market Revenue (Million) Forecast, by Application 2019 & 2032
  48. Table 48: South Korea Phosphoramidite Market Volume (K Unit) Forecast, by Application 2019 & 2032
  49. Table 49: Southeast Asia Phosphoramidite Market Revenue (Million) Forecast, by Application 2019 & 2032
  50. Table 50: Southeast Asia Phosphoramidite Market Volume (K Unit) Forecast, by Application 2019 & 2032
  51. Table 51: Australia Phosphoramidite Market Revenue (Million) Forecast, by Application 2019 & 2032
  52. Table 52: Australia Phosphoramidite Market Volume (K Unit) Forecast, by Application 2019 & 2032
  53. Table 53: Indonesia Phosphoramidite Market Revenue (Million) Forecast, by Application 2019 & 2032
  54. Table 54: Indonesia Phosphoramidite Market Volume (K Unit) Forecast, by Application 2019 & 2032
  55. Table 55: Phillipes Phosphoramidite Market Revenue (Million) Forecast, by Application 2019 & 2032
  56. Table 56: Phillipes Phosphoramidite Market Volume (K Unit) Forecast, by Application 2019 & 2032
  57. Table 57: Singapore Phosphoramidite Market Revenue (Million) Forecast, by Application 2019 & 2032
  58. Table 58: Singapore Phosphoramidite Market Volume (K Unit) Forecast, by Application 2019 & 2032
  59. Table 59: Thailandc Phosphoramidite Market Revenue (Million) Forecast, by Application 2019 & 2032
  60. Table 60: Thailandc Phosphoramidite Market Volume (K Unit) Forecast, by Application 2019 & 2032
  61. Table 61: Rest of Asia Pacific Phosphoramidite Market Revenue (Million) Forecast, by Application 2019 & 2032
  62. Table 62: Rest of Asia Pacific Phosphoramidite Market Volume (K Unit) Forecast, by Application 2019 & 2032
  63. Table 63: Global Phosphoramidite Market Revenue Million Forecast, by Country 2019 & 2032
  64. Table 64: Global Phosphoramidite Market Volume K Unit Forecast, by Country 2019 & 2032
  65. Table 65: Brazil Phosphoramidite Market Revenue (Million) Forecast, by Application 2019 & 2032
  66. Table 66: Brazil Phosphoramidite Market Volume (K Unit) Forecast, by Application 2019 & 2032
  67. Table 67: Argentina Phosphoramidite Market Revenue (Million) Forecast, by Application 2019 & 2032
  68. Table 68: Argentina Phosphoramidite Market Volume (K Unit) Forecast, by Application 2019 & 2032
  69. Table 69: Peru Phosphoramidite Market Revenue (Million) Forecast, by Application 2019 & 2032
  70. Table 70: Peru Phosphoramidite Market Volume (K Unit) Forecast, by Application 2019 & 2032
  71. Table 71: Chile Phosphoramidite Market Revenue (Million) Forecast, by Application 2019 & 2032
  72. Table 72: Chile Phosphoramidite Market Volume (K Unit) Forecast, by Application 2019 & 2032
  73. Table 73: Colombia Phosphoramidite Market Revenue (Million) Forecast, by Application 2019 & 2032
  74. Table 74: Colombia Phosphoramidite Market Volume (K Unit) Forecast, by Application 2019 & 2032
  75. Table 75: Ecuador Phosphoramidite Market Revenue (Million) Forecast, by Application 2019 & 2032
  76. Table 76: Ecuador Phosphoramidite Market Volume (K Unit) Forecast, by Application 2019 & 2032
  77. Table 77: Venezuela Phosphoramidite Market Revenue (Million) Forecast, by Application 2019 & 2032
  78. Table 78: Venezuela Phosphoramidite Market Volume (K Unit) Forecast, by Application 2019 & 2032
  79. Table 79: Rest of South America Phosphoramidite Market Revenue (Million) Forecast, by Application 2019 & 2032
  80. Table 80: Rest of South America Phosphoramidite Market Volume (K Unit) Forecast, by Application 2019 & 2032
  81. Table 81: Global Phosphoramidite Market Revenue Million Forecast, by Country 2019 & 2032
  82. Table 82: Global Phosphoramidite Market Volume K Unit Forecast, by Country 2019 & 2032
  83. Table 83: United States Phosphoramidite Market Revenue (Million) Forecast, by Application 2019 & 2032
  84. Table 84: United States Phosphoramidite Market Volume (K Unit) Forecast, by Application 2019 & 2032
  85. Table 85: Canada Phosphoramidite Market Revenue (Million) Forecast, by Application 2019 & 2032
  86. Table 86: Canada Phosphoramidite Market Volume (K Unit) Forecast, by Application 2019 & 2032
  87. Table 87: Mexico Phosphoramidite Market Revenue (Million) Forecast, by Application 2019 & 2032
  88. Table 88: Mexico Phosphoramidite Market Volume (K Unit) Forecast, by Application 2019 & 2032
  89. Table 89: Global Phosphoramidite Market Revenue Million Forecast, by Country 2019 & 2032
  90. Table 90: Global Phosphoramidite Market Volume K Unit Forecast, by Country 2019 & 2032
  91. Table 91: United Arab Emirates Phosphoramidite Market Revenue (Million) Forecast, by Application 2019 & 2032
  92. Table 92: United Arab Emirates Phosphoramidite Market Volume (K Unit) Forecast, by Application 2019 & 2032
  93. Table 93: Saudi Arabia Phosphoramidite Market Revenue (Million) Forecast, by Application 2019 & 2032
  94. Table 94: Saudi Arabia Phosphoramidite Market Volume (K Unit) Forecast, by Application 2019 & 2032
  95. Table 95: South Africa Phosphoramidite Market Revenue (Million) Forecast, by Application 2019 & 2032
  96. Table 96: South Africa Phosphoramidite Market Volume (K Unit) Forecast, by Application 2019 & 2032
  97. Table 97: Rest of Middle East and Africa Phosphoramidite Market Revenue (Million) Forecast, by Application 2019 & 2032
  98. Table 98: Rest of Middle East and Africa Phosphoramidite Market Volume (K Unit) Forecast, by Application 2019 & 2032
  99. Table 99: Global Phosphoramidite Market Revenue Million Forecast, by Type 2019 & 2032
  100. Table 100: Global Phosphoramidite Market Volume K Unit Forecast, by Type 2019 & 2032
  101. Table 101: Global Phosphoramidite Market Revenue Million Forecast, by End-User 2019 & 2032
  102. Table 102: Global Phosphoramidite Market Volume K Unit Forecast, by End-User 2019 & 2032
  103. Table 103: Global Phosphoramidite Market Revenue Million Forecast, by Country 2019 & 2032
  104. Table 104: Global Phosphoramidite Market Volume K Unit Forecast, by Country 2019 & 2032
  105. Table 105: United States Phosphoramidite Market Revenue (Million) Forecast, by Application 2019 & 2032
  106. Table 106: United States Phosphoramidite Market Volume (K Unit) Forecast, by Application 2019 & 2032
  107. Table 107: Canada Phosphoramidite Market Revenue (Million) Forecast, by Application 2019 & 2032
  108. Table 108: Canada Phosphoramidite Market Volume (K Unit) Forecast, by Application 2019 & 2032
  109. Table 109: Mexico Phosphoramidite Market Revenue (Million) Forecast, by Application 2019 & 2032
  110. Table 110: Mexico Phosphoramidite Market Volume (K Unit) Forecast, by Application 2019 & 2032
  111. Table 111: Global Phosphoramidite Market Revenue Million Forecast, by Type 2019 & 2032
  112. Table 112: Global Phosphoramidite Market Volume K Unit Forecast, by Type 2019 & 2032
  113. Table 113: Global Phosphoramidite Market Revenue Million Forecast, by End-User 2019 & 2032
  114. Table 114: Global Phosphoramidite Market Volume K Unit Forecast, by End-User 2019 & 2032
  115. Table 115: Global Phosphoramidite Market Revenue Million Forecast, by Country 2019 & 2032
  116. Table 116: Global Phosphoramidite Market Volume K Unit Forecast, by Country 2019 & 2032
  117. Table 117: Germany Phosphoramidite Market Revenue (Million) Forecast, by Application 2019 & 2032
  118. Table 118: Germany Phosphoramidite Market Volume (K Unit) Forecast, by Application 2019 & 2032
  119. Table 119: United Kingdom Phosphoramidite Market Revenue (Million) Forecast, by Application 2019 & 2032
  120. Table 120: United Kingdom Phosphoramidite Market Volume (K Unit) Forecast, by Application 2019 & 2032
  121. Table 121: France Phosphoramidite Market Revenue (Million) Forecast, by Application 2019 & 2032
  122. Table 122: France Phosphoramidite Market Volume (K Unit) Forecast, by Application 2019 & 2032
  123. Table 123: Italy Phosphoramidite Market Revenue (Million) Forecast, by Application 2019 & 2032
  124. Table 124: Italy Phosphoramidite Market Volume (K Unit) Forecast, by Application 2019 & 2032
  125. Table 125: Spain Phosphoramidite Market Revenue (Million) Forecast, by Application 2019 & 2032
  126. Table 126: Spain Phosphoramidite Market Volume (K Unit) Forecast, by Application 2019 & 2032
  127. Table 127: Rest of Europe Phosphoramidite Market Revenue (Million) Forecast, by Application 2019 & 2032
  128. Table 128: Rest of Europe Phosphoramidite Market Volume (K Unit) Forecast, by Application 2019 & 2032
  129. Table 129: Global Phosphoramidite Market Revenue Million Forecast, by Type 2019 & 2032
  130. Table 130: Global Phosphoramidite Market Volume K Unit Forecast, by Type 2019 & 2032
  131. Table 131: Global Phosphoramidite Market Revenue Million Forecast, by End-User 2019 & 2032
  132. Table 132: Global Phosphoramidite Market Volume K Unit Forecast, by End-User 2019 & 2032
  133. Table 133: Global Phosphoramidite Market Revenue Million Forecast, by Country 2019 & 2032
  134. Table 134: Global Phosphoramidite Market Volume K Unit Forecast, by Country 2019 & 2032
  135. Table 135: China Phosphoramidite Market Revenue (Million) Forecast, by Application 2019 & 2032
  136. Table 136: China Phosphoramidite Market Volume (K Unit) Forecast, by Application 2019 & 2032
  137. Table 137: Japan Phosphoramidite Market Revenue (Million) Forecast, by Application 2019 & 2032
  138. Table 138: Japan Phosphoramidite Market Volume (K Unit) Forecast, by Application 2019 & 2032
  139. Table 139: India Phosphoramidite Market Revenue (Million) Forecast, by Application 2019 & 2032
  140. Table 140: India Phosphoramidite Market Volume (K Unit) Forecast, by Application 2019 & 2032
  141. Table 141: Australia Phosphoramidite Market Revenue (Million) Forecast, by Application 2019 & 2032
  142. Table 142: Australia Phosphoramidite Market Volume (K Unit) Forecast, by Application 2019 & 2032
  143. Table 143: South Korea Phosphoramidite Market Revenue (Million) Forecast, by Application 2019 & 2032
  144. Table 144: South Korea Phosphoramidite Market Volume (K Unit) Forecast, by Application 2019 & 2032
  145. Table 145: Rest of Asia Pacific Phosphoramidite Market Revenue (Million) Forecast, by Application 2019 & 2032
  146. Table 146: Rest of Asia Pacific Phosphoramidite Market Volume (K Unit) Forecast, by Application 2019 & 2032
  147. Table 147: Global Phosphoramidite Market Revenue Million Forecast, by Type 2019 & 2032
  148. Table 148: Global Phosphoramidite Market Volume K Unit Forecast, by Type 2019 & 2032
  149. Table 149: Global Phosphoramidite Market Revenue Million Forecast, by End-User 2019 & 2032
  150. Table 150: Global Phosphoramidite Market Volume K Unit Forecast, by End-User 2019 & 2032
  151. Table 151: Global Phosphoramidite Market Revenue Million Forecast, by Country 2019 & 2032
  152. Table 152: Global Phosphoramidite Market Volume K Unit Forecast, by Country 2019 & 2032


Frequently Asked Questions

1. What is the projected Compound Annual Growth Rate (CAGR) of the Phosphoramidite Market?

The projected CAGR is approximately 6.42%.

2. Which companies are prominent players in the Phosphoramidite Market?

Key companies in the market include Bioneer Corporation, Hongene Biotech Corporation, Tokyo Chemical Industry Pvt Ltd, PolyOrg Inc, Thermo Fisher Scientific Inc, Biosynth Ltd, Lumiprobe Corporation, Danaher Corporation, QIAGEN N V, TriLink BioTechnologies, Creative Biolabs Inc, BOC Sciences.

3. What are the main segments of the Phosphoramidite Market?

The market segments include Type, End-User.

4. Can you provide details about the market size?

The market size is estimated to be USD 1.13 Million as of 2022.

5. What are some drivers contributing to market growth?

Increasing Synthetic Nucleotide Applications in Therapeutics; Growth in Synthetic Biology.

6. What are the notable trends driving market growth?

DNA Phosphoramidites is Expected to Witness Growth Over the Forecast Period.

7. Are there any restraints impacting market growth?

Challenges in Developing Long Nucleotide Sequences.

8. Can you provide examples of recent developments in the market?

March 2023: Oligo Factory, an independent custom oligonucleotide manufacturer, opened a new oligo manufacturing facility with 13,000 sq ft of combined offices, bench space, and labs in Holliston, United States.

9. What pricing options are available for accessing the report?

Pricing options include single-user, multi-user, and enterprise licenses priced at USD 4750, USD 5250, and USD 8750 respectively.

10. Is the market size provided in terms of value or volume?

The market size is provided in terms of value, measured in Million and volume, measured in K Unit.

11. Are there any specific market keywords associated with the report?

Yes, the market keyword associated with the report is "Phosphoramidite Market," which aids in identifying and referencing the specific market segment covered.

12. How do I determine which pricing option suits my needs best?

The pricing options vary based on user requirements and access needs. Individual users may opt for single-user licenses, while businesses requiring broader access may choose multi-user or enterprise licenses for cost-effective access to the report.

13. Are there any additional resources or data provided in the Phosphoramidite Market report?

While the report offers comprehensive insights, it's advisable to review the specific contents or supplementary materials provided to ascertain if additional resources or data are available.

14. How can I stay updated on further developments or reports in the Phosphoramidite Market?

To stay informed about further developments, trends, and reports in the Phosphoramidite Market, consider subscribing to industry newsletters, following relevant companies and organizations, or regularly checking reputable industry news sources and publications.


Methodology

Step 1 - Identification of Relevant Samples Size from Population Database

Step Chart
Bar Chart
Method Chart

Step 2 - Approaches for Defining Global Market Size (Value, Volume* & Price*)

Approach Chart
Top-down and bottom-up approaches are used to validate the global market size and estimate the market size for manufactures, regional segments, product, and application.

Note*: In applicable scenarios

Step 3 - Data Sources

Primary Research

  • Web Analytics
  • Survey Reports
  • Research Institute
  • Latest Research Reports
  • Opinion Leaders

Secondary Research

  • Annual Reports
  • White Paper
  • Latest Press Release
  • Industry Association
  • Paid Database
  • Investor Presentations
Analyst Chart

Step 4 - Data Triangulation

Involves using different sources of information in order to increase the validity of a study

These sources are likely to be stakeholders in a program - participants, other researchers, program staff, other community members, and so on.

Then we put all data in single framework & apply various statistical tools to find out the dynamic on the market.

During the analysis stage, feedback from the stakeholder groups would be compared to determine areas of agreement as well as areas of divergence

Additionally, after gathering mixed and scattered data from a wide range of sources, data is triangulated and correlated to come up with estimated figures which are further validated through primary mediums or industry experts, opinion leaders.

About Report Pinnacle

Report Pinnacle provides top-tier market research, industry intelligence, and actionable insights for finance, technology, healthcare, and consumer sectors. Our reports empower you to make informed decisions and achieve business success.

Our expert team combines primary research, data analytics, and industry knowledge to deliver insights you can trust. We offer syndicated reports, custom research, and consulting services tailored to your unique business needs.

At Report Pinnacle, we are committed to quality, transparency, and client satisfaction. Every report is rigorously validated to ensure accuracy and relevance. Our global perspective and local expertise help you understand both broad trends and detailed market shifts.

Stay ahead with Report Pinnacle. Subscribe to our newsletter for the latest insights and research highlights, and follow us on social media for real-time updates.

Report Pinnacle – Your Partner for Reaching the Top in Market Intelligence.

artwork spiralartwork spiralRelated Reports
artwork underline

Diabetes Drugs Market in South Korea Market Predictions: Growth and Size Trends to 2033

Discover the booming South Korean diabetes drugs market, projected to reach $1.37 billion by 2033 with a 4.04% CAGR. This in-depth analysis explores market drivers, trends, restraints, and key players like Pfizer, Novo Nordisk, and Sanofi, providing valuable insights for investors and industry professionals. Learn about market segmentation by product type, end-user, and region.

September 2025
Base Year: 2024
No Of Pages: 197
Price: $3800

Prostate Laser Surgery Market Projected to Grow at XX CAGR: Insights and Forecasts 2025-2033

The global prostate laser surgery market is booming, driven by an aging population and advancements in minimally invasive techniques. Discover key trends, market size projections, leading companies, and regional insights in this comprehensive analysis of the $XX million market projected to reach $XX million by 2033.

September 2025
Base Year: 2024
No Of Pages: 234
Price: $4750

Brain Monitoring Industry Market’s Evolutionary Trends 2025-2033

The global brain monitoring market is booming, projected to reach $11.49 billion by 2033, driven by rising neurological disease prevalence and technological advancements. Explore key trends, market segmentation, and leading companies in this rapidly expanding sector.

September 2025
Base Year: 2024
No Of Pages: 234
Price: $4750

Overcoming Challenges in Active Wound Care Market Market: Strategic Insights 2025-2033

The active wound care market is booming, projected to reach $XX million by 2033 with a 4.64% CAGR. Discover key trends, drivers, and leading companies shaping this rapidly growing sector, encompassing biomaterials, skin substitutes, and growth factors for chronic & acute wound management.

September 2025
Base Year: 2024
No Of Pages: 234
Price: $4750

Exploring Growth Avenues in Mexico Diagnostic Imaging Equipment Market Market

Discover the booming Mexico Diagnostic Imaging Equipment Market! This comprehensive analysis reveals a CAGR of 6.10% (2019-2024), driven by rising chronic diseases & healthcare investment. Explore market size, segmentation (MRI, CT, Ultrasound, X-ray), key players (GE, Siemens, Philips), and future growth projections to 2033.

September 2025
Base Year: 2024
No Of Pages: 197
Price: $3800

Vascular Guidewires Market Market Size and Trends 2025-2033: Comprehensive Outlook

The Vascular Guidewires Market is booming, projected to reach $XX million by 2033 with a CAGR of 5.20%. Driven by increasing cardiovascular disease prevalence and technological advancements, this market offers lucrative opportunities for key players like Boston Scientific and Medtronic. Explore market trends, segmentation (coronary, peripheral, neurovascular), and regional analysis in this comprehensive report.

September 2025
Base Year: 2024
No Of Pages: 234
Price: $4750

Global Oxytocin Market Decoded: Comprehensive Analysis and Forecasts 2025-2033

Discover the latest insights into the booming global oxytocin market, projected to reach $2.38 billion by 2033 with a 5.40% CAGR. This comprehensive analysis covers market drivers, trends, restraints, regional breakdowns (North America, Europe, Asia-Pacific, etc.), key players (Pfizer, Viatris, etc.), and distribution channels. Learn about the growing applications in postpartum care, labor induction, and beyond.

September 2025
Base Year: 2024
No Of Pages: 234
Price: $4750

Comprehensive Overview of Phosphoramidite Market Trends: 2025-2033

The global phosphoramidite market is booming, projected to reach [estimated 2033 value] by 2033, driven by surging demand for oligonucleotide synthesis in pharma and biotech. Explore market trends, key players (Thermo Fisher, QIAGEN, TriLink), and regional insights in this comprehensive analysis. Discover the impact of NGS and personalized medicine on this rapidly growing sector.

September 2025
Base Year: 2024
No Of Pages: 234
Price: $4750

Strategic Analysis of Glioma Diagnosis and Treatment Industry Industry Opportunities

The global glioma diagnosis and treatment market is booming, projected to reach $5.25 billion by 2033 with an 8% CAGR. This comprehensive analysis explores market drivers, trends, restraints, key players (Teva, Amgen, Merck), and regional variations. Discover the latest advancements in chemotherapy, radiation therapy, and emerging treatments for glioma.

September 2025
Base Year: 2024
No Of Pages: 234
Price: $4750

Pharmaceutical Elixir Market 2025-2033 Analysis: Trends, Competitor Dynamics, and Growth Opportunities

Discover the booming Pharmaceutical Elixir Market, projected to reach $6.97 Billion by 2033 with an 8.9% CAGR. This comprehensive analysis explores market drivers, trends, restraints, segmentation (medicated/non-medicated, distribution channels, end-users), key players (Cipla, Novartis, etc.), and regional growth projections. Get insights into this lucrative sector now!

September 2025
Base Year: 2024
No Of Pages: 234
Price: $4750

Strategic Insights for Apheresis Equipment Market Market Expansion

Discover the latest insights on the booming apheresis equipment market. Explore market size, CAGR, key drivers, regional trends, and leading companies shaping this $3.52B industry (2025). Learn about growth opportunities in leukapheresis, plasmapheresis, and other apheresis procedures.

September 2025
Base Year: 2024
No Of Pages: 234
Price: $4750

Digital X-Ray Market in Japan Market Consumption Trends: Growth Analysis 2025-2033

Discover the booming Japanese digital X-ray market! This comprehensive analysis reveals key trends, growth drivers, and leading companies in this dynamic sector, projected to reach significant value by 2033. Explore market segmentation, regional insights, and future opportunities in digital radiology in Japan.

September 2025
Base Year: 2024
No Of Pages: 197
Price: $3800

Demand Patterns in Cervical Cancer Screening Industry Market: Projections to 2033

Discover the latest insights into the booming cervical cancer screening market. Explore market size, growth projections (CAGR 4.36%), key drivers, trends, and restraints impacting this dynamic industry. Learn about leading companies, diagnostic tests (Pap smear, HPV), therapeutics (vaccines, drugs), and regional market shares. Access valuable data for informed business decisions.

September 2025
Base Year: 2024
No Of Pages: 150
Price: $4750

Emerging Insulin Drugs And Delivery Devices Market in Canada Trends and Opportunities

Discover the latest insights into the booming Canadian insulin drugs and delivery devices market. Explore market size projections, growth drivers, key players (Sanofi, Novo Nordisk, Eli Lilly), and emerging trends in insulin pumps, pens, and biosimilars. Understand the challenges and opportunities in this vital healthcare sector.

September 2025
Base Year: 2024
No Of Pages: 197
Price: $3800

China Diabetes Devices Market Market Demand and Consumption Trends: Outlook 2025-2033

The China diabetes devices market is booming, projected to reach [Insert Projected 2033 Value based on chart data] by 2033, driven by rising diabetes prevalence and technological advancements. Explore market size, CAGR, key players (Roche, Medtronic, Abbott), and growth drivers in this comprehensive analysis.

September 2025
Base Year: 2024
No Of Pages: 197
Price: $3800

UAE Medical Aesthetic Devices Market 2025-2033 Analysis: Trends, Competitor Dynamics, and Growth Opportunities

Discover the booming UAE Medical Aesthetic Devices market! This in-depth analysis reveals key trends, growth drivers (like rising disposable incomes and medical tourism), and leading players in the sector. Explore market size projections, segment breakdowns (energy-based, non-energy-based devices), and future opportunities.

September 2025
Base Year: 2024
No Of Pages: 234
Price: $4750

Protein Stability Analysis Market Industry’s Future Growth Prospects

The Protein Stability Analysis market is booming, projected to reach $XX million by 2033 with a CAGR of 8.40%. Discover key trends, leading companies (Horiba, PerkinElmer, Thermo Fisher), and market segmentation in our comprehensive analysis. Learn how advancements in techniques like chromatography and spectroscopy are driving growth.

September 2025
Base Year: 2024
No Of Pages: 234
Price: $4750

Unlocking the Future of US Veterinary Healthcare Industry: Growth and Trends 2025-2033

The US veterinary healthcare market is booming, projected to reach nearly $50 billion by 2033 with a 5% CAGR. Discover key drivers, trends, and market segments impacting growth in this dynamic industry, including pet humanization, advanced diagnostics, and therapeutic innovations. Learn about leading companies and regional market shares.

September 2025
Base Year: 2024
No Of Pages: 197
Price: $3800

Laboratory Gas Generators Market Market’s Consumer Preferences: Trends and Analysis 2025-2033

The Laboratory Gas Generators Market is booming, projected to reach $504.22 million in 2025, with a CAGR of 6.59% through 2033. Driven by increasing R&D and cost-efficiency needs, this market offers opportunities across various segments including nitrogen, hydrogen, and zero-air generators. Explore key trends and leading companies in this expanding sector.

September 2025
Base Year: 2024
No Of Pages: 234
Price: $4750

Combination Drugs Industry for Diabetes Competitor Insights: Trends and Opportunities 2025-2033

The global market for combination diabetes drugs is booming, projected to reach $1.09B in 2025 and grow at a CAGR of 10.87% through 2033. Learn about key market drivers, leading companies (Novo Nordisk, Sanofi, Merck), regional trends, and the future of this rapidly expanding sector.

September 2025
Base Year: 2024
No Of Pages: 234
Price: $4750

Neuroendoscopy Market Future-proof Strategies: Trends, Competitor Dynamics, and Opportunities 2025-2033

The neuroendoscopy market is booming, projected to reach \$5.08 Billion by 2033, driven by minimally invasive surgeries & technological advancements. Explore market trends, regional analysis, key players (Schindler, Machida, Adeor), and growth forecasts for rigid & flexible neuroendoscopes in our comprehensive report.

September 2025
Base Year: 2024
No Of Pages: 234
Price: $4750

Pharmaceutical Market in Netherlands 2025 Market Trends and 2033 Forecasts: Exploring Growth Potential

Discover the latest insights into the booming Netherlands pharmaceutical market. Explore key trends, growth drivers, and major players shaping this dynamic sector, including market size projections to 2033 and segment analysis by therapeutic area and dispensing method.

September 2025
Base Year: 2024
No Of Pages: 197
Price: $3800

Mexico Ophthalmic Devices Market: Growth Opportunities and Competitive Landscape Overview 2025-2033

Discover the booming Mexico ophthalmic devices market! This comprehensive analysis reveals market size, CAGR, key drivers, trends, and restraints, featuring insights into surgical, diagnostic, and vision correction devices. Learn about leading companies and forecast trends through 2033.

August 2025
Base Year: 2024
No Of Pages: 197
Price: $3800

Inflation Devices Market Projected to Grow at XX CAGR: Insights and Forecasts 2025-2033

The Inflation Devices Market is booming, projected to reach $XX million by 2033 with a 4.70% CAGR. Driven by rising cardiovascular disease prevalence and minimally invasive procedures, this market analysis covers key segments (Interventional Cardiology, Digital Displays etc.), major players (Boston Scientific, Medtronic etc.), and regional trends. Discover growth opportunities and competitive landscape insights.

August 2025
Base Year: 2024
No Of Pages: 234
Price: $4750

Comprehensive Review of Veterinary Laser Industry Growth Potential

The veterinary laser therapy market is booming, with an 8.30% CAGR. Discover key trends, applications (pain management, tissue repair), leading companies, and regional insights for this rapidly growing sector in our comprehensive market analysis. Explore the future of animal healthcare with laser technology.

August 2025
Base Year: 2024
No Of Pages: 234
Price: $4750

Understanding Consumer Behavior in Global Artificial Intelligence in Diagnostics Market Market: 2025-2033

The Global AI in Diagnostics Market is booming, with a 33.14% CAGR. Learn about key drivers, trends, and the leading companies shaping this transformative sector, including AI-powered image analysis for cardiology, oncology, and neurology. Explore market size projections, regional breakdowns, and the future of AI in healthcare diagnostics.

August 2025
Base Year: 2024
No Of Pages: 234
Price: $4750

Large Volume Parenteral Industry Industry Insights and Forecasts

Discover the booming Large Volume Parenteral (LVP) market trends and projections for 2025-2033. This in-depth analysis reveals market size, CAGR, key drivers, restraints, regional insights, and competitive landscape, featuring major players like Fresenius Kabi and Baxter. Explore segmentations by volume, application, and packaging.

August 2025
Base Year: 2024
No Of Pages: 234
Price: $4750

Meglitinide Market in Europe Projected to Grow at XX CAGR: Insights and Forecasts 2025-2033

Discover the latest insights on the European meglitinide market. This comprehensive analysis reveals market size, growth projections (CAGR 2.30%), key players (Novo Nordisk, Boehringer Ingelheim, etc.), and regional trends. Learn about market drivers, restraints, and future growth opportunities in this dynamic sector.

August 2025
Base Year: 2024
No Of Pages: 234
Price: $4750

Emerging Markets for Germicidal Irradiation Market Industry

Discover the booming germicidal irradiation market! This in-depth analysis reveals a CAGR of 8.90% driven by rising healthcare infections & technological advancements. Explore market segmentation, key players (Volcano Corporation, Halma PLC, GE Healthcare), and regional trends in North America, Europe, and Asia-Pacific. Get insights for 2025-2033.

August 2025
Base Year: 2024
No Of Pages: 234
Price: $4750

Asia-Pacific Artificial Organs and Bionic Implants Market’s Role in Shaping Industry Trends 2025-2033

The Asia-Pacific artificial organs and bionic implants market is booming, projected to reach $7.59 billion by 2025, with an 8.10% CAGR. Discover key trends, drivers, and leading companies shaping this rapidly growing sector. Explore market analysis and future projections for artificial hearts, kidneys, bionics, and more.

August 2025
Base Year: 2024
No Of Pages: 234
Price: $4750

Growth Catalysts in Wearable Tracking Devices Market Market

The Wearable Tracking Devices market is booming, projected to reach [estimated 2033 market size] by 2033, with a CAGR of 15.6%. Discover key trends, leading companies (Fitbit, Apple, Samsung), and regional insights in this comprehensive market analysis. Explore the growth drivers, restraints, and segments shaping this dynamic industry.

August 2025
Base Year: 2024
No Of Pages: 234
Price: $4750

Emerging Market Insights in APAC Remote Patient Monitoring Systems Industry: 2025-2033 Overview

The APAC Remote Patient Monitoring (RPM) market is booming, projected to reach $3.5 Billion by 2033, driven by rising chronic diseases, technological advancements, and government initiatives. Explore key market trends, leading companies, and growth opportunities in this comprehensive analysis.

August 2025
Base Year: 2024
No Of Pages: 100
Price: $4750

Enzyme Inhibitors Drugs Industry in North America: Market Dynamics and Forecasts 2025-2033

Discover the latest market analysis on Enzyme Inhibitors Drugs, a rapidly expanding sector with a projected CAGR of 3.95%. This comprehensive report explores market size, drivers, trends, restraints, and key players, covering segments like PPIs, Protease Inhibitors, and regional breakdowns. Learn about growth opportunities and challenges in this vital pharmaceutical market.

August 2025
Base Year: 2024
No Of Pages: 234
Price: $4750

Poultry Vaccines Industry Competitive Strategies: Trends and Forecasts 2025-2033

The global poultry vaccines market is booming, projected to reach [estimated 2033 market size based on CAGR] by 2033, driven by rising poultry consumption, emerging diseases like Avian Influenza, and advancements in vaccine technology. Learn about market trends, key players (Zoetis, Elanco, Merck), and regional growth in our comprehensive analysis.

August 2025
Base Year: 2024
No Of Pages: 234
Price: $4750

Emerging Markets for North America Lab-on-a-Chip Industry Industry

The North American lab-on-a-chip market is booming, projected to reach $X million by 2033, driven by advancements in diagnostics, drug discovery, and personalized medicine. Explore market trends, key players, and growth opportunities in this dynamic sector.

August 2025
Base Year: 2024
No Of Pages: 150
Price: $4750

Particle Therapy Market in Developing Economies: Trends and Growth Analysis 2025-2033

The global particle therapy market is booming, projected at a 7.60% CAGR through 2033. Discover key drivers, trends, and restraints shaping this dynamic sector, including proton therapy, heavy ion therapy, and regional market analysis. Learn about leading companies and the future of cancer treatment innovation.

August 2025
Base Year: 2024
No Of Pages: 234
Price: $4750

Comprehensive Overview of France Self-Monitoring Blood Glucose Devices Market Trends: 2025-2033

Discover the booming France self-monitoring blood glucose (SMBG) devices market! This comprehensive analysis reveals a €532 million market in 2025, projected to grow at a CAGR of 7.18% until 2033. Explore key drivers, trends, restraints, and leading companies shaping this dynamic sector. Learn more about glucometer devices, test strips, and lancets.

August 2025
Base Year: 2024
No Of Pages: 100
Price: $3800

Consumer Behavior and Diabetes Drugs Market in Italy Trends

Discover the latest market analysis of the Italian diabetes drugs market (2025-2033). Explore key growth drivers, including rising diabetes prevalence and innovative drug therapies, alongside market restraints and detailed segmentation. Learn about the leading pharmaceutical companies and projected market size.

August 2025
Base Year: 2024
No Of Pages: 197
Price: $3800

Decoding UK Artificial Organs & Bionic Implants Market’s Market Size Potential by 2033

Discover the UK's thriving artificial organs & bionic implants market, projected to reach £174 million by 2033. Explore market drivers, trends, and challenges shaping this innovative sector, including key players like Medtronic and Edwards Lifesciences.

August 2025
Base Year: 2024
No Of Pages: 197
Price: $3800

Hematology Analyzers Industry Competitive Advantage: Trends and Opportunities to 2033

The global hematology analyzers market is booming, projected to reach $11.1 billion by 2033, driven by rising blood disorder prevalence, technological advancements, and an aging population. Explore market trends, key players (Siemens, Abbott, Roche), and regional growth in this detailed analysis.

August 2025
Base Year: 2024
No Of Pages: 150
Price: $4750

Patient Recliners Market Competitive Advantage: Trends and Opportunities to 2033

The global Patient Recliners Market is booming, projected to reach [estimated market size in 2033] by 2033, with a CAGR of 12.50%. Driven by aging populations and advancements in healthcare technology, this market offers lucrative opportunities for investors and industry players. Learn about key trends, leading companies, and regional growth projections.

August 2025
Base Year: 2024
No Of Pages: 234
Price: $4750

Australia Endoscopic Spinal Surgery Industry Industry Overview and Projections

Discover the booming Australian endoscopic spinal surgery market! This report reveals a $384.82M market in 2025, projecting strong growth to 2033. Explore key drivers, trends, restraints, and leading companies shaping this minimally invasive surgery sector.

August 2025
Base Year: 2024
No Of Pages: 197
Price: $3800

Europe Epigenetics Industry Future-Proofing Growth: Strategic Insights and Analysis 2025-2033

The European epigenetics market is booming, with a projected CAGR of 14.50% through 2033. This in-depth analysis explores market size, key drivers (cancer diagnostics, technological advancements), restraints, segmentation (by technology, product, application), and leading companies. Discover the growth potential in oncology, non-oncology applications, and key European regions.

August 2025
Base Year: 2024
No Of Pages: 234
Price: $4750

Unveiling Global Dental Bone Void Filler Market Growth Patterns: CAGR Analysis and Forecasts 2025-2033

The global dental bone void filler market is booming, projected to reach [estimated market size in 2033] by 2033, driven by rising dental procedures and advancements in biomaterials. Explore market trends, leading companies (DePuy Synthes, Medtronic), and regional analysis in this comprehensive market report. Learn about tricalcium phosphate, biphasic calcium phosphate, and calcium phosphate cement segments.

August 2025
Base Year: 2024
No Of Pages: 234
Price: $4750

Middle East and Africa CT Market Strategic Market Roadmap: Analysis and Forecasts 2025-2033

Discover the booming Middle East & Africa CT scan market. This in-depth analysis reveals key trends, drivers, and challenges impacting growth through 2033, including market size projections, CAGR, and segment performance. Learn more about key players and regional variations.

August 2025
Base Year: 2024
No Of Pages: 234
Price: $4750

Global Cannabis Testing Lab Market Trends: Region-Specific Insights 2025-2033

The global cannabis testing lab market is booming, projected to reach $3.05 billion by 2033 with a 13.12% CAGR. This report analyzes market size, growth drivers (regulation, consumer demand), restraints, and key players across North America, Europe, and Asia-Pacific. Discover segment trends in potency testing, terpene profiling, and more.

August 2025
Base Year: 2024
No Of Pages: 234
Price: $4750

Australia Drug Delivery Devices Market 2025-2033 Overview: Trends, Competitor Dynamics, and Opportunities

Discover the booming Australian drug delivery devices market! This in-depth analysis reveals a CAGR of 5.10% (2025-2033), driven by chronic disease prevalence and technological advancements. Explore market segmentation, key players (Becton Dickinson, Bayer, Novartis, etc.), and future growth projections.

August 2025
Base Year: 2024
No Of Pages: 197
Price: $3800

Holter Monitor Market Future Pathways: Strategic Insights to 2033

The Holter Monitor Market is booming, projected to reach [estimated 2033 market size] by 2033, driven by technological advancements, rising cardiovascular disease prevalence, and increasing demand for remote patient monitoring. This comprehensive analysis explores market size, CAGR, key players (Medtronic, GE Healthcare, Philips), and regional trends. Learn more!

August 2025
Base Year: 2024
No Of Pages: 234
Price: $4750

Growth Roadmap for Ophthalmic Ultrasound Systems Market Market 2025-2033

The Ophthalmic Ultrasound Systems Market is booming, projected to reach [estimated 2033 market size] by 2033, driven by rising age-related eye diseases and technological advancements. Discover key trends, leading companies, and regional insights in this comprehensive market analysis.

August 2025
Base Year: 2024
No Of Pages: 150
Price: $4750

Laser Therapy Industry: Growth Opportunities and Competitive Landscape Overview 2025-2033

The global laser therapy market is booming, projected to reach \$528.4 million by 2033 with a CAGR of 10.31%. Discover key trends, applications (wound care, pain management, cosmetics), leading companies, and regional insights in this comprehensive market analysis.

August 2025
Base Year: 2024
No Of Pages: 234
Price: $4750

Business Address

Head Office

Ansec House 3 rd floor Tank Road, Yerwada, Pune, Maharashtra 411014

Contact Information

Craig Francis

Business Development Head

+17162654855

[email protected]

Secure Payment Partners

payment image
RetailLogisticsPackagingAutomotiveHealthcareAgricultureEnergy & PowerFood & BeverageAerospace & DefenseChemicals & MaterialsHospitality and TourismAnimal Nutrition & WellnessConsumer Goods and ServicesReal Estate and ConstructionHome and Property ImprovementTechnology, Media and TelecomManufacturing Products and ServicesFinancial Services and Investment Intelligence

© 2025 PRDUA Research & Media Private Limited, All rights reserved

Privacy Policy
Terms and Conditions
FAQ
  • Home
  • About Us
  • Industries
    • Aerospace & Defense
    • Agriculture
    • Animal Nutrition & Wellness
    • Automotive
    • Chemicals & Materials
    • Consumer Goods and Services
    • Energy & Power
    • Financial Services and Investment Intelligence
    • Food & Beverage
    • Home and Property Improvement
    • Hospitality and Tourism
    • Logistics
    • Manufacturing Products and Services
    • Packaging
    • Professional and Commercial Services
    • Real Estate and Construction
    • Retail
    • Technology, Media and Telecom
    • Healthcare
  • Services
  • Contact
Main Logo
  • Home
  • About Us
  • Industries
    • Aerospace & Defense
    • Agriculture
    • Animal Nutrition & Wellness
    • Automotive
    • Chemicals & Materials
    • Consumer Goods and Services
    • Energy & Power
    • Financial Services and Investment Intelligence
    • Food & Beverage
    • Home and Property Improvement
    • Hospitality and Tourism
    • Logistics
    • Manufacturing Products and Services
    • Packaging
    • Professional and Commercial Services
    • Real Estate and Construction
    • Retail
    • Technology, Media and Telecom
    • Healthcare
  • Services
  • Contact
+17162654855
[email protected]

+17162654855

[email protected]