

Key Insights
The photo printing market, valued at $23.99 billion in 2025, is projected to experience robust growth, driven by several key factors. The increasing popularity of personalized photo gifts, fueled by social media sharing and a desire for tangible keepsakes in the digital age, significantly contributes to market expansion. Technological advancements, such as improved print quality, wider format options, and innovative printing techniques (like metallic or canvas prints), are also boosting demand. Furthermore, the growing e-commerce sector and the rise of online photo printing services offering user-friendly platforms and convenient delivery options are accelerating market penetration. Competitive pricing strategies and loyalty programs from major players like Shutterfly, Snapfish, and Vistaprint further enhance accessibility and consumer engagement. However, the market faces challenges including the increasing reliance on digital photo storage and the competition from free or low-cost digital sharing platforms. Despite these restraints, the market's overall trajectory remains positive, fueled by the enduring human desire to preserve and share cherished memories in a physical format.
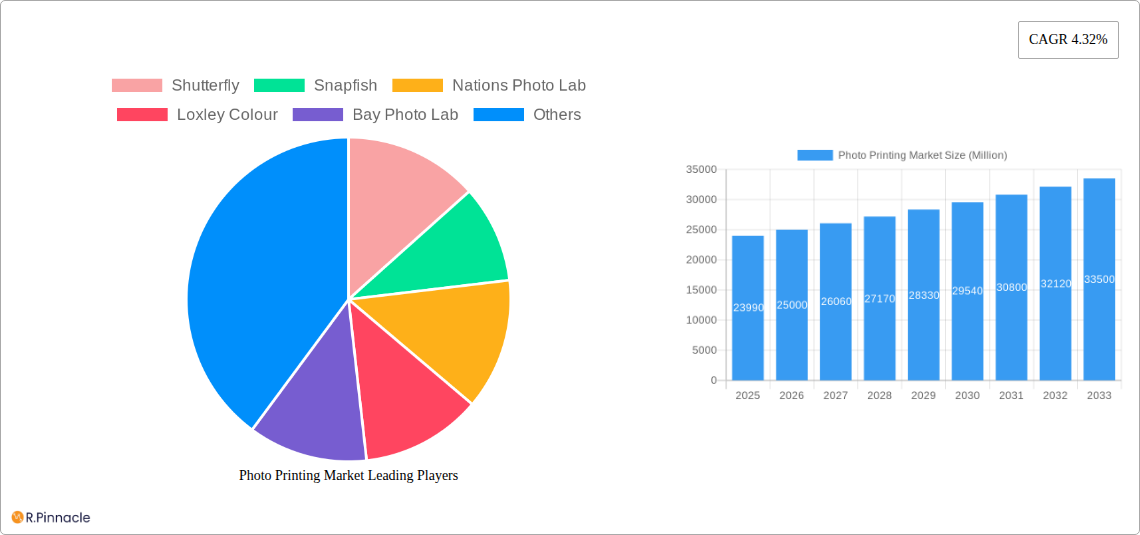
Photo Printing Market Market Size (In Billion)
The forecast period from 2025 to 2033 anticipates a continued expansion of the photo printing market, driven by sustained consumer demand for personalized products and ongoing technological improvements. The projected Compound Annual Growth Rate (CAGR) of 4.32% suggests steady, albeit moderate, growth. The market segmentation, while not explicitly detailed, likely comprises various print types (photo books, prints, canvases, etc.), formats (size, finish), and customer segments (individuals, businesses, professionals). Regional variations in market size and growth rate will likely depend on factors such as disposable income, internet penetration, and cultural preferences. The competitive landscape is marked by both established players and emerging niche providers, each striving to differentiate through specialized services, unique offerings, or superior customer experience. This competitive dynamic ensures a dynamic and continuously evolving market.
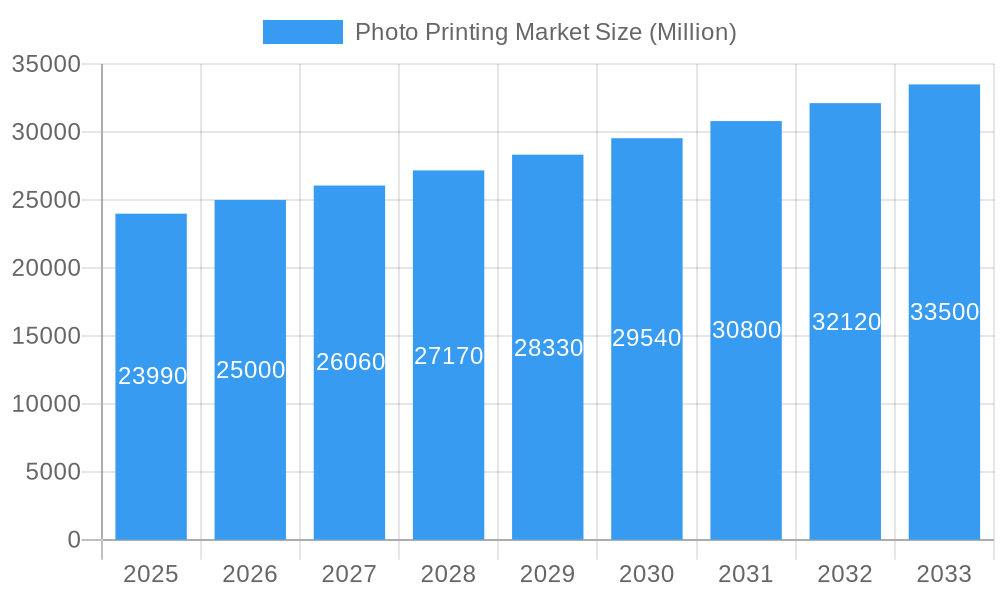
Photo Printing Market Company Market Share
Photo Printing Market: A Comprehensive Report (2019-2033)
This in-depth report provides a comprehensive analysis of the Photo Printing Market, offering actionable insights for industry professionals and investors. The study period covers 2019-2033, with 2025 as the base and estimated year. We project a market valued at xx Million in 2025, with a Compound Annual Growth Rate (CAGR) of xx% during the forecast period (2025-2033). Key players analyzed include Shutterfly, Snapfish, Nations Photo Lab, Loxley Colour, Bay Photo Lab, WhiteWall, Mpix, Vistaprint, AdoramaPix, and Zazzle (list not exhaustive).
Photo Printing Market Market Structure & Innovation Trends
This section analyzes the market's competitive landscape, examining market concentration, innovation drivers, regulatory frameworks, product substitutes, end-user demographics, and M&A activities. The market exhibits a moderately concentrated structure, with the top five players holding an estimated xx% market share in 2025. Innovation is driven by advancements in digital printing technologies, personalized photo products, and online platforms. Regulatory frameworks related to data privacy and environmental sustainability are influencing industry practices. Key substitutes include digital displays and cloud-based photo storage. End-user demographics are diverse, spanning personal consumers, businesses, and professional photographers. M&A activity in the historical period (2019-2024) saw approximately xx deals, with a total value of approximately xx Million. This activity reflects ongoing consolidation and expansion within the market. Key trends include an increasing focus on personalization, premium photo products, and sustainable printing practices.
- Market Concentration: Moderately concentrated, with top 5 players holding approximately xx% market share.
- Innovation Drivers: Advancements in digital printing, personalization, and online platforms.
- M&A Activity (2019-2024): Approximately xx deals totaling xx Million.
Photo Printing Market Market Dynamics & Trends
This section explores the key factors driving market growth, technological advancements, consumer preferences, and competitive dynamics within the photo printing industry. The market is witnessing significant growth fueled by increasing smartphone penetration, rising disposable incomes in developing economies, and the growing demand for personalized photo products. Technological disruptions such as the advent of AI-powered photo editing tools and advancements in printing technologies are shaping market trends. Consumer preferences are shifting towards high-quality prints, personalized photo gifts, and convenient online ordering platforms. Competitive dynamics are characterized by intense competition among established players and the emergence of new entrants offering innovative products and services. The market penetration of online photo printing services is increasing steadily, reaching xx% in 2025.
Dominant Regions & Segments in Photo Printing Market
This section identifies the leading regions and segments within the photo printing market. North America is currently the dominant region, driven by high consumer spending and the presence of major players. The consumer segment holds the largest market share.
- North America Dominance Drivers:
- High consumer spending on personalized products.
- Strong presence of major photo printing companies.
- Well-developed e-commerce infrastructure.
- Other Regions: Europe, Asia-Pacific, and Rest of World are also experiencing growth, though at varying rates. Factors influencing regional growth include economic development, disposable income levels, technological adoption, and cultural preferences.
Photo Printing Market Product Innovations
Recent product innovations include the introduction of new photo book formats, personalized photo gifts, and improved printing technologies like wider color gamuts and enhanced print durability. These innovations cater to the growing demand for high-quality, personalized products and offer competitive advantages to providers. The market is also seeing an increasing focus on sustainable printing practices, including the use of eco-friendly materials and processes.
Report Scope & Segmentation Analysis
The report segments the photo printing market by product type (photo prints, photo books, canvas prints, etc.), by print technology (inkjet, dye-sublimation, etc.), by end-user (consumer, professional, business), and by region. Each segment's growth projections, market sizes, and competitive dynamics are detailed within the full report.
Key Drivers of Photo Printing Market Growth
The key drivers of market growth include the increasing adoption of smartphones and digital cameras, rising disposable incomes, a growing preference for personalized gifts, and ongoing technological advancements in printing technologies. The expanding e-commerce sector and the increasing popularity of social media platforms also play a significant role in fueling market growth.
Challenges in the Photo Printing Market Sector
Challenges include intense competition, price pressures from low-cost providers, evolving consumer preferences, and maintaining profitability in the face of changing printing technologies. Supply chain disruptions and regulatory changes related to environmental sustainability also pose challenges to market players.
Emerging Opportunities in Photo Printing Market
Emerging opportunities include the growing demand for personalized photo products, the expansion into new geographical markets, and the adoption of new printing technologies such as 3D printing and augmented reality (AR). Further market expansion is expected through the integration of AI-powered photo editing tools and improved online ordering experiences.
Leading Players in the Photo Printing Market Market
- Shutterfly
- Snapfish
- Nations Photo Lab
- Loxley Colour
- Bay Photo Lab
- WhiteWall
- Mpix
- Vistaprint
- AdoramaPix
- Zazzle
Key Developments in Photo Printing Market Industry
- September 2023: Esko and Fiery, LLC formed a technological partnership to improve packaging procedures and digital print technologies.
- May 2024: HP Inc. partnered with Canva to integrate printing capabilities into Canva's design platform, potentially expanding the market significantly.
Future Outlook for Photo Printing Market Market
The future of the photo printing market looks promising, driven by continued technological advancements, the growing demand for personalized products, and the expansion into new markets. Strategic partnerships and investments in innovative technologies will be crucial for players seeking to maintain a competitive edge. The market is poised for continued growth, particularly in emerging economies and specialized niche markets.
Photo Printing Market Segmentation
-
1. Product Type
- 1.1. Prints
- 1.2. Wall Art
- 1.3. Cards
- 1.4. Photo Gifts
- 1.5. Photo Books
- 1.6. Calendars
- 1.7. Other Product Types
-
2. Type
- 2.1. Film and Offset Printing
- 2.2. Digital Printing
-
3. Distribution Channel
- 3.1. Retail
- 3.2. Online
- 3.3. Instant Kiosk
Photo Printing Market Segmentation By Geography
-
1. North America
- 1.1. United States
- 1.2. Canada
- 1.3. Rest of North America
-
2. Europe
- 2.1. Germany
- 2.2. United Kingdom
- 2.3. France
- 2.4. Russia
- 2.5. Spain
- 2.6. Rest of Europe
-
3. Asia Pacific
- 3.1. India
- 3.2. China
- 3.3. Japan
- 3.4. Rest of Asia Pacific
-
4. South America
- 4.1. Brazil
- 4.2. Argentina
- 4.3. Rest of South America
-
5. Middle East and Africa
- 5.1. United Arab Emirates
- 5.2. Saudi Arabia
- 5.3. Rest of Middle East and Africa
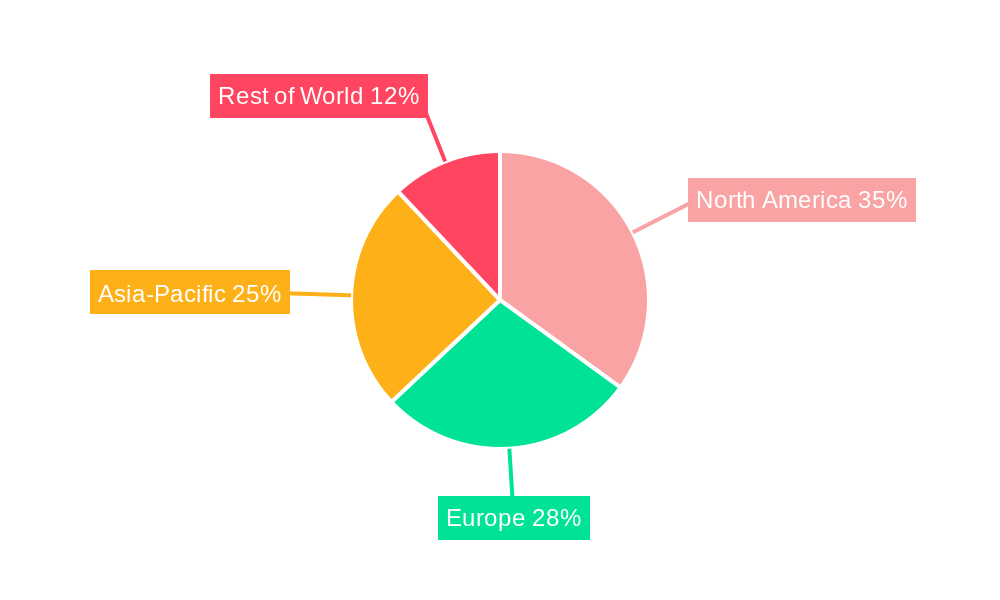
Photo Printing Market Regional Market Share
Geographic Coverage of Photo Printing Market
Photo Printing Market REPORT HIGHLIGHTS
| Aspects | Details |
|---|---|
| Study Period | 2020-2034 |
| Base Year | 2025 |
| Estimated Year | 2026 |
| Forecast Period | 2026-2034 |
| Historical Period | 2020-2025 |
| Growth Rate | CAGR of 4.32% from 2020-2034 |
| Segmentation |
|
Table of Contents
- 1. Introduction
- 1.1. Research Scope
- 1.2. Market Segmentation
- 1.3. Research Objective
- 1.4. Definitions and Assumptions
- 2. Executive Summary
- 2.1. Market Snapshot
- 3. Market Dynamics
- 3.1. Market Drivers
- 3.2. Market Restrains
- 3.3. Market Trends
- 3.4. Market Opportunities
- 4. Market Factor Analysis
- 4.1. Porters Five Forces
- 4.1.1. Bargaining Power of Suppliers
- 4.1.2. Bargaining Power of Buyers
- 4.1.3. Threat of New Entrants
- 4.1.4. Threat of Substitutes
- 4.1.5. Competitive Rivalry
- 4.2. PESTEL analysis
- 4.3. BCG Analysis
- 4.3.1. Stars (High Growth, High Market Share)
- 4.3.2. Cash Cows (Low Growth, High Market Share)
- 4.3.3. Question Mark (High Growth, Low Market Share)
- 4.3.4. Dogs (Low Growth, Low Market Share)
- 4.4. Ansoff Matrix Analysis
- 4.5. Supply Chain Analysis
- 4.6. Regulatory Landscape
- 4.7. Current Market Potential and Opportunity Assessment (TAM–SAM–SOM Framework)
- 4.8. PRI Analyst Note
- 4.1. Porters Five Forces
- 5. Market Analysis, Insights and Forecast 2021-2033
- 5.1. Market Analysis, Insights and Forecast - by Product Type
- 5.1.1. Prints
- 5.1.2. Wall Art
- 5.1.3. Cards
- 5.1.4. Photo Gifts
- 5.1.5. Photo Books
- 5.1.6. Calendars
- 5.1.7. Other Product Types
- 5.2. Market Analysis, Insights and Forecast - by Type
- 5.2.1. Film and Offset Printing
- 5.2.2. Digital Printing
- 5.3. Market Analysis, Insights and Forecast - by Distribution Channel
- 5.3.1. Retail
- 5.3.2. Online
- 5.3.3. Instant Kiosk
- 5.4. Market Analysis, Insights and Forecast - by Region
- 5.4.1. North America
- 5.4.2. Europe
- 5.4.3. Asia Pacific
- 5.4.4. South America
- 5.4.5. Middle East and Africa
- 5.1. Market Analysis, Insights and Forecast - by Product Type
- 6. Global Photo Printing Market Analysis, Insights and Forecast, 2021-2033
- 6.1. Market Analysis, Insights and Forecast - by Product Type
- 6.1.1. Prints
- 6.1.2. Wall Art
- 6.1.3. Cards
- 6.1.4. Photo Gifts
- 6.1.5. Photo Books
- 6.1.6. Calendars
- 6.1.7. Other Product Types
- 6.2. Market Analysis, Insights and Forecast - by Type
- 6.2.1. Film and Offset Printing
- 6.2.2. Digital Printing
- 6.3. Market Analysis, Insights and Forecast - by Distribution Channel
- 6.3.1. Retail
- 6.3.2. Online
- 6.3.3. Instant Kiosk
- 6.1. Market Analysis, Insights and Forecast - by Product Type
- 7. North America Photo Printing Market Analysis, Insights and Forecast, 2020-2032
- 7.1. Market Analysis, Insights and Forecast - by Product Type
- 7.1.1. Prints
- 7.1.2. Wall Art
- 7.1.3. Cards
- 7.1.4. Photo Gifts
- 7.1.5. Photo Books
- 7.1.6. Calendars
- 7.1.7. Other Product Types
- 7.2. Market Analysis, Insights and Forecast - by Type
- 7.2.1. Film and Offset Printing
- 7.2.2. Digital Printing
- 7.3. Market Analysis, Insights and Forecast - by Distribution Channel
- 7.3.1. Retail
- 7.3.2. Online
- 7.3.3. Instant Kiosk
- 7.1. Market Analysis, Insights and Forecast - by Product Type
- 8. Europe Photo Printing Market Analysis, Insights and Forecast, 2020-2032
- 8.1. Market Analysis, Insights and Forecast - by Product Type
- 8.1.1. Prints
- 8.1.2. Wall Art
- 8.1.3. Cards
- 8.1.4. Photo Gifts
- 8.1.5. Photo Books
- 8.1.6. Calendars
- 8.1.7. Other Product Types
- 8.2. Market Analysis, Insights and Forecast - by Type
- 8.2.1. Film and Offset Printing
- 8.2.2. Digital Printing
- 8.3. Market Analysis, Insights and Forecast - by Distribution Channel
- 8.3.1. Retail
- 8.3.2. Online
- 8.3.3. Instant Kiosk
- 8.1. Market Analysis, Insights and Forecast - by Product Type
- 9. Asia Pacific Photo Printing Market Analysis, Insights and Forecast, 2020-2032
- 9.1. Market Analysis, Insights and Forecast - by Product Type
- 9.1.1. Prints
- 9.1.2. Wall Art
- 9.1.3. Cards
- 9.1.4. Photo Gifts
- 9.1.5. Photo Books
- 9.1.6. Calendars
- 9.1.7. Other Product Types
- 9.2. Market Analysis, Insights and Forecast - by Type
- 9.2.1. Film and Offset Printing
- 9.2.2. Digital Printing
- 9.3. Market Analysis, Insights and Forecast - by Distribution Channel
- 9.3.1. Retail
- 9.3.2. Online
- 9.3.3. Instant Kiosk
- 9.1. Market Analysis, Insights and Forecast - by Product Type
- 10. South America Photo Printing Market Analysis, Insights and Forecast, 2020-2032
- 10.1. Market Analysis, Insights and Forecast - by Product Type
- 10.1.1. Prints
- 10.1.2. Wall Art
- 10.1.3. Cards
- 10.1.4. Photo Gifts
- 10.1.5. Photo Books
- 10.1.6. Calendars
- 10.1.7. Other Product Types
- 10.2. Market Analysis, Insights and Forecast - by Type
- 10.2.1. Film and Offset Printing
- 10.2.2. Digital Printing
- 10.3. Market Analysis, Insights and Forecast - by Distribution Channel
- 10.3.1. Retail
- 10.3.2. Online
- 10.3.3. Instant Kiosk
- 10.1. Market Analysis, Insights and Forecast - by Product Type
- 11. Middle East and Africa Photo Printing Market Analysis, Insights and Forecast, 2020-2032
- 11.1. Market Analysis, Insights and Forecast - by Product Type
- 11.1.1. Prints
- 11.1.2. Wall Art
- 11.1.3. Cards
- 11.1.4. Photo Gifts
- 11.1.5. Photo Books
- 11.1.6. Calendars
- 11.1.7. Other Product Types
- 11.2. Market Analysis, Insights and Forecast - by Type
- 11.2.1. Film and Offset Printing
- 11.2.2. Digital Printing
- 11.3. Market Analysis, Insights and Forecast - by Distribution Channel
- 11.3.1. Retail
- 11.3.2. Online
- 11.3.3. Instant Kiosk
- 11.1. Market Analysis, Insights and Forecast - by Product Type
- 12. Competitive Analysis
- 12.1. Company Profiles
- 12.1.1 Shutterfly
- 12.1.1.1. Company Overview
- 12.1.1.2. Products
- 12.1.1.3. Company Financials
- 12.1.1.4. SWOT Analysis
- 12.1.2 Snapfish
- 12.1.2.1. Company Overview
- 12.1.2.2. Products
- 12.1.2.3. Company Financials
- 12.1.2.4. SWOT Analysis
- 12.1.3 Nations Photo Lab
- 12.1.3.1. Company Overview
- 12.1.3.2. Products
- 12.1.3.3. Company Financials
- 12.1.3.4. SWOT Analysis
- 12.1.4 Loxley Colour
- 12.1.4.1. Company Overview
- 12.1.4.2. Products
- 12.1.4.3. Company Financials
- 12.1.4.4. SWOT Analysis
- 12.1.5 Bay Photo Lab
- 12.1.5.1. Company Overview
- 12.1.5.2. Products
- 12.1.5.3. Company Financials
- 12.1.5.4. SWOT Analysis
- 12.1.6 WhiteWall
- 12.1.6.1. Company Overview
- 12.1.6.2. Products
- 12.1.6.3. Company Financials
- 12.1.6.4. SWOT Analysis
- 12.1.7 Mpix
- 12.1.7.1. Company Overview
- 12.1.7.2. Products
- 12.1.7.3. Company Financials
- 12.1.7.4. SWOT Analysis
- 12.1.8 Vistaprint
- 12.1.8.1. Company Overview
- 12.1.8.2. Products
- 12.1.8.3. Company Financials
- 12.1.8.4. SWOT Analysis
- 12.1.9 AdoramaPix
- 12.1.9.1. Company Overview
- 12.1.9.2. Products
- 12.1.9.3. Company Financials
- 12.1.9.4. SWOT Analysis
- 12.1.10 Zazzle**List Not Exhaustive
- 12.1.10.1. Company Overview
- 12.1.10.2. Products
- 12.1.10.3. Company Financials
- 12.1.10.4. SWOT Analysis
- 12.1.1 Shutterfly
- 12.2. Market Entropy
- 12.2.1 Company's Key Areas Served
- 12.2.2 Recent Developments
- 12.3. Company Market Share Analysis 2025
- 12.3.1 Top 5 Companies Market Share Analysis
- 12.3.2 Top 3 Companies Market Share Analysis
- 12.4. List of Potential Customers
- 13. Research Methodology
List of Figures
- Figure 1: Global Photo Printing Market Revenue Breakdown (Million, %) by Region 2025 & 2033
- Figure 2: Global Photo Printing Market Volume Breakdown (Billion, %) by Region 2025 & 2033
- Figure 3: North America Photo Printing Market Revenue (Million), by Product Type 2025 & 2033
- Figure 4: North America Photo Printing Market Volume (Billion), by Product Type 2025 & 2033
- Figure 5: North America Photo Printing Market Revenue Share (%), by Product Type 2025 & 2033
- Figure 6: North America Photo Printing Market Volume Share (%), by Product Type 2025 & 2033
- Figure 7: North America Photo Printing Market Revenue (Million), by Type 2025 & 2033
- Figure 8: North America Photo Printing Market Volume (Billion), by Type 2025 & 2033
- Figure 9: North America Photo Printing Market Revenue Share (%), by Type 2025 & 2033
- Figure 10: North America Photo Printing Market Volume Share (%), by Type 2025 & 2033
- Figure 11: North America Photo Printing Market Revenue (Million), by Distribution Channel 2025 & 2033
- Figure 12: North America Photo Printing Market Volume (Billion), by Distribution Channel 2025 & 2033
- Figure 13: North America Photo Printing Market Revenue Share (%), by Distribution Channel 2025 & 2033
- Figure 14: North America Photo Printing Market Volume Share (%), by Distribution Channel 2025 & 2033
- Figure 15: North America Photo Printing Market Revenue (Million), by Country 2025 & 2033
- Figure 16: North America Photo Printing Market Volume (Billion), by Country 2025 & 2033
- Figure 17: North America Photo Printing Market Revenue Share (%), by Country 2025 & 2033
- Figure 18: North America Photo Printing Market Volume Share (%), by Country 2025 & 2033
- Figure 19: Europe Photo Printing Market Revenue (Million), by Product Type 2025 & 2033
- Figure 20: Europe Photo Printing Market Volume (Billion), by Product Type 2025 & 2033
- Figure 21: Europe Photo Printing Market Revenue Share (%), by Product Type 2025 & 2033
- Figure 22: Europe Photo Printing Market Volume Share (%), by Product Type 2025 & 2033
- Figure 23: Europe Photo Printing Market Revenue (Million), by Type 2025 & 2033
- Figure 24: Europe Photo Printing Market Volume (Billion), by Type 2025 & 2033
- Figure 25: Europe Photo Printing Market Revenue Share (%), by Type 2025 & 2033
- Figure 26: Europe Photo Printing Market Volume Share (%), by Type 2025 & 2033
- Figure 27: Europe Photo Printing Market Revenue (Million), by Distribution Channel 2025 & 2033
- Figure 28: Europe Photo Printing Market Volume (Billion), by Distribution Channel 2025 & 2033
- Figure 29: Europe Photo Printing Market Revenue Share (%), by Distribution Channel 2025 & 2033
- Figure 30: Europe Photo Printing Market Volume Share (%), by Distribution Channel 2025 & 2033
- Figure 31: Europe Photo Printing Market Revenue (Million), by Country 2025 & 2033
- Figure 32: Europe Photo Printing Market Volume (Billion), by Country 2025 & 2033
- Figure 33: Europe Photo Printing Market Revenue Share (%), by Country 2025 & 2033
- Figure 34: Europe Photo Printing Market Volume Share (%), by Country 2025 & 2033
- Figure 35: Asia Pacific Photo Printing Market Revenue (Million), by Product Type 2025 & 2033
- Figure 36: Asia Pacific Photo Printing Market Volume (Billion), by Product Type 2025 & 2033
- Figure 37: Asia Pacific Photo Printing Market Revenue Share (%), by Product Type 2025 & 2033
- Figure 38: Asia Pacific Photo Printing Market Volume Share (%), by Product Type 2025 & 2033
- Figure 39: Asia Pacific Photo Printing Market Revenue (Million), by Type 2025 & 2033
- Figure 40: Asia Pacific Photo Printing Market Volume (Billion), by Type 2025 & 2033
- Figure 41: Asia Pacific Photo Printing Market Revenue Share (%), by Type 2025 & 2033
- Figure 42: Asia Pacific Photo Printing Market Volume Share (%), by Type 2025 & 2033
- Figure 43: Asia Pacific Photo Printing Market Revenue (Million), by Distribution Channel 2025 & 2033
- Figure 44: Asia Pacific Photo Printing Market Volume (Billion), by Distribution Channel 2025 & 2033
- Figure 45: Asia Pacific Photo Printing Market Revenue Share (%), by Distribution Channel 2025 & 2033
- Figure 46: Asia Pacific Photo Printing Market Volume Share (%), by Distribution Channel 2025 & 2033
- Figure 47: Asia Pacific Photo Printing Market Revenue (Million), by Country 2025 & 2033
- Figure 48: Asia Pacific Photo Printing Market Volume (Billion), by Country 2025 & 2033
- Figure 49: Asia Pacific Photo Printing Market Revenue Share (%), by Country 2025 & 2033
- Figure 50: Asia Pacific Photo Printing Market Volume Share (%), by Country 2025 & 2033
- Figure 51: South America Photo Printing Market Revenue (Million), by Product Type 2025 & 2033
- Figure 52: South America Photo Printing Market Volume (Billion), by Product Type 2025 & 2033
- Figure 53: South America Photo Printing Market Revenue Share (%), by Product Type 2025 & 2033
- Figure 54: South America Photo Printing Market Volume Share (%), by Product Type 2025 & 2033
- Figure 55: South America Photo Printing Market Revenue (Million), by Type 2025 & 2033
- Figure 56: South America Photo Printing Market Volume (Billion), by Type 2025 & 2033
- Figure 57: South America Photo Printing Market Revenue Share (%), by Type 2025 & 2033
- Figure 58: South America Photo Printing Market Volume Share (%), by Type 2025 & 2033
- Figure 59: South America Photo Printing Market Revenue (Million), by Distribution Channel 2025 & 2033
- Figure 60: South America Photo Printing Market Volume (Billion), by Distribution Channel 2025 & 2033
- Figure 61: South America Photo Printing Market Revenue Share (%), by Distribution Channel 2025 & 2033
- Figure 62: South America Photo Printing Market Volume Share (%), by Distribution Channel 2025 & 2033
- Figure 63: South America Photo Printing Market Revenue (Million), by Country 2025 & 2033
- Figure 64: South America Photo Printing Market Volume (Billion), by Country 2025 & 2033
- Figure 65: South America Photo Printing Market Revenue Share (%), by Country 2025 & 2033
- Figure 66: South America Photo Printing Market Volume Share (%), by Country 2025 & 2033
- Figure 67: Middle East and Africa Photo Printing Market Revenue (Million), by Product Type 2025 & 2033
- Figure 68: Middle East and Africa Photo Printing Market Volume (Billion), by Product Type 2025 & 2033
- Figure 69: Middle East and Africa Photo Printing Market Revenue Share (%), by Product Type 2025 & 2033
- Figure 70: Middle East and Africa Photo Printing Market Volume Share (%), by Product Type 2025 & 2033
- Figure 71: Middle East and Africa Photo Printing Market Revenue (Million), by Type 2025 & 2033
- Figure 72: Middle East and Africa Photo Printing Market Volume (Billion), by Type 2025 & 2033
- Figure 73: Middle East and Africa Photo Printing Market Revenue Share (%), by Type 2025 & 2033
- Figure 74: Middle East and Africa Photo Printing Market Volume Share (%), by Type 2025 & 2033
- Figure 75: Middle East and Africa Photo Printing Market Revenue (Million), by Distribution Channel 2025 & 2033
- Figure 76: Middle East and Africa Photo Printing Market Volume (Billion), by Distribution Channel 2025 & 2033
- Figure 77: Middle East and Africa Photo Printing Market Revenue Share (%), by Distribution Channel 2025 & 2033
- Figure 78: Middle East and Africa Photo Printing Market Volume Share (%), by Distribution Channel 2025 & 2033
- Figure 79: Middle East and Africa Photo Printing Market Revenue (Million), by Country 2025 & 2033
- Figure 80: Middle East and Africa Photo Printing Market Volume (Billion), by Country 2025 & 2033
- Figure 81: Middle East and Africa Photo Printing Market Revenue Share (%), by Country 2025 & 2033
- Figure 82: Middle East and Africa Photo Printing Market Volume Share (%), by Country 2025 & 2033
List of Tables
- Table 1: Global Photo Printing Market Revenue Million Forecast, by Product Type 2020 & 2033
- Table 2: Global Photo Printing Market Volume Billion Forecast, by Product Type 2020 & 2033
- Table 3: Global Photo Printing Market Revenue Million Forecast, by Type 2020 & 2033
- Table 4: Global Photo Printing Market Volume Billion Forecast, by Type 2020 & 2033
- Table 5: Global Photo Printing Market Revenue Million Forecast, by Distribution Channel 2020 & 2033
- Table 6: Global Photo Printing Market Volume Billion Forecast, by Distribution Channel 2020 & 2033
- Table 7: Global Photo Printing Market Revenue Million Forecast, by Region 2020 & 2033
- Table 8: Global Photo Printing Market Volume Billion Forecast, by Region 2020 & 2033
- Table 9: Global Photo Printing Market Revenue Million Forecast, by Product Type 2020 & 2033
- Table 10: Global Photo Printing Market Volume Billion Forecast, by Product Type 2020 & 2033
- Table 11: Global Photo Printing Market Revenue Million Forecast, by Type 2020 & 2033
- Table 12: Global Photo Printing Market Volume Billion Forecast, by Type 2020 & 2033
- Table 13: Global Photo Printing Market Revenue Million Forecast, by Distribution Channel 2020 & 2033
- Table 14: Global Photo Printing Market Volume Billion Forecast, by Distribution Channel 2020 & 2033
- Table 15: Global Photo Printing Market Revenue Million Forecast, by Country 2020 & 2033
- Table 16: Global Photo Printing Market Volume Billion Forecast, by Country 2020 & 2033
- Table 17: United States Photo Printing Market Revenue (Million) Forecast, by Application 2020 & 2033
- Table 18: United States Photo Printing Market Volume (Billion) Forecast, by Application 2020 & 2033
- Table 19: Canada Photo Printing Market Revenue (Million) Forecast, by Application 2020 & 2033
- Table 20: Canada Photo Printing Market Volume (Billion) Forecast, by Application 2020 & 2033
- Table 21: Rest of North America Photo Printing Market Revenue (Million) Forecast, by Application 2020 & 2033
- Table 22: Rest of North America Photo Printing Market Volume (Billion) Forecast, by Application 2020 & 2033
- Table 23: Global Photo Printing Market Revenue Million Forecast, by Product Type 2020 & 2033
- Table 24: Global Photo Printing Market Volume Billion Forecast, by Product Type 2020 & 2033
- Table 25: Global Photo Printing Market Revenue Million Forecast, by Type 2020 & 2033
- Table 26: Global Photo Printing Market Volume Billion Forecast, by Type 2020 & 2033
- Table 27: Global Photo Printing Market Revenue Million Forecast, by Distribution Channel 2020 & 2033
- Table 28: Global Photo Printing Market Volume Billion Forecast, by Distribution Channel 2020 & 2033
- Table 29: Global Photo Printing Market Revenue Million Forecast, by Country 2020 & 2033
- Table 30: Global Photo Printing Market Volume Billion Forecast, by Country 2020 & 2033
- Table 31: Germany Photo Printing Market Revenue (Million) Forecast, by Application 2020 & 2033
- Table 32: Germany Photo Printing Market Volume (Billion) Forecast, by Application 2020 & 2033
- Table 33: United Kingdom Photo Printing Market Revenue (Million) Forecast, by Application 2020 & 2033
- Table 34: United Kingdom Photo Printing Market Volume (Billion) Forecast, by Application 2020 & 2033
- Table 35: France Photo Printing Market Revenue (Million) Forecast, by Application 2020 & 2033
- Table 36: France Photo Printing Market Volume (Billion) Forecast, by Application 2020 & 2033
- Table 37: Russia Photo Printing Market Revenue (Million) Forecast, by Application 2020 & 2033
- Table 38: Russia Photo Printing Market Volume (Billion) Forecast, by Application 2020 & 2033
- Table 39: Spain Photo Printing Market Revenue (Million) Forecast, by Application 2020 & 2033
- Table 40: Spain Photo Printing Market Volume (Billion) Forecast, by Application 2020 & 2033
- Table 41: Rest of Europe Photo Printing Market Revenue (Million) Forecast, by Application 2020 & 2033
- Table 42: Rest of Europe Photo Printing Market Volume (Billion) Forecast, by Application 2020 & 2033
- Table 43: Global Photo Printing Market Revenue Million Forecast, by Product Type 2020 & 2033
- Table 44: Global Photo Printing Market Volume Billion Forecast, by Product Type 2020 & 2033
- Table 45: Global Photo Printing Market Revenue Million Forecast, by Type 2020 & 2033
- Table 46: Global Photo Printing Market Volume Billion Forecast, by Type 2020 & 2033
- Table 47: Global Photo Printing Market Revenue Million Forecast, by Distribution Channel 2020 & 2033
- Table 48: Global Photo Printing Market Volume Billion Forecast, by Distribution Channel 2020 & 2033
- Table 49: Global Photo Printing Market Revenue Million Forecast, by Country 2020 & 2033
- Table 50: Global Photo Printing Market Volume Billion Forecast, by Country 2020 & 2033
- Table 51: India Photo Printing Market Revenue (Million) Forecast, by Application 2020 & 2033
- Table 52: India Photo Printing Market Volume (Billion) Forecast, by Application 2020 & 2033
- Table 53: China Photo Printing Market Revenue (Million) Forecast, by Application 2020 & 2033
- Table 54: China Photo Printing Market Volume (Billion) Forecast, by Application 2020 & 2033
- Table 55: Japan Photo Printing Market Revenue (Million) Forecast, by Application 2020 & 2033
- Table 56: Japan Photo Printing Market Volume (Billion) Forecast, by Application 2020 & 2033
- Table 57: Rest of Asia Pacific Photo Printing Market Revenue (Million) Forecast, by Application 2020 & 2033
- Table 58: Rest of Asia Pacific Photo Printing Market Volume (Billion) Forecast, by Application 2020 & 2033
- Table 59: Global Photo Printing Market Revenue Million Forecast, by Product Type 2020 & 2033
- Table 60: Global Photo Printing Market Volume Billion Forecast, by Product Type 2020 & 2033
- Table 61: Global Photo Printing Market Revenue Million Forecast, by Type 2020 & 2033
- Table 62: Global Photo Printing Market Volume Billion Forecast, by Type 2020 & 2033
- Table 63: Global Photo Printing Market Revenue Million Forecast, by Distribution Channel 2020 & 2033
- Table 64: Global Photo Printing Market Volume Billion Forecast, by Distribution Channel 2020 & 2033
- Table 65: Global Photo Printing Market Revenue Million Forecast, by Country 2020 & 2033
- Table 66: Global Photo Printing Market Volume Billion Forecast, by Country 2020 & 2033
- Table 67: Brazil Photo Printing Market Revenue (Million) Forecast, by Application 2020 & 2033
- Table 68: Brazil Photo Printing Market Volume (Billion) Forecast, by Application 2020 & 2033
- Table 69: Argentina Photo Printing Market Revenue (Million) Forecast, by Application 2020 & 2033
- Table 70: Argentina Photo Printing Market Volume (Billion) Forecast, by Application 2020 & 2033
- Table 71: Rest of South America Photo Printing Market Revenue (Million) Forecast, by Application 2020 & 2033
- Table 72: Rest of South America Photo Printing Market Volume (Billion) Forecast, by Application 2020 & 2033
- Table 73: Global Photo Printing Market Revenue Million Forecast, by Product Type 2020 & 2033
- Table 74: Global Photo Printing Market Volume Billion Forecast, by Product Type 2020 & 2033
- Table 75: Global Photo Printing Market Revenue Million Forecast, by Type 2020 & 2033
- Table 76: Global Photo Printing Market Volume Billion Forecast, by Type 2020 & 2033
- Table 77: Global Photo Printing Market Revenue Million Forecast, by Distribution Channel 2020 & 2033
- Table 78: Global Photo Printing Market Volume Billion Forecast, by Distribution Channel 2020 & 2033
- Table 79: Global Photo Printing Market Revenue Million Forecast, by Country 2020 & 2033
- Table 80: Global Photo Printing Market Volume Billion Forecast, by Country 2020 & 2033
- Table 81: United Arab Emirates Photo Printing Market Revenue (Million) Forecast, by Application 2020 & 2033
- Table 82: United Arab Emirates Photo Printing Market Volume (Billion) Forecast, by Application 2020 & 2033
- Table 83: Saudi Arabia Photo Printing Market Revenue (Million) Forecast, by Application 2020 & 2033
- Table 84: Saudi Arabia Photo Printing Market Volume (Billion) Forecast, by Application 2020 & 2033
- Table 85: Rest of Middle East and Africa Photo Printing Market Revenue (Million) Forecast, by Application 2020 & 2033
- Table 86: Rest of Middle East and Africa Photo Printing Market Volume (Billion) Forecast, by Application 2020 & 2033
Frequently Asked Questions
1. What is the projected Compound Annual Growth Rate (CAGR) of the Photo Printing Market?
The projected CAGR is approximately 4.32%.
2. Which companies are prominent players in the Photo Printing Market?
Key companies in the market include Shutterfly, Snapfish, Nations Photo Lab, Loxley Colour, Bay Photo Lab, WhiteWall, Mpix, Vistaprint, AdoramaPix, Zazzle**List Not Exhaustive.
3. What are the main segments of the Photo Printing Market?
The market segments include Product Type, Type, Distribution Channel.
4. Can you provide details about the market size?
The market size is estimated to be USD 23.99 Million as of 2022.
5. What are some drivers contributing to market growth?
Increasing Smartphone Adoption is Driving the Market.
6. What are the notable trends driving market growth?
Growth in E-commerce Sector is Fueling the Photo Printing Market.
7. Are there any restraints impacting market growth?
Increasing Smartphone Adoption is Driving the Market.
8. Can you provide examples of recent developments in the market?
May 2024: HP Inc. (NYSE: HPQ) unveiled a strategic, multi-year global partnership with Canva, positioning itself as the world's sole comprehensive visual communication platform. The collaboration aims to equip millions of Canva users globally with the ability to effortlessly craft online designs, generate visual content, and facilitate local printing.September 2023: A new technological partnership was formed between Esko and Fiery, LLC, which aims to provide cutting-edge solutions that improve packaging procedures and digital print technologies.
9. What pricing options are available for accessing the report?
Pricing options include single-user, multi-user, and enterprise licenses priced at USD 4750, USD 5250, and USD 8750 respectively.
10. Is the market size provided in terms of value or volume?
The market size is provided in terms of value, measured in Million and volume, measured in Billion.
11. Are there any specific market keywords associated with the report?
Yes, the market keyword associated with the report is "Photo Printing Market," which aids in identifying and referencing the specific market segment covered.
12. How do I determine which pricing option suits my needs best?
The pricing options vary based on user requirements and access needs. Individual users may opt for single-user licenses, while businesses requiring broader access may choose multi-user or enterprise licenses for cost-effective access to the report.
13. Are there any additional resources or data provided in the Photo Printing Market report?
While the report offers comprehensive insights, it's advisable to review the specific contents or supplementary materials provided to ascertain if additional resources or data are available.
14. How can I stay updated on further developments or reports in the Photo Printing Market?
To stay informed about further developments, trends, and reports in the Photo Printing Market, consider subscribing to industry newsletters, following relevant companies and organizations, or regularly checking reputable industry news sources and publications.
Methodology
Step 1 - Identification of Relevant Samples Size from Population Database


Step 2 - Approaches for Defining Global Market Size (Value, Volume* & Price*)

Note*: In applicable scenarios
Step 3 - Data Sources
Primary Research
- Web Analytics
- Survey Reports
- Research Institute
- Latest Research Reports
- Opinion Leaders
Secondary Research
- Annual Reports
- White Paper
- Latest Press Release
- Industry Association
- Paid Database
- Investor Presentations

Step 4 - Data Triangulation
Involves using different sources of information in order to increase the validity of a study
These sources are likely to be stakeholders in a program - participants, other researchers, program staff, other community members, and so on.
Then we put all data in single framework & apply various statistical tools to find out the dynamic on the market.
During the analysis stage, feedback from the stakeholder groups would be compared to determine areas of agreement as well as areas of divergence