
Key Insights
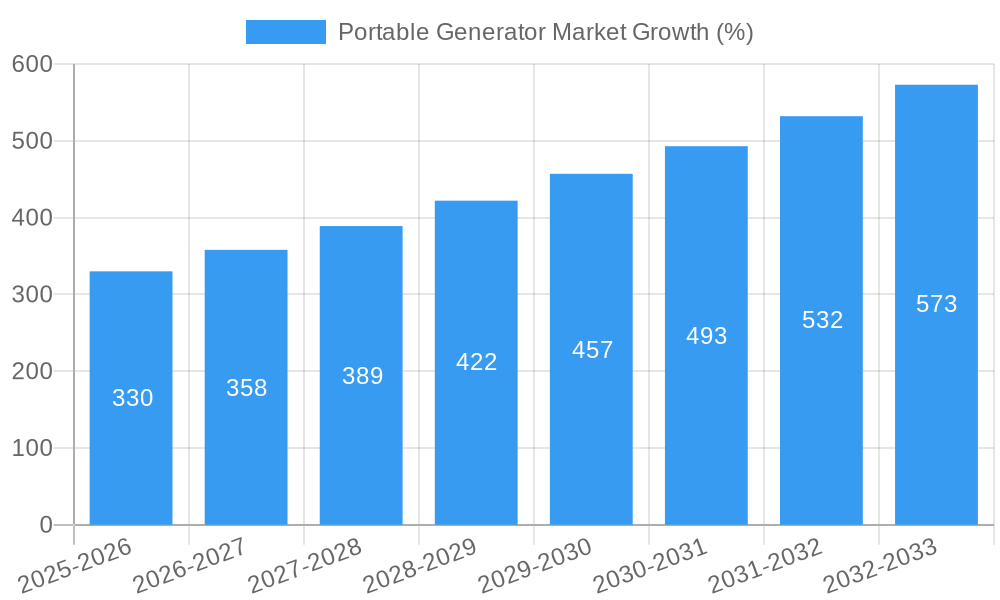
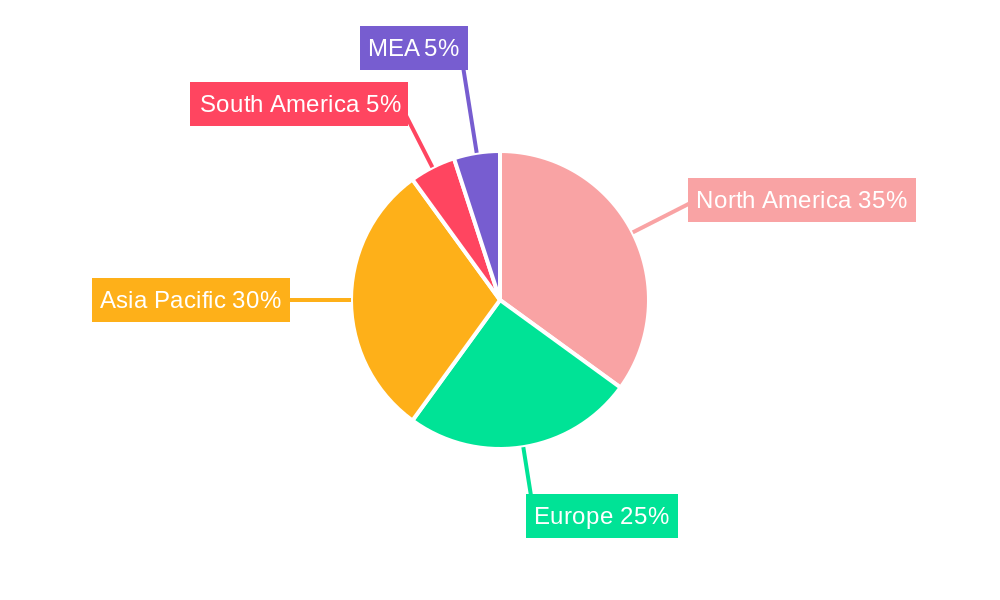
The portable generator market, valued at $5.53 billion in 2025, is projected to experience robust growth, exhibiting a compound annual growth rate (CAGR) of 5.86% from 2025 to 2033. This expansion is driven by several key factors. Increasing demand for backup power solutions in residential settings due to rising frequency and severity of power outages, coupled with growth in the commercial and industrial sectors needing reliable temporary power sources for construction, events, and remote operations, are major contributors. Furthermore, advancements in technology leading to lighter, quieter, and more fuel-efficient generators are boosting market appeal. The market is segmented by power rating (below 5 kW, 5-10 kW, above 10 kW), fuel type (gas, diesel, other), and end-user (industrial, commercial, residential). The gas-powered segment currently dominates due to affordability and ease of use, while the diesel segment is expected to see significant growth driven by its higher power output and extended runtime, particularly within industrial applications. Geographically, North America and Asia-Pacific are currently leading markets, but developing economies in regions like South America and the Middle East and Africa are poised for considerable growth fueled by infrastructure development and rising electrification. However, stringent emission regulations and fluctuating fuel prices present challenges to market expansion. The competitive landscape is characterized by established players such as Yamaha, Briggs & Stratton, and Generac, alongside other significant contributors, all vying for market share through innovation and strategic expansion.
The projected growth trajectory indicates continued market expansion through 2033. Factors such as increasing urbanization, the growth of renewable energy sources (which often require backup power solutions), and the increasing adoption of portable generators in disaster relief and emergency response scenarios will contribute to this growth. However, manufacturers must address challenges including supply chain disruptions, material cost increases, and the need for sustainable and environmentally friendly generator technologies to maintain momentum. This involves incorporating cleaner fuel options, focusing on energy efficiency, and developing advanced emission control systems to comply with evolving regulations. The ongoing emphasis on enhancing product features, such as improved noise reduction and remote monitoring capabilities, will also play a crucial role in shaping the future of the portable generator market.

Portable Generator Market Report: 2019-2033
This comprehensive report provides an in-depth analysis of the Portable Generator Market, offering valuable insights for industry professionals, investors, and stakeholders. Covering the period 2019-2033, with a focus on 2025, this report analyzes market dynamics, key players, and future growth potential. The market is segmented by power rating (Below 5 kW, 5-10 kW, Above 10 kW), fuel type (Gas, Diesel, Other Fuel Types), and end-user (Industrial, Commercial, Residential). The report projects a xx Million market size by 2033, with a CAGR of xx%.
Portable Generator Market Structure & Innovation Trends
The portable generator market exhibits a moderately concentrated structure, with key players like Generac Holdings Inc, Honda Siel Power Products Ltd, Yamaha Motor Co Ltd, Briggs & Stratton Corporation, Atlas Copco AB, Eaton Corporation PLC, Caterpillar Inc, Kohler Power Systems, and Wacker Neuson SE holding significant market share. Market share analysis reveals Generac and Honda hold approximately xx% and xx% respectively (as of 2024), indicating a competitive landscape. Innovation is driven by the increasing demand for reliable power backup solutions in residential, commercial, and industrial sectors. Stringent emission regulations and a growing focus on fuel efficiency are shaping product development. Furthermore, the market witnesses continuous mergers and acquisitions (M&A) activity, with deal values totaling xx Million in the last five years, mainly focused on expanding product portfolios and geographical reach. The average deal size was approximately xx Million. Substitutes such as uninterrupted power supply (UPS) systems are impacting market growth in specific segments, particularly within the commercial sector. End-user demographics reveal a strong demand from developing economies experiencing rapid urbanization and industrialization.
- Market Concentration: Moderately concentrated
- Top 3 Players Market Share (2024): Generac (xx%), Honda (xx%), Yamaha (xx%)
- M&A Activity (2019-2024): Total Deal Value: xx Million, Average Deal Size: xx Million
Portable Generator Market Dynamics & Trends
The portable generator market is experiencing robust growth, driven by increasing electricity demand, frequent power outages, and rising disposable incomes globally. Technological advancements, such as the incorporation of inverter technology for improved fuel efficiency and quieter operation, are significantly impacting consumer preferences. The market penetration of portable generators in the residential sector is particularly high in regions with unreliable power grids, reaching approximately xx% in some developing countries. The CAGR for the forecast period (2025-2033) is projected at xx%. Competitive dynamics are intensifying, with manufacturers focusing on innovation, cost reduction, and strategic partnerships to maintain a competitive edge. This includes expanding into new markets and developing innovative fuel options to cater to a wider range of user needs.
Dominant Regions & Segments in Portable Generator Market
The North American region holds the largest market share, driven by robust construction activity and a higher prevalence of natural disasters leading to increased demand for backup power. Within segments, the Gas fuel type dominates due to its affordability and availability. The 5-10 kW power rating segment is the largest, catering to a wide range of applications from home use to small businesses. The residential end-user segment shows strong growth due to rising awareness of power disruptions and demand for reliable energy solutions.
- Key Drivers for North American Dominance: Robust construction, frequent natural disasters, high disposable incomes.
- Largest Fuel Type Segment: Gas (due to affordability and availability)
- Largest Power Rating Segment: 5-10 kW
- Fastest Growing End-User Segment: Residential (due to rising power disruption awareness and need for reliable energy)
Portable Generator Market Product Innovations
Recent product developments emphasize improved fuel efficiency, quieter operation, and enhanced portability. Inverter technology is increasingly integrated into generators, offering cleaner power output and longer runtime. Manufacturers are also focusing on smart features, such as remote monitoring and control capabilities, to improve user experience. These innovations cater to the growing demand for user-friendly and efficient portable power solutions, effectively enhancing market fit and competitive advantages.
Report Scope & Segmentation Analysis
This report comprehensively segments the portable generator market by power rating (Below 5 kW, 5-10 kW, Above 10 kW), fuel type (Gas, Diesel, Other Fuel Types), and end-user (Industrial, Commercial, Residential). Each segment’s growth projections, market size, and competitive dynamics are analyzed. The Below 5 kW segment is characterized by high competition and focus on residential users. The 5-10 kW segment caters to both residential and small commercial applications, while the Above 10 kW segment serves the industrial and larger commercial segments. Fuel type segmentation reveals a preference for gas-powered generators, followed by diesel and others, driven by cost, performance and emission factors. The end-user segment indicates the dominance of residential applications, followed by commercial and industrial.
Key Drivers of Portable Generator Market Growth
The portable generator market is propelled by several factors. Firstly, increasing power outages and unreliable electricity grids, especially in developing countries, are boosting demand. Secondly, growing urbanization and industrialization are driving construction and infrastructure projects, necessitating reliable backup power solutions. Lastly, government initiatives promoting renewable energy and improving power infrastructure are indirectly benefiting the market by enhancing awareness and promoting investments.
Challenges in the Portable Generator Market Sector
The portable generator market faces challenges including stringent emission regulations, volatile fuel prices, and increasing competition from alternative power solutions. Supply chain disruptions and the rising cost of raw materials are also impacting production costs and profit margins. These factors contribute to price volatility and limit market growth. The overall impact of these challenges is estimated to reduce annual market growth by approximately xx% in the coming years.
Emerging Opportunities in Portable Generator Market
Emerging opportunities lie in the development of hybrid and renewable energy-powered portable generators. The integration of smart technology and remote monitoring capabilities offers a significant avenue for growth. Expansion into new and developing markets with unreliable electricity infrastructure presents significant growth potential. Furthermore, focusing on eco-friendly fuel options can improve market acceptance and reduce environmental concerns.
Leading Players in the Portable Generator Market Market
- Yamaha Motor Co Ltd
- Briggs & Stratton Corporation
- Atlas Copco AB
- Eaton Corporation PLC
- Caterpillar Inc
- Honda Siel Power Products Ltd
- Kohler Power Systems
- Wacker Neuson SE
- Generac Holdings Inc
Key Developments in Portable Generator Market Industry
- February 2023: Caterpillar launched the XQ330 mobile diesel generator, featuring low noise operation, weather-resistant enclosure, and rental-ready features. This launch strengthens Caterpillar's position in the high-power segment.
- January 2022: Honda announced the EU32i portable generator, emphasizing reliability and aiming for global market expansion. This product enhances Honda's competitiveness in the smaller-power segment.
Future Outlook for Portable Generator Market Market
The portable generator market is poised for continued growth, driven by increasing urbanization, industrialization, and the need for reliable backup power. Technological advancements, such as the integration of renewable energy sources and smart features, will further shape market dynamics. Strategic partnerships and expansion into emerging markets present significant growth opportunities for manufacturers. The market is anticipated to witness a sustained period of moderate growth, with innovations focusing on efficiency, sustainability, and user experience becoming increasingly important.
Portable Generator Market Segmentation
-
1. Power Rating
- 1.1. Below 5 kW
- 1.2. 5-10 kW
- 1.3. Above 10 kW
-
2. Fuel Type
- 2.1. Gas
- 2.2. Diesel
- 2.3. Other Fuel Types
-
3. End User
- 3.1. Industrial
- 3.2. Commercial
- 3.3. Residential
Portable Generator Market Segmentation By Geography
-
1. North America
- 1.1. United States
- 1.2. Canada
- 1.3. Rest of North America
-
2. Europe
- 2.1. Germany
- 2.2. France
- 2.3. United Kingdom
- 2.4. Spain
- 2.5. NORDIC
- 2.6. Turkey
- 2.7. Russia
- 2.8. Rest of Europe
-
3. Asia Pacific
- 3.1. India
- 3.2. China
- 3.3. Japan
- 3.4. Australia
- 3.5. Malaysia
- 3.6. Thailand
- 3.7. Indonesia
- 3.8. Vietnam
- 3.9. Rest of Asia Pacific
-
4. South America
- 4.1. Brazil
- 4.2. Argentina
- 4.3. Colombia
- 4.4. Rest of South America
-
5. Middle East and Africa
- 5.1. United Arab Emirates
- 5.2. Saudi Arabia
- 5.3. Nigeria
- 5.4. Rest of Middle East and Africa
Portable Generator Market REPORT HIGHLIGHTS
| Aspects | Details |
|---|---|
| Study Period | 2019-2033 |
| Base Year | 2024 |
| Estimated Year | 2025 |
| Forecast Period | 2025-2033 |
| Historical Period | 2019-2024 |
| Growth Rate | CAGR of 5.86% from 2019-2033 |
| Segmentation |
|
Table of Contents
- 1. Introduction
- 1.1. Research Scope
- 1.2. Market Segmentation
- 1.3. Research Methodology
- 1.4. Definitions and Assumptions
- 2. Executive Summary
- 2.1. Introduction
- 3. Market Dynamics
- 3.1. Introduction
- 3.2. Market Drivers
- 3.2.1. Increasing Demand for Power
- 3.3. Market Restrains
- 3.3.1. Increasing Demand for Battery Storage Systems and other Cleaner Sources of Standby Power
- 3.4. Market Trends
- 3.4.1. Industrial Sector to be a Significant Market Segment
- 4. Market Factor Analysis
- 4.1. Porters Five Forces
- 4.2. Supply/Value Chain
- 4.3. PESTEL analysis
- 4.4. Market Entropy
- 4.5. Patent/Trademark Analysis
- 5. Global Portable Generator Market Analysis, Insights and Forecast, 2019-2031
- 5.1. Market Analysis, Insights and Forecast - by Power Rating
- 5.1.1. Below 5 kW
- 5.1.2. 5-10 kW
- 5.1.3. Above 10 kW
- 5.2. Market Analysis, Insights and Forecast - by Fuel Type
- 5.2.1. Gas
- 5.2.2. Diesel
- 5.2.3. Other Fuel Types
- 5.3. Market Analysis, Insights and Forecast - by End User
- 5.3.1. Industrial
- 5.3.2. Commercial
- 5.3.3. Residential
- 5.4. Market Analysis, Insights and Forecast - by Region
- 5.4.1. North America
- 5.4.2. Europe
- 5.4.3. Asia Pacific
- 5.4.4. South America
- 5.4.5. Middle East and Africa
- 5.1. Market Analysis, Insights and Forecast - by Power Rating
- 6. North America Portable Generator Market Analysis, Insights and Forecast, 2019-2031
- 6.1. Market Analysis, Insights and Forecast - by Power Rating
- 6.1.1. Below 5 kW
- 6.1.2. 5-10 kW
- 6.1.3. Above 10 kW
- 6.2. Market Analysis, Insights and Forecast - by Fuel Type
- 6.2.1. Gas
- 6.2.2. Diesel
- 6.2.3. Other Fuel Types
- 6.3. Market Analysis, Insights and Forecast - by End User
- 6.3.1. Industrial
- 6.3.2. Commercial
- 6.3.3. Residential
- 6.1. Market Analysis, Insights and Forecast - by Power Rating
- 7. Europe Portable Generator Market Analysis, Insights and Forecast, 2019-2031
- 7.1. Market Analysis, Insights and Forecast - by Power Rating
- 7.1.1. Below 5 kW
- 7.1.2. 5-10 kW
- 7.1.3. Above 10 kW
- 7.2. Market Analysis, Insights and Forecast - by Fuel Type
- 7.2.1. Gas
- 7.2.2. Diesel
- 7.2.3. Other Fuel Types
- 7.3. Market Analysis, Insights and Forecast - by End User
- 7.3.1. Industrial
- 7.3.2. Commercial
- 7.3.3. Residential
- 7.1. Market Analysis, Insights and Forecast - by Power Rating
- 8. Asia Pacific Portable Generator Market Analysis, Insights and Forecast, 2019-2031
- 8.1. Market Analysis, Insights and Forecast - by Power Rating
- 8.1.1. Below 5 kW
- 8.1.2. 5-10 kW
- 8.1.3. Above 10 kW
- 8.2. Market Analysis, Insights and Forecast - by Fuel Type
- 8.2.1. Gas
- 8.2.2. Diesel
- 8.2.3. Other Fuel Types
- 8.3. Market Analysis, Insights and Forecast - by End User
- 8.3.1. Industrial
- 8.3.2. Commercial
- 8.3.3. Residential
- 8.1. Market Analysis, Insights and Forecast - by Power Rating
- 9. South America Portable Generator Market Analysis, Insights and Forecast, 2019-2031
- 9.1. Market Analysis, Insights and Forecast - by Power Rating
- 9.1.1. Below 5 kW
- 9.1.2. 5-10 kW
- 9.1.3. Above 10 kW
- 9.2. Market Analysis, Insights and Forecast - by Fuel Type
- 9.2.1. Gas
- 9.2.2. Diesel
- 9.2.3. Other Fuel Types
- 9.3. Market Analysis, Insights and Forecast - by End User
- 9.3.1. Industrial
- 9.3.2. Commercial
- 9.3.3. Residential
- 9.1. Market Analysis, Insights and Forecast - by Power Rating
- 10. Middle East and Africa Portable Generator Market Analysis, Insights and Forecast, 2019-2031
- 10.1. Market Analysis, Insights and Forecast - by Power Rating
- 10.1.1. Below 5 kW
- 10.1.2. 5-10 kW
- 10.1.3. Above 10 kW
- 10.2. Market Analysis, Insights and Forecast - by Fuel Type
- 10.2.1. Gas
- 10.2.2. Diesel
- 10.2.3. Other Fuel Types
- 10.3. Market Analysis, Insights and Forecast - by End User
- 10.3.1. Industrial
- 10.3.2. Commercial
- 10.3.3. Residential
- 10.1. Market Analysis, Insights and Forecast - by Power Rating
- 11. North America Portable Generator Market Analysis, Insights and Forecast, 2019-2031
- 11.1. Market Analysis, Insights and Forecast - By Country/Sub-region
- 11.1.1 United States
- 11.1.2 Canada
- 11.1.3 Mexico
- 12. Europe Portable Generator Market Analysis, Insights and Forecast, 2019-2031
- 12.1. Market Analysis, Insights and Forecast - By Country/Sub-region
- 12.1.1 Germany
- 12.1.2 United Kingdom
- 12.1.3 France
- 12.1.4 Spain
- 12.1.5 Italy
- 12.1.6 Spain
- 12.1.7 Belgium
- 12.1.8 Netherland
- 12.1.9 Nordics
- 12.1.10 Rest of Europe
- 13. Asia Pacific Portable Generator Market Analysis, Insights and Forecast, 2019-2031
- 13.1. Market Analysis, Insights and Forecast - By Country/Sub-region
- 13.1.1 China
- 13.1.2 Japan
- 13.1.3 India
- 13.1.4 South Korea
- 13.1.5 Southeast Asia
- 13.1.6 Australia
- 13.1.7 Indonesia
- 13.1.8 Phillipes
- 13.1.9 Singapore
- 13.1.10 Thailandc
- 13.1.11 Rest of Asia Pacific
- 14. South America Portable Generator Market Analysis, Insights and Forecast, 2019-2031
- 14.1. Market Analysis, Insights and Forecast - By Country/Sub-region
- 14.1.1 Brazil
- 14.1.2 Argentina
- 14.1.3 Peru
- 14.1.4 Chile
- 14.1.5 Colombia
- 14.1.6 Ecuador
- 14.1.7 Venezuela
- 14.1.8 Rest of South America
- 15. MEA Portable Generator Market Analysis, Insights and Forecast, 2019-2031
- 15.1. Market Analysis, Insights and Forecast - By Country/Sub-region
- 15.1.1 United Arab Emirates
- 15.1.2 Saudi Arabia
- 15.1.3 South Africa
- 15.1.4 Rest of Middle East and Africa
- 16. Competitive Analysis
- 16.1. Global Market Share Analysis 2024
- 16.2. Company Profiles
- 16.2.1 Yamaha Motor Co Ltd *List Not Exhaustive 6 4 Market Ranking/Share Analysi
- 16.2.1.1. Overview
- 16.2.1.2. Products
- 16.2.1.3. SWOT Analysis
- 16.2.1.4. Recent Developments
- 16.2.1.5. Financials (Based on Availability)
- 16.2.2 Briggs & Stratton Corporation
- 16.2.2.1. Overview
- 16.2.2.2. Products
- 16.2.2.3. SWOT Analysis
- 16.2.2.4. Recent Developments
- 16.2.2.5. Financials (Based on Availability)
- 16.2.3 Atlas Copco AB
- 16.2.3.1. Overview
- 16.2.3.2. Products
- 16.2.3.3. SWOT Analysis
- 16.2.3.4. Recent Developments
- 16.2.3.5. Financials (Based on Availability)
- 16.2.4 Eaton Corporation PLC
- 16.2.4.1. Overview
- 16.2.4.2. Products
- 16.2.4.3. SWOT Analysis
- 16.2.4.4. Recent Developments
- 16.2.4.5. Financials (Based on Availability)
- 16.2.5 Caterpillar Inc
- 16.2.5.1. Overview
- 16.2.5.2. Products
- 16.2.5.3. SWOT Analysis
- 16.2.5.4. Recent Developments
- 16.2.5.5. Financials (Based on Availability)
- 16.2.6 Honda Siel Power Products Ltd
- 16.2.6.1. Overview
- 16.2.6.2. Products
- 16.2.6.3. SWOT Analysis
- 16.2.6.4. Recent Developments
- 16.2.6.5. Financials (Based on Availability)
- 16.2.7 Kohler Power Systems
- 16.2.7.1. Overview
- 16.2.7.2. Products
- 16.2.7.3. SWOT Analysis
- 16.2.7.4. Recent Developments
- 16.2.7.5. Financials (Based on Availability)
- 16.2.8 Wacker Neuson SE
- 16.2.8.1. Overview
- 16.2.8.2. Products
- 16.2.8.3. SWOT Analysis
- 16.2.8.4. Recent Developments
- 16.2.8.5. Financials (Based on Availability)
- 16.2.9 Generac Holdings Inc
- 16.2.9.1. Overview
- 16.2.9.2. Products
- 16.2.9.3. SWOT Analysis
- 16.2.9.4. Recent Developments
- 16.2.9.5. Financials (Based on Availability)
- 16.2.1 Yamaha Motor Co Ltd *List Not Exhaustive 6 4 Market Ranking/Share Analysi
List of Figures
- Figure 1: Global Portable Generator Market Revenue Breakdown (Million, %) by Region 2024 & 2032
- Figure 2: Global Portable Generator Market Volume Breakdown (K Unit, %) by Region 2024 & 2032
- Figure 3: North America Portable Generator Market Revenue (Million), by Country 2024 & 2032
- Figure 4: North America Portable Generator Market Volume (K Unit), by Country 2024 & 2032
- Figure 5: North America Portable Generator Market Revenue Share (%), by Country 2024 & 2032
- Figure 6: North America Portable Generator Market Volume Share (%), by Country 2024 & 2032
- Figure 7: Europe Portable Generator Market Revenue (Million), by Country 2024 & 2032
- Figure 8: Europe Portable Generator Market Volume (K Unit), by Country 2024 & 2032
- Figure 9: Europe Portable Generator Market Revenue Share (%), by Country 2024 & 2032
- Figure 10: Europe Portable Generator Market Volume Share (%), by Country 2024 & 2032
- Figure 11: Asia Pacific Portable Generator Market Revenue (Million), by Country 2024 & 2032
- Figure 12: Asia Pacific Portable Generator Market Volume (K Unit), by Country 2024 & 2032
- Figure 13: Asia Pacific Portable Generator Market Revenue Share (%), by Country 2024 & 2032
- Figure 14: Asia Pacific Portable Generator Market Volume Share (%), by Country 2024 & 2032
- Figure 15: South America Portable Generator Market Revenue (Million), by Country 2024 & 2032
- Figure 16: South America Portable Generator Market Volume (K Unit), by Country 2024 & 2032
- Figure 17: South America Portable Generator Market Revenue Share (%), by Country 2024 & 2032
- Figure 18: South America Portable Generator Market Volume Share (%), by Country 2024 & 2032
- Figure 19: MEA Portable Generator Market Revenue (Million), by Country 2024 & 2032
- Figure 20: MEA Portable Generator Market Volume (K Unit), by Country 2024 & 2032
- Figure 21: MEA Portable Generator Market Revenue Share (%), by Country 2024 & 2032
- Figure 22: MEA Portable Generator Market Volume Share (%), by Country 2024 & 2032
- Figure 23: North America Portable Generator Market Revenue (Million), by Power Rating 2024 & 2032
- Figure 24: North America Portable Generator Market Volume (K Unit), by Power Rating 2024 & 2032
- Figure 25: North America Portable Generator Market Revenue Share (%), by Power Rating 2024 & 2032
- Figure 26: North America Portable Generator Market Volume Share (%), by Power Rating 2024 & 2032
- Figure 27: North America Portable Generator Market Revenue (Million), by Fuel Type 2024 & 2032
- Figure 28: North America Portable Generator Market Volume (K Unit), by Fuel Type 2024 & 2032
- Figure 29: North America Portable Generator Market Revenue Share (%), by Fuel Type 2024 & 2032
- Figure 30: North America Portable Generator Market Volume Share (%), by Fuel Type 2024 & 2032
- Figure 31: North America Portable Generator Market Revenue (Million), by End User 2024 & 2032
- Figure 32: North America Portable Generator Market Volume (K Unit), by End User 2024 & 2032
- Figure 33: North America Portable Generator Market Revenue Share (%), by End User 2024 & 2032
- Figure 34: North America Portable Generator Market Volume Share (%), by End User 2024 & 2032
- Figure 35: North America Portable Generator Market Revenue (Million), by Country 2024 & 2032
- Figure 36: North America Portable Generator Market Volume (K Unit), by Country 2024 & 2032
- Figure 37: North America Portable Generator Market Revenue Share (%), by Country 2024 & 2032
- Figure 38: North America Portable Generator Market Volume Share (%), by Country 2024 & 2032
- Figure 39: Europe Portable Generator Market Revenue (Million), by Power Rating 2024 & 2032
- Figure 40: Europe Portable Generator Market Volume (K Unit), by Power Rating 2024 & 2032
- Figure 41: Europe Portable Generator Market Revenue Share (%), by Power Rating 2024 & 2032
- Figure 42: Europe Portable Generator Market Volume Share (%), by Power Rating 2024 & 2032
- Figure 43: Europe Portable Generator Market Revenue (Million), by Fuel Type 2024 & 2032
- Figure 44: Europe Portable Generator Market Volume (K Unit), by Fuel Type 2024 & 2032
- Figure 45: Europe Portable Generator Market Revenue Share (%), by Fuel Type 2024 & 2032
- Figure 46: Europe Portable Generator Market Volume Share (%), by Fuel Type 2024 & 2032
- Figure 47: Europe Portable Generator Market Revenue (Million), by End User 2024 & 2032
- Figure 48: Europe Portable Generator Market Volume (K Unit), by End User 2024 & 2032
- Figure 49: Europe Portable Generator Market Revenue Share (%), by End User 2024 & 2032
- Figure 50: Europe Portable Generator Market Volume Share (%), by End User 2024 & 2032
- Figure 51: Europe Portable Generator Market Revenue (Million), by Country 2024 & 2032
- Figure 52: Europe Portable Generator Market Volume (K Unit), by Country 2024 & 2032
- Figure 53: Europe Portable Generator Market Revenue Share (%), by Country 2024 & 2032
- Figure 54: Europe Portable Generator Market Volume Share (%), by Country 2024 & 2032
- Figure 55: Asia Pacific Portable Generator Market Revenue (Million), by Power Rating 2024 & 2032
- Figure 56: Asia Pacific Portable Generator Market Volume (K Unit), by Power Rating 2024 & 2032
- Figure 57: Asia Pacific Portable Generator Market Revenue Share (%), by Power Rating 2024 & 2032
- Figure 58: Asia Pacific Portable Generator Market Volume Share (%), by Power Rating 2024 & 2032
- Figure 59: Asia Pacific Portable Generator Market Revenue (Million), by Fuel Type 2024 & 2032
- Figure 60: Asia Pacific Portable Generator Market Volume (K Unit), by Fuel Type 2024 & 2032
- Figure 61: Asia Pacific Portable Generator Market Revenue Share (%), by Fuel Type 2024 & 2032
- Figure 62: Asia Pacific Portable Generator Market Volume Share (%), by Fuel Type 2024 & 2032
- Figure 63: Asia Pacific Portable Generator Market Revenue (Million), by End User 2024 & 2032
- Figure 64: Asia Pacific Portable Generator Market Volume (K Unit), by End User 2024 & 2032
- Figure 65: Asia Pacific Portable Generator Market Revenue Share (%), by End User 2024 & 2032
- Figure 66: Asia Pacific Portable Generator Market Volume Share (%), by End User 2024 & 2032
- Figure 67: Asia Pacific Portable Generator Market Revenue (Million), by Country 2024 & 2032
- Figure 68: Asia Pacific Portable Generator Market Volume (K Unit), by Country 2024 & 2032
- Figure 69: Asia Pacific Portable Generator Market Revenue Share (%), by Country 2024 & 2032
- Figure 70: Asia Pacific Portable Generator Market Volume Share (%), by Country 2024 & 2032
- Figure 71: South America Portable Generator Market Revenue (Million), by Power Rating 2024 & 2032
- Figure 72: South America Portable Generator Market Volume (K Unit), by Power Rating 2024 & 2032
- Figure 73: South America Portable Generator Market Revenue Share (%), by Power Rating 2024 & 2032
- Figure 74: South America Portable Generator Market Volume Share (%), by Power Rating 2024 & 2032
- Figure 75: South America Portable Generator Market Revenue (Million), by Fuel Type 2024 & 2032
- Figure 76: South America Portable Generator Market Volume (K Unit), by Fuel Type 2024 & 2032
- Figure 77: South America Portable Generator Market Revenue Share (%), by Fuel Type 2024 & 2032
- Figure 78: South America Portable Generator Market Volume Share (%), by Fuel Type 2024 & 2032
- Figure 79: South America Portable Generator Market Revenue (Million), by End User 2024 & 2032
- Figure 80: South America Portable Generator Market Volume (K Unit), by End User 2024 & 2032
- Figure 81: South America Portable Generator Market Revenue Share (%), by End User 2024 & 2032
- Figure 82: South America Portable Generator Market Volume Share (%), by End User 2024 & 2032
- Figure 83: South America Portable Generator Market Revenue (Million), by Country 2024 & 2032
- Figure 84: South America Portable Generator Market Volume (K Unit), by Country 2024 & 2032
- Figure 85: South America Portable Generator Market Revenue Share (%), by Country 2024 & 2032
- Figure 86: South America Portable Generator Market Volume Share (%), by Country 2024 & 2032
- Figure 87: Middle East and Africa Portable Generator Market Revenue (Million), by Power Rating 2024 & 2032
- Figure 88: Middle East and Africa Portable Generator Market Volume (K Unit), by Power Rating 2024 & 2032
- Figure 89: Middle East and Africa Portable Generator Market Revenue Share (%), by Power Rating 2024 & 2032
- Figure 90: Middle East and Africa Portable Generator Market Volume Share (%), by Power Rating 2024 & 2032
- Figure 91: Middle East and Africa Portable Generator Market Revenue (Million), by Fuel Type 2024 & 2032
- Figure 92: Middle East and Africa Portable Generator Market Volume (K Unit), by Fuel Type 2024 & 2032
- Figure 93: Middle East and Africa Portable Generator Market Revenue Share (%), by Fuel Type 2024 & 2032
- Figure 94: Middle East and Africa Portable Generator Market Volume Share (%), by Fuel Type 2024 & 2032
- Figure 95: Middle East and Africa Portable Generator Market Revenue (Million), by End User 2024 & 2032
- Figure 96: Middle East and Africa Portable Generator Market Volume (K Unit), by End User 2024 & 2032
- Figure 97: Middle East and Africa Portable Generator Market Revenue Share (%), by End User 2024 & 2032
- Figure 98: Middle East and Africa Portable Generator Market Volume Share (%), by End User 2024 & 2032
- Figure 99: Middle East and Africa Portable Generator Market Revenue (Million), by Country 2024 & 2032
- Figure 100: Middle East and Africa Portable Generator Market Volume (K Unit), by Country 2024 & 2032
- Figure 101: Middle East and Africa Portable Generator Market Revenue Share (%), by Country 2024 & 2032
- Figure 102: Middle East and Africa Portable Generator Market Volume Share (%), by Country 2024 & 2032
List of Tables
- Table 1: Global Portable Generator Market Revenue Million Forecast, by Region 2019 & 2032
- Table 2: Global Portable Generator Market Volume K Unit Forecast, by Region 2019 & 2032
- Table 3: Global Portable Generator Market Revenue Million Forecast, by Power Rating 2019 & 2032
- Table 4: Global Portable Generator Market Volume K Unit Forecast, by Power Rating 2019 & 2032
- Table 5: Global Portable Generator Market Revenue Million Forecast, by Fuel Type 2019 & 2032
- Table 6: Global Portable Generator Market Volume K Unit Forecast, by Fuel Type 2019 & 2032
- Table 7: Global Portable Generator Market Revenue Million Forecast, by End User 2019 & 2032
- Table 8: Global Portable Generator Market Volume K Unit Forecast, by End User 2019 & 2032
- Table 9: Global Portable Generator Market Revenue Million Forecast, by Region 2019 & 2032
- Table 10: Global Portable Generator Market Volume K Unit Forecast, by Region 2019 & 2032
- Table 11: Global Portable Generator Market Revenue Million Forecast, by Country 2019 & 2032
- Table 12: Global Portable Generator Market Volume K Unit Forecast, by Country 2019 & 2032
- Table 13: United States Portable Generator Market Revenue (Million) Forecast, by Application 2019 & 2032
- Table 14: United States Portable Generator Market Volume (K Unit) Forecast, by Application 2019 & 2032
- Table 15: Canada Portable Generator Market Revenue (Million) Forecast, by Application 2019 & 2032
- Table 16: Canada Portable Generator Market Volume (K Unit) Forecast, by Application 2019 & 2032
- Table 17: Mexico Portable Generator Market Revenue (Million) Forecast, by Application 2019 & 2032
- Table 18: Mexico Portable Generator Market Volume (K Unit) Forecast, by Application 2019 & 2032
- Table 19: Global Portable Generator Market Revenue Million Forecast, by Country 2019 & 2032
- Table 20: Global Portable Generator Market Volume K Unit Forecast, by Country 2019 & 2032
- Table 21: Germany Portable Generator Market Revenue (Million) Forecast, by Application 2019 & 2032
- Table 22: Germany Portable Generator Market Volume (K Unit) Forecast, by Application 2019 & 2032
- Table 23: United Kingdom Portable Generator Market Revenue (Million) Forecast, by Application 2019 & 2032
- Table 24: United Kingdom Portable Generator Market Volume (K Unit) Forecast, by Application 2019 & 2032
- Table 25: France Portable Generator Market Revenue (Million) Forecast, by Application 2019 & 2032
- Table 26: France Portable Generator Market Volume (K Unit) Forecast, by Application 2019 & 2032
- Table 27: Spain Portable Generator Market Revenue (Million) Forecast, by Application 2019 & 2032
- Table 28: Spain Portable Generator Market Volume (K Unit) Forecast, by Application 2019 & 2032
- Table 29: Italy Portable Generator Market Revenue (Million) Forecast, by Application 2019 & 2032
- Table 30: Italy Portable Generator Market Volume (K Unit) Forecast, by Application 2019 & 2032
- Table 31: Spain Portable Generator Market Revenue (Million) Forecast, by Application 2019 & 2032
- Table 32: Spain Portable Generator Market Volume (K Unit) Forecast, by Application 2019 & 2032
- Table 33: Belgium Portable Generator Market Revenue (Million) Forecast, by Application 2019 & 2032
- Table 34: Belgium Portable Generator Market Volume (K Unit) Forecast, by Application 2019 & 2032
- Table 35: Netherland Portable Generator Market Revenue (Million) Forecast, by Application 2019 & 2032
- Table 36: Netherland Portable Generator Market Volume (K Unit) Forecast, by Application 2019 & 2032
- Table 37: Nordics Portable Generator Market Revenue (Million) Forecast, by Application 2019 & 2032
- Table 38: Nordics Portable Generator Market Volume (K Unit) Forecast, by Application 2019 & 2032
- Table 39: Rest of Europe Portable Generator Market Revenue (Million) Forecast, by Application 2019 & 2032
- Table 40: Rest of Europe Portable Generator Market Volume (K Unit) Forecast, by Application 2019 & 2032
- Table 41: Global Portable Generator Market Revenue Million Forecast, by Country 2019 & 2032
- Table 42: Global Portable Generator Market Volume K Unit Forecast, by Country 2019 & 2032
- Table 43: China Portable Generator Market Revenue (Million) Forecast, by Application 2019 & 2032
- Table 44: China Portable Generator Market Volume (K Unit) Forecast, by Application 2019 & 2032
- Table 45: Japan Portable Generator Market Revenue (Million) Forecast, by Application 2019 & 2032
- Table 46: Japan Portable Generator Market Volume (K Unit) Forecast, by Application 2019 & 2032
- Table 47: India Portable Generator Market Revenue (Million) Forecast, by Application 2019 & 2032
- Table 48: India Portable Generator Market Volume (K Unit) Forecast, by Application 2019 & 2032
- Table 49: South Korea Portable Generator Market Revenue (Million) Forecast, by Application 2019 & 2032
- Table 50: South Korea Portable Generator Market Volume (K Unit) Forecast, by Application 2019 & 2032
- Table 51: Southeast Asia Portable Generator Market Revenue (Million) Forecast, by Application 2019 & 2032
- Table 52: Southeast Asia Portable Generator Market Volume (K Unit) Forecast, by Application 2019 & 2032
- Table 53: Australia Portable Generator Market Revenue (Million) Forecast, by Application 2019 & 2032
- Table 54: Australia Portable Generator Market Volume (K Unit) Forecast, by Application 2019 & 2032
- Table 55: Indonesia Portable Generator Market Revenue (Million) Forecast, by Application 2019 & 2032
- Table 56: Indonesia Portable Generator Market Volume (K Unit) Forecast, by Application 2019 & 2032
- Table 57: Phillipes Portable Generator Market Revenue (Million) Forecast, by Application 2019 & 2032
- Table 58: Phillipes Portable Generator Market Volume (K Unit) Forecast, by Application 2019 & 2032
- Table 59: Singapore Portable Generator Market Revenue (Million) Forecast, by Application 2019 & 2032
- Table 60: Singapore Portable Generator Market Volume (K Unit) Forecast, by Application 2019 & 2032
- Table 61: Thailandc Portable Generator Market Revenue (Million) Forecast, by Application 2019 & 2032
- Table 62: Thailandc Portable Generator Market Volume (K Unit) Forecast, by Application 2019 & 2032
- Table 63: Rest of Asia Pacific Portable Generator Market Revenue (Million) Forecast, by Application 2019 & 2032
- Table 64: Rest of Asia Pacific Portable Generator Market Volume (K Unit) Forecast, by Application 2019 & 2032
- Table 65: Global Portable Generator Market Revenue Million Forecast, by Country 2019 & 2032
- Table 66: Global Portable Generator Market Volume K Unit Forecast, by Country 2019 & 2032
- Table 67: Brazil Portable Generator Market Revenue (Million) Forecast, by Application 2019 & 2032
- Table 68: Brazil Portable Generator Market Volume (K Unit) Forecast, by Application 2019 & 2032
- Table 69: Argentina Portable Generator Market Revenue (Million) Forecast, by Application 2019 & 2032
- Table 70: Argentina Portable Generator Market Volume (K Unit) Forecast, by Application 2019 & 2032
- Table 71: Peru Portable Generator Market Revenue (Million) Forecast, by Application 2019 & 2032
- Table 72: Peru Portable Generator Market Volume (K Unit) Forecast, by Application 2019 & 2032
- Table 73: Chile Portable Generator Market Revenue (Million) Forecast, by Application 2019 & 2032
- Table 74: Chile Portable Generator Market Volume (K Unit) Forecast, by Application 2019 & 2032
- Table 75: Colombia Portable Generator Market Revenue (Million) Forecast, by Application 2019 & 2032
- Table 76: Colombia Portable Generator Market Volume (K Unit) Forecast, by Application 2019 & 2032
- Table 77: Ecuador Portable Generator Market Revenue (Million) Forecast, by Application 2019 & 2032
- Table 78: Ecuador Portable Generator Market Volume (K Unit) Forecast, by Application 2019 & 2032
- Table 79: Venezuela Portable Generator Market Revenue (Million) Forecast, by Application 2019 & 2032
- Table 80: Venezuela Portable Generator Market Volume (K Unit) Forecast, by Application 2019 & 2032
- Table 81: Rest of South America Portable Generator Market Revenue (Million) Forecast, by Application 2019 & 2032
- Table 82: Rest of South America Portable Generator Market Volume (K Unit) Forecast, by Application 2019 & 2032
- Table 83: Global Portable Generator Market Revenue Million Forecast, by Country 2019 & 2032
- Table 84: Global Portable Generator Market Volume K Unit Forecast, by Country 2019 & 2032
- Table 85: United Arab Emirates Portable Generator Market Revenue (Million) Forecast, by Application 2019 & 2032
- Table 86: United Arab Emirates Portable Generator Market Volume (K Unit) Forecast, by Application 2019 & 2032
- Table 87: Saudi Arabia Portable Generator Market Revenue (Million) Forecast, by Application 2019 & 2032
- Table 88: Saudi Arabia Portable Generator Market Volume (K Unit) Forecast, by Application 2019 & 2032
- Table 89: South Africa Portable Generator Market Revenue (Million) Forecast, by Application 2019 & 2032
- Table 90: South Africa Portable Generator Market Volume (K Unit) Forecast, by Application 2019 & 2032
- Table 91: Rest of Middle East and Africa Portable Generator Market Revenue (Million) Forecast, by Application 2019 & 2032
- Table 92: Rest of Middle East and Africa Portable Generator Market Volume (K Unit) Forecast, by Application 2019 & 2032
- Table 93: Global Portable Generator Market Revenue Million Forecast, by Power Rating 2019 & 2032
- Table 94: Global Portable Generator Market Volume K Unit Forecast, by Power Rating 2019 & 2032
- Table 95: Global Portable Generator Market Revenue Million Forecast, by Fuel Type 2019 & 2032
- Table 96: Global Portable Generator Market Volume K Unit Forecast, by Fuel Type 2019 & 2032
- Table 97: Global Portable Generator Market Revenue Million Forecast, by End User 2019 & 2032
- Table 98: Global Portable Generator Market Volume K Unit Forecast, by End User 2019 & 2032
- Table 99: Global Portable Generator Market Revenue Million Forecast, by Country 2019 & 2032
- Table 100: Global Portable Generator Market Volume K Unit Forecast, by Country 2019 & 2032
- Table 101: United States Portable Generator Market Revenue (Million) Forecast, by Application 2019 & 2032
- Table 102: United States Portable Generator Market Volume (K Unit) Forecast, by Application 2019 & 2032
- Table 103: Canada Portable Generator Market Revenue (Million) Forecast, by Application 2019 & 2032
- Table 104: Canada Portable Generator Market Volume (K Unit) Forecast, by Application 2019 & 2032
- Table 105: Rest of North America Portable Generator Market Revenue (Million) Forecast, by Application 2019 & 2032
- Table 106: Rest of North America Portable Generator Market Volume (K Unit) Forecast, by Application 2019 & 2032
- Table 107: Global Portable Generator Market Revenue Million Forecast, by Power Rating 2019 & 2032
- Table 108: Global Portable Generator Market Volume K Unit Forecast, by Power Rating 2019 & 2032
- Table 109: Global Portable Generator Market Revenue Million Forecast, by Fuel Type 2019 & 2032
- Table 110: Global Portable Generator Market Volume K Unit Forecast, by Fuel Type 2019 & 2032
- Table 111: Global Portable Generator Market Revenue Million Forecast, by End User 2019 & 2032
- Table 112: Global Portable Generator Market Volume K Unit Forecast, by End User 2019 & 2032
- Table 113: Global Portable Generator Market Revenue Million Forecast, by Country 2019 & 2032
- Table 114: Global Portable Generator Market Volume K Unit Forecast, by Country 2019 & 2032
- Table 115: Germany Portable Generator Market Revenue (Million) Forecast, by Application 2019 & 2032
- Table 116: Germany Portable Generator Market Volume (K Unit) Forecast, by Application 2019 & 2032
- Table 117: France Portable Generator Market Revenue (Million) Forecast, by Application 2019 & 2032
- Table 118: France Portable Generator Market Volume (K Unit) Forecast, by Application 2019 & 2032
- Table 119: United Kingdom Portable Generator Market Revenue (Million) Forecast, by Application 2019 & 2032
- Table 120: United Kingdom Portable Generator Market Volume (K Unit) Forecast, by Application 2019 & 2032
- Table 121: Spain Portable Generator Market Revenue (Million) Forecast, by Application 2019 & 2032
- Table 122: Spain Portable Generator Market Volume (K Unit) Forecast, by Application 2019 & 2032
- Table 123: NORDIC Portable Generator Market Revenue (Million) Forecast, by Application 2019 & 2032
- Table 124: NORDIC Portable Generator Market Volume (K Unit) Forecast, by Application 2019 & 2032
- Table 125: Turkey Portable Generator Market Revenue (Million) Forecast, by Application 2019 & 2032
- Table 126: Turkey Portable Generator Market Volume (K Unit) Forecast, by Application 2019 & 2032
- Table 127: Russia Portable Generator Market Revenue (Million) Forecast, by Application 2019 & 2032
- Table 128: Russia Portable Generator Market Volume (K Unit) Forecast, by Application 2019 & 2032
- Table 129: Rest of Europe Portable Generator Market Revenue (Million) Forecast, by Application 2019 & 2032
- Table 130: Rest of Europe Portable Generator Market Volume (K Unit) Forecast, by Application 2019 & 2032
- Table 131: Global Portable Generator Market Revenue Million Forecast, by Power Rating 2019 & 2032
- Table 132: Global Portable Generator Market Volume K Unit Forecast, by Power Rating 2019 & 2032
- Table 133: Global Portable Generator Market Revenue Million Forecast, by Fuel Type 2019 & 2032
- Table 134: Global Portable Generator Market Volume K Unit Forecast, by Fuel Type 2019 & 2032
- Table 135: Global Portable Generator Market Revenue Million Forecast, by End User 2019 & 2032
- Table 136: Global Portable Generator Market Volume K Unit Forecast, by End User 2019 & 2032
- Table 137: Global Portable Generator Market Revenue Million Forecast, by Country 2019 & 2032
- Table 138: Global Portable Generator Market Volume K Unit Forecast, by Country 2019 & 2032
- Table 139: India Portable Generator Market Revenue (Million) Forecast, by Application 2019 & 2032
- Table 140: India Portable Generator Market Volume (K Unit) Forecast, by Application 2019 & 2032
- Table 141: China Portable Generator Market Revenue (Million) Forecast, by Application 2019 & 2032
- Table 142: China Portable Generator Market Volume (K Unit) Forecast, by Application 2019 & 2032
- Table 143: Japan Portable Generator Market Revenue (Million) Forecast, by Application 2019 & 2032
- Table 144: Japan Portable Generator Market Volume (K Unit) Forecast, by Application 2019 & 2032
- Table 145: Australia Portable Generator Market Revenue (Million) Forecast, by Application 2019 & 2032
- Table 146: Australia Portable Generator Market Volume (K Unit) Forecast, by Application 2019 & 2032
- Table 147: Malaysia Portable Generator Market Revenue (Million) Forecast, by Application 2019 & 2032
- Table 148: Malaysia Portable Generator Market Volume (K Unit) Forecast, by Application 2019 & 2032
- Table 149: Thailand Portable Generator Market Revenue (Million) Forecast, by Application 2019 & 2032
- Table 150: Thailand Portable Generator Market Volume (K Unit) Forecast, by Application 2019 & 2032
- Table 151: Indonesia Portable Generator Market Revenue (Million) Forecast, by Application 2019 & 2032
- Table 152: Indonesia Portable Generator Market Volume (K Unit) Forecast, by Application 2019 & 2032
- Table 153: Vietnam Portable Generator Market Revenue (Million) Forecast, by Application 2019 & 2032
- Table 154: Vietnam Portable Generator Market Volume (K Unit) Forecast, by Application 2019 & 2032
- Table 155: Rest of Asia Pacific Portable Generator Market Revenue (Million) Forecast, by Application 2019 & 2032
- Table 156: Rest of Asia Pacific Portable Generator Market Volume (K Unit) Forecast, by Application 2019 & 2032
- Table 157: Global Portable Generator Market Revenue Million Forecast, by Power Rating 2019 & 2032
- Table 158: Global Portable Generator Market Volume K Unit Forecast, by Power Rating 2019 & 2032
- Table 159: Global Portable Generator Market Revenue Million Forecast, by Fuel Type 2019 & 2032
- Table 160: Global Portable Generator Market Volume K Unit Forecast, by Fuel Type 2019 & 2032
- Table 161: Global Portable Generator Market Revenue Million Forecast, by End User 2019 & 2032
- Table 162: Global Portable Generator Market Volume K Unit Forecast, by End User 2019 & 2032
- Table 163: Global Portable Generator Market Revenue Million Forecast, by Country 2019 & 2032
- Table 164: Global Portable Generator Market Volume K Unit Forecast, by Country 2019 & 2032
- Table 165: Brazil Portable Generator Market Revenue (Million) Forecast, by Application 2019 & 2032
- Table 166: Brazil Portable Generator Market Volume (K Unit) Forecast, by Application 2019 & 2032
- Table 167: Argentina Portable Generator Market Revenue (Million) Forecast, by Application 2019 & 2032
- Table 168: Argentina Portable Generator Market Volume (K Unit) Forecast, by Application 2019 & 2032
- Table 169: Colombia Portable Generator Market Revenue (Million) Forecast, by Application 2019 & 2032
- Table 170: Colombia Portable Generator Market Volume (K Unit) Forecast, by Application 2019 & 2032
- Table 171: Rest of South America Portable Generator Market Revenue (Million) Forecast, by Application 2019 & 2032
- Table 172: Rest of South America Portable Generator Market Volume (K Unit) Forecast, by Application 2019 & 2032
- Table 173: Global Portable Generator Market Revenue Million Forecast, by Power Rating 2019 & 2032
- Table 174: Global Portable Generator Market Volume K Unit Forecast, by Power Rating 2019 & 2032
- Table 175: Global Portable Generator Market Revenue Million Forecast, by Fuel Type 2019 & 2032
- Table 176: Global Portable Generator Market Volume K Unit Forecast, by Fuel Type 2019 & 2032
- Table 177: Global Portable Generator Market Revenue Million Forecast, by End User 2019 & 2032
- Table 178: Global Portable Generator Market Volume K Unit Forecast, by End User 2019 & 2032
- Table 179: Global Portable Generator Market Revenue Million Forecast, by Country 2019 & 2032
- Table 180: Global Portable Generator Market Volume K Unit Forecast, by Country 2019 & 2032
- Table 181: United Arab Emirates Portable Generator Market Revenue (Million) Forecast, by Application 2019 & 2032
- Table 182: United Arab Emirates Portable Generator Market Volume (K Unit) Forecast, by Application 2019 & 2032
- Table 183: Saudi Arabia Portable Generator Market Revenue (Million) Forecast, by Application 2019 & 2032
- Table 184: Saudi Arabia Portable Generator Market Volume (K Unit) Forecast, by Application 2019 & 2032
- Table 185: Nigeria Portable Generator Market Revenue (Million) Forecast, by Application 2019 & 2032
- Table 186: Nigeria Portable Generator Market Volume (K Unit) Forecast, by Application 2019 & 2032
- Table 187: Rest of Middle East and Africa Portable Generator Market Revenue (Million) Forecast, by Application 2019 & 2032
- Table 188: Rest of Middle East and Africa Portable Generator Market Volume (K Unit) Forecast, by Application 2019 & 2032
Frequently Asked Questions
1. What is the projected Compound Annual Growth Rate (CAGR) of the Portable Generator Market?
The projected CAGR is approximately 5.86%.
2. Which companies are prominent players in the Portable Generator Market?
Key companies in the market include Yamaha Motor Co Ltd *List Not Exhaustive 6 4 Market Ranking/Share Analysi, Briggs & Stratton Corporation, Atlas Copco AB, Eaton Corporation PLC, Caterpillar Inc, Honda Siel Power Products Ltd, Kohler Power Systems, Wacker Neuson SE, Generac Holdings Inc.
3. What are the main segments of the Portable Generator Market?
The market segments include Power Rating, Fuel Type, End User.
4. Can you provide details about the market size?
The market size is estimated to be USD 5.53 Million as of 2022.
5. What are some drivers contributing to market growth?
Increasing Demand for Power.
6. What are the notable trends driving market growth?
Industrial Sector to be a Significant Market Segment.
7. Are there any restraints impacting market growth?
Increasing Demand for Battery Storage Systems and other Cleaner Sources of Standby Power.
8. Can you provide examples of recent developments in the market?
February 2023: Caterpillar announced the launch of the XQ330 mobile diesel generator powered by the Cat C9.3B diesel engine; the XQ330 is rated for up to 288 kW in standby and 264 kW in prime operation at 60 Hz and up to 341 kVA in standby and 310 kVA in prime power applications at 50 Hz. Engineered to operate at low noise levels, the XQ330 packages system components in a weather-resistant enclosure. It is also equipped with several rental-ready features, including a battery charger, block heater, switchable voltage outputs, permanent magnet generator (PMG), and optional mounting on a trailer.
9. What pricing options are available for accessing the report?
Pricing options include single-user, multi-user, and enterprise licenses priced at USD 4750, USD 5250, and USD 8750 respectively.
10. Is the market size provided in terms of value or volume?
The market size is provided in terms of value, measured in Million and volume, measured in K Unit.
11. Are there any specific market keywords associated with the report?
Yes, the market keyword associated with the report is "Portable Generator Market," which aids in identifying and referencing the specific market segment covered.
12. How do I determine which pricing option suits my needs best?
The pricing options vary based on user requirements and access needs. Individual users may opt for single-user licenses, while businesses requiring broader access may choose multi-user or enterprise licenses for cost-effective access to the report.
13. Are there any additional resources or data provided in the Portable Generator Market report?
While the report offers comprehensive insights, it's advisable to review the specific contents or supplementary materials provided to ascertain if additional resources or data are available.
14. How can I stay updated on further developments or reports in the Portable Generator Market?
To stay informed about further developments, trends, and reports in the Portable Generator Market, consider subscribing to industry newsletters, following relevant companies and organizations, or regularly checking reputable industry news sources and publications.
Methodology
Step 1 - Identification of Relevant Samples Size from Population Database


Step 2 - Approaches for Defining Global Market Size (Value, Volume* & Price*)

Note*: In applicable scenarios
Step 3 - Data Sources
Primary Research
- Web Analytics
- Survey Reports
- Research Institute
- Latest Research Reports
- Opinion Leaders
Secondary Research
- Annual Reports
- White Paper
- Latest Press Release
- Industry Association
- Paid Database
- Investor Presentations

Step 4 - Data Triangulation
Involves using different sources of information in order to increase the validity of a study
These sources are likely to be stakeholders in a program - participants, other researchers, program staff, other community members, and so on.
Then we put all data in single framework & apply various statistical tools to find out the dynamic on the market.
During the analysis stage, feedback from the stakeholder groups would be compared to determine areas of agreement as well as areas of divergence


