
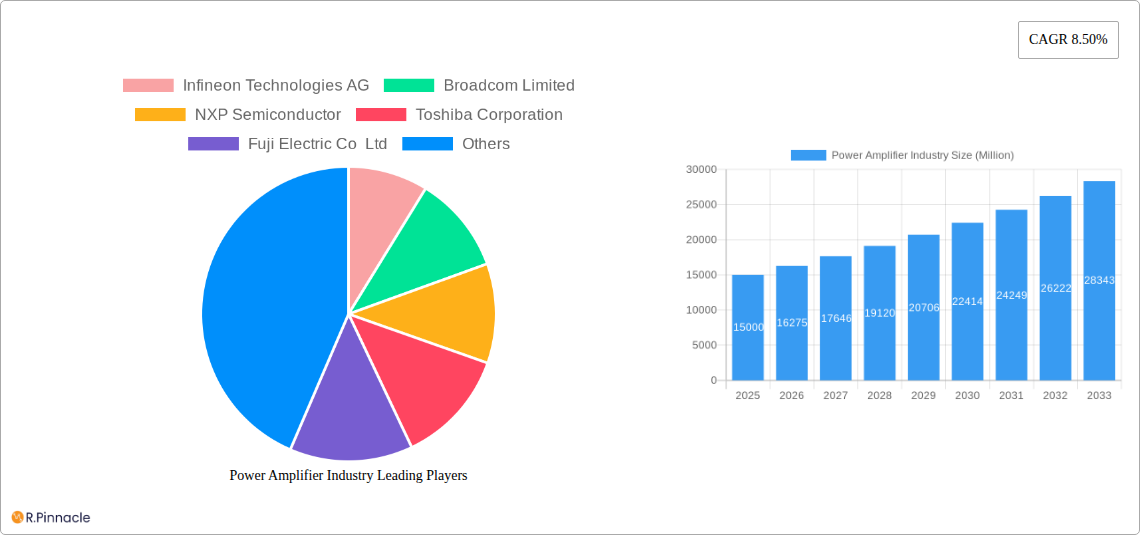
Key Insights
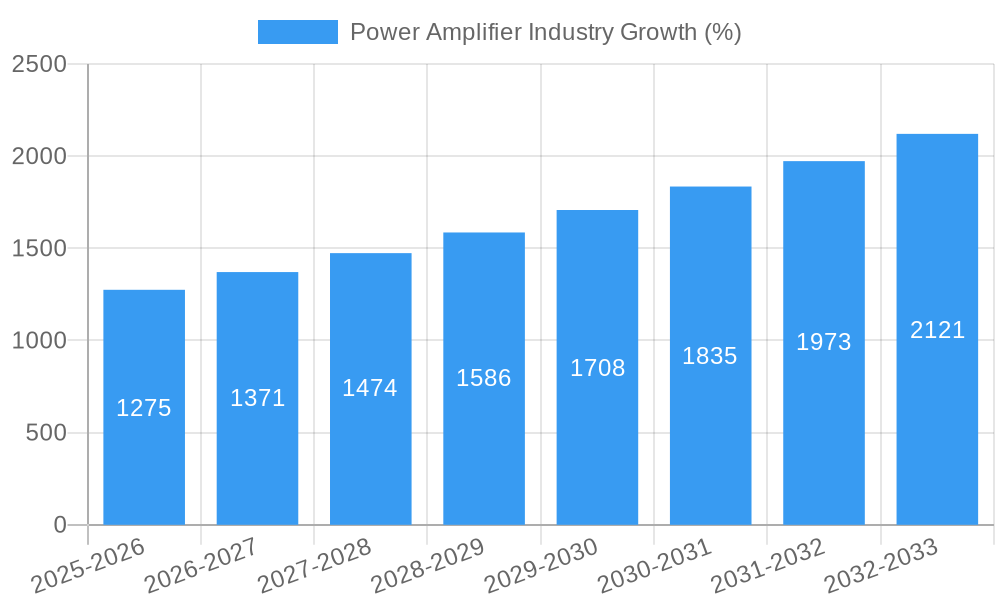
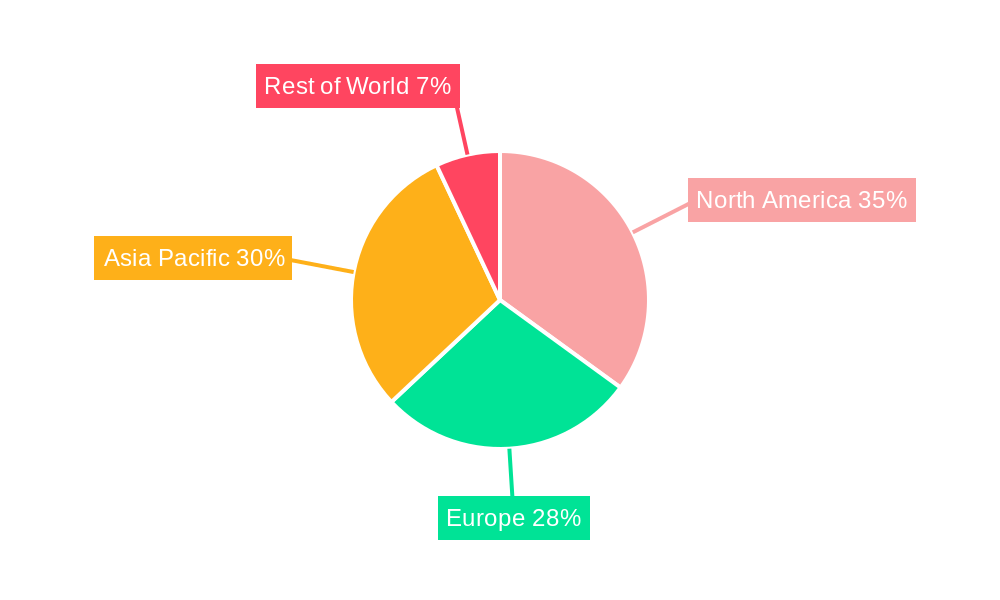
The global power amplifier market is experiencing robust growth, projected to reach a significant size within the forecast period of 2025-2033. Driven by the increasing demand for high-speed data transmission in 5G networks, the proliferation of smart devices, and the rapid expansion of the automotive and industrial sectors, this market is poised for continued expansion. The 8.50% CAGR signifies a substantial increase in market value over the next decade. Key industry segments like consumer electronics (driven by smartphones and wearables), telecommunications (fueled by 5G infrastructure development), and automotive (with the rise of advanced driver-assistance systems and electric vehicles) are major contributors to this growth. Competition is intense, with established players like Infineon Technologies AG, Broadcom Limited, and Texas Instruments Incorporated vying for market share alongside other significant manufacturers. While technological advancements and miniaturization are key trends, potential restraints include the high cost of advanced power amplifier technologies and the complexity of integrating these components into various applications. However, ongoing research and development efforts are focused on improving efficiency and reducing costs, addressing these challenges. The geographic distribution reflects a strong presence in North America and Asia-Pacific, with these regions driving significant market demand. The European market also represents a substantial segment.
The forecast anticipates continued market expansion across all major geographic regions. Asia-Pacific, fueled by strong growth in China and other emerging economies, is expected to witness substantial growth. North America's mature market is predicted to maintain steady growth, driven by ongoing technological advancements and upgrades. Europe's market will likely experience healthy growth due to increased investment in infrastructure and technological adoption. The overall market's trajectory indicates continued success, although specific growth rates within each segment will depend on factors such as technological innovation, regulatory changes, and macroeconomic conditions. The competitive landscape is expected to remain highly competitive, with ongoing consolidation and strategic partnerships shaping the industry dynamics.
Power Amplifier Industry Report: 2019-2033 Forecast
This comprehensive report provides an in-depth analysis of the Power Amplifier industry, offering invaluable insights for industry professionals, investors, and strategic decision-makers. With a study period spanning 2019-2033, a base year of 2025, and a forecast period of 2025-2033, this report leverages rigorous data analysis and expert insights to illuminate current market dynamics and future growth trajectories. The report covers key market segments (Consumer Electronics, Industrial, Telecommunication, Automotive, and Other Industry Verticals) and profiles leading players including Infineon Technologies AG, Broadcom Limited, NXP Semiconductor, Toshiba Corporation, Fuji Electric Co Ltd, Maxim Integrated, Murata Manufacturing Co Ltd, Mitsubishi Electric Corporation, Qorvo Inc, Texas Instruments Incorporated, Analog Devices Inc, and STMicroelectronics NV.
Power Amplifier Industry Market Structure & Innovation Trends
This section analyzes the competitive landscape, innovation drivers, and regulatory influences shaping the power amplifier market. We examine market concentration, revealing the market share held by key players and exploring the impact of mergers and acquisitions (M&A) activities. Deal values for significant M&A transactions within the study period will be detailed, providing context to the evolving industry structure. The influence of regulatory frameworks and the presence of product substitutes are also assessed. Finally, we examine end-user demographics and their influence on demand.
- Market Concentration: Analysis of market share distribution among leading players (Infineon Technologies AG, Broadcom Limited, etc.) for 2024 and projected market share for 2033.
- Innovation Drivers: Examination of technological advancements (e.g., GaN technology, SiC technology) driving innovation and market growth.
- Regulatory Frameworks: Assessment of the impact of government regulations on market development and industry practices.
- M&A Activities: Review of significant mergers and acquisitions, including deal values and their strategic implications. Analysis suggests a total M&A deal value of approximately $xx Million during the historical period.
Power Amplifier Industry Market Dynamics & Trends
This section dives deep into the driving forces and disruptive trends influencing power amplifier market growth. We analyze market growth drivers (e.g., increasing demand for high-speed data transmission, advancements in 5G infrastructure), technological disruptions (e.g., introduction of new materials and processes), shifting consumer preferences, and the evolving competitive dynamics. Specific metrics such as Compound Annual Growth Rate (CAGR) and market penetration rates will be presented for each key segment. The expected CAGR for the forecast period is estimated at xx%. Market penetration for 5G-related power amplifiers is projected to reach xx% by 2033.
Dominant Regions & Segments in Power Amplifier Industry
This section identifies the leading regions and segments within the power amplifier industry. A detailed analysis will highlight the dominance of specific regions (e.g., Asia Pacific, North America, Europe) and industry verticals (Consumer Electronics, Industrial, Telecommunication, Automotive, Other Industry Vertical). We will analyze the key drivers contributing to the dominance of these regions and segments, providing both quantitative and qualitative assessments.
- Consumer Electronics: Key drivers include the proliferation of smartphones, wearables, and other consumer devices.
- Industrial: Drivers include automation, industrial IoT, and increasing adoption of smart manufacturing technologies.
- Telecommunication: Growth driven by the expansion of 5G networks and the demand for higher bandwidth.
- Automotive: Key drivers are the increasing adoption of advanced driver-assistance systems (ADAS) and electric vehicles.
- Other Industry Vertical: This section will discuss other applications and their contribution to market growth. This is predicted to grow at a CAGR of xx% during the forecast period.
Power Amplifier Industry Product Innovations
This section summarizes recent product developments, highlighting technological trends and their impact on market competitiveness. The focus will be on key innovations and their market fit, including new materials, improved efficiency, and enhanced performance characteristics. We will discuss the competitive advantages afforded by these innovations.
Report Scope & Segmentation Analysis
This section details the market segmentation by industry vertical, providing a comprehensive overview of each segment, including growth projections, market size estimates, and competitive dynamics. The report's scope encompasses the entire power amplifier industry, covering all major applications and geographic regions.
- Consumer Electronics: Market size estimates for 2024 and projected market size for 2033 will be provided, along with analysis of key competitive dynamics.
- Industrial: Similar market size estimates and competitive analysis.
- Telecommunication: Similar market size estimates and competitive analysis.
- Automotive: Similar market size estimates and competitive analysis.
- Other Industry Vertical: Similar market size estimates and competitive analysis.
Key Drivers of Power Amplifier Industry Growth
This section outlines the key factors driving the growth of the power amplifier industry. We will discuss technological advancements, economic factors (e.g., increasing disposable income), and favorable regulatory policies contributing to expansion.
Challenges in the Power Amplifier Industry Sector
This section examines the major challenges and restraints facing the power amplifier industry. We will assess the impact of regulatory hurdles, supply chain disruptions, and intensifying competition on market growth. The estimated loss in revenue due to supply chain issues is projected at $xx Million in 2024.
Emerging Opportunities in Power Amplifier Industry
This section highlights emerging opportunities for growth and innovation in the power amplifier market. We will examine new market segments, emerging technologies, and shifts in consumer preferences creating potential for expansion. The report predicts a $xx Million market opportunity in the xx sector by 2033.
Leading Players in the Power Amplifier Industry Market
- Infineon Technologies AG
- Broadcom Limited
- NXP Semiconductor
- Toshiba Corporation
- Fuji Electric Co Ltd
- Maxim Integrated
- Murata Manufacturing Co Ltd
- Mitsubishi Electric Corporation
- Qorvo Inc
- Texas Instruments Incorporated
- Analog Devices Inc
- STMicroelectronics NV
Key Developments in Power Amplifier Industry
- January 2024: Company X launched a new high-efficiency power amplifier.
- March 2024: Company Y announced a strategic partnership to develop advanced power amplifier technology.
- June 2024: Company Z acquired Company A, expanding its market presence. (Further details on these and other developments will be included in the full report).
Future Outlook for Power Amplifier Industry Market
The future of the power amplifier industry is promising, driven by the continued growth of key application areas, technological advancements, and favorable macroeconomic conditions. Significant opportunities exist for companies to innovate and capture market share in emerging segments, particularly in the 5G and automotive sectors. The report projects strong growth for the foreseeable future, positioning the power amplifier industry for sustained expansion.
Power Amplifier Industry Segmentation
-
1. Industry Vertical
- 1.1. Consumer Electronics
- 1.2. Industrial
- 1.3. Telecommunication
- 1.4. Automotive
- 1.5. Other Industry Vertical
Power Amplifier Industry Segmentation By Geography
-
1. North America
- 1.1. United States
- 1.2. Canada
-
2. Europe
- 2.1. Germany
- 2.2. United Kingdom
- 2.3. France
- 2.4. Rest of Europe
-
3. Asia Pacific
- 3.1. China
- 3.2. Japan
- 3.3. South Korea
- 3.4. Rest of Asia Pacific
- 4. Rest of the World
Power Amplifier Industry REPORT HIGHLIGHTS
| Aspects | Details |
|---|---|
| Study Period | 2019-2033 |
| Base Year | 2024 |
| Estimated Year | 2025 |
| Forecast Period | 2025-2033 |
| Historical Period | 2019-2024 |
| Growth Rate | CAGR of 8.50% from 2019-2033 |
| Segmentation |
|
Table of Contents
- 1. Introduction
- 1.1. Research Scope
- 1.2. Market Segmentation
- 1.3. Research Methodology
- 1.4. Definitions and Assumptions
- 2. Executive Summary
- 2.1. Introduction
- 3. Market Dynamics
- 3.1. Introduction
- 3.2. Market Drivers
- 3.2.1. ; Augmented Demand for Consumer Electronics; Growing Transition toward 5G and Long-term Evolution (LTE) Implementation
- 3.3. Market Restrains
- 3.3.1. ; Deminished Price Margin
- 3.4. Market Trends
- 3.4.1. Consumer Electronics Sector to Offer Potential Growth Opportunities
- 4. Market Factor Analysis
- 4.1. Porters Five Forces
- 4.2. Supply/Value Chain
- 4.3. PESTEL analysis
- 4.4. Market Entropy
- 4.5. Patent/Trademark Analysis
- 5. Global Power Amplifier Industry Analysis, Insights and Forecast, 2019-2031
- 5.1. Market Analysis, Insights and Forecast - by Industry Vertical
- 5.1.1. Consumer Electronics
- 5.1.2. Industrial
- 5.1.3. Telecommunication
- 5.1.4. Automotive
- 5.1.5. Other Industry Vertical
- 5.2. Market Analysis, Insights and Forecast - by Region
- 5.2.1. North America
- 5.2.2. Europe
- 5.2.3. Asia Pacific
- 5.2.4. Rest of the World
- 5.1. Market Analysis, Insights and Forecast - by Industry Vertical
- 6. North America Power Amplifier Industry Analysis, Insights and Forecast, 2019-2031
- 6.1. Market Analysis, Insights and Forecast - by Industry Vertical
- 6.1.1. Consumer Electronics
- 6.1.2. Industrial
- 6.1.3. Telecommunication
- 6.1.4. Automotive
- 6.1.5. Other Industry Vertical
- 6.1. Market Analysis, Insights and Forecast - by Industry Vertical
- 7. Europe Power Amplifier Industry Analysis, Insights and Forecast, 2019-2031
- 7.1. Market Analysis, Insights and Forecast - by Industry Vertical
- 7.1.1. Consumer Electronics
- 7.1.2. Industrial
- 7.1.3. Telecommunication
- 7.1.4. Automotive
- 7.1.5. Other Industry Vertical
- 7.1. Market Analysis, Insights and Forecast - by Industry Vertical
- 8. Asia Pacific Power Amplifier Industry Analysis, Insights and Forecast, 2019-2031
- 8.1. Market Analysis, Insights and Forecast - by Industry Vertical
- 8.1.1. Consumer Electronics
- 8.1.2. Industrial
- 8.1.3. Telecommunication
- 8.1.4. Automotive
- 8.1.5. Other Industry Vertical
- 8.1. Market Analysis, Insights and Forecast - by Industry Vertical
- 9. Rest of the World Power Amplifier Industry Analysis, Insights and Forecast, 2019-2031
- 9.1. Market Analysis, Insights and Forecast - by Industry Vertical
- 9.1.1. Consumer Electronics
- 9.1.2. Industrial
- 9.1.3. Telecommunication
- 9.1.4. Automotive
- 9.1.5. Other Industry Vertical
- 9.1. Market Analysis, Insights and Forecast - by Industry Vertical
- 10. North America Power Amplifier Industry Analysis, Insights and Forecast, 2019-2031
- 10.1. Market Analysis, Insights and Forecast - By Country/Sub-region
- 10.1.1 United States
- 10.1.2 Canada
- 11. Europe Power Amplifier Industry Analysis, Insights and Forecast, 2019-2031
- 11.1. Market Analysis, Insights and Forecast - By Country/Sub-region
- 11.1.1 Germany
- 11.1.2 United Kingdom
- 11.1.3 France
- 11.1.4 Rest of Europe
- 12. Asia Pacific Power Amplifier Industry Analysis, Insights and Forecast, 2019-2031
- 12.1. Market Analysis, Insights and Forecast - By Country/Sub-region
- 12.1.1 China
- 12.1.2 Japan
- 12.1.3 South Korea
- 12.1.4 Rest of Asia Pacific
- 13. Rest of the World Power Amplifier Industry Analysis, Insights and Forecast, 2019-2031
- 13.1. Market Analysis, Insights and Forecast - By Country/Sub-region
- 13.1.1.
- 14. Competitive Analysis
- 14.1. Global Market Share Analysis 2024
- 14.2. Company Profiles
- 14.2.1 Infineon Technologies AG
- 14.2.1.1. Overview
- 14.2.1.2. Products
- 14.2.1.3. SWOT Analysis
- 14.2.1.4. Recent Developments
- 14.2.1.5. Financials (Based on Availability)
- 14.2.2 Broadcom Limited
- 14.2.2.1. Overview
- 14.2.2.2. Products
- 14.2.2.3. SWOT Analysis
- 14.2.2.4. Recent Developments
- 14.2.2.5. Financials (Based on Availability)
- 14.2.3 NXP Semiconductor
- 14.2.3.1. Overview
- 14.2.3.2. Products
- 14.2.3.3. SWOT Analysis
- 14.2.3.4. Recent Developments
- 14.2.3.5. Financials (Based on Availability)
- 14.2.4 Toshiba Corporation
- 14.2.4.1. Overview
- 14.2.4.2. Products
- 14.2.4.3. SWOT Analysis
- 14.2.4.4. Recent Developments
- 14.2.4.5. Financials (Based on Availability)
- 14.2.5 Fuji Electric Co Ltd
- 14.2.5.1. Overview
- 14.2.5.2. Products
- 14.2.5.3. SWOT Analysis
- 14.2.5.4. Recent Developments
- 14.2.5.5. Financials (Based on Availability)
- 14.2.6 Maxim Integrated
- 14.2.6.1. Overview
- 14.2.6.2. Products
- 14.2.6.3. SWOT Analysis
- 14.2.6.4. Recent Developments
- 14.2.6.5. Financials (Based on Availability)
- 14.2.7 Murata Manufacturing Co Ltd*List Not Exhaustive
- 14.2.7.1. Overview
- 14.2.7.2. Products
- 14.2.7.3. SWOT Analysis
- 14.2.7.4. Recent Developments
- 14.2.7.5. Financials (Based on Availability)
- 14.2.8 Mitsubishi Electric Corporation
- 14.2.8.1. Overview
- 14.2.8.2. Products
- 14.2.8.3. SWOT Analysis
- 14.2.8.4. Recent Developments
- 14.2.8.5. Financials (Based on Availability)
- 14.2.9 Qorvo Inc
- 14.2.9.1. Overview
- 14.2.9.2. Products
- 14.2.9.3. SWOT Analysis
- 14.2.9.4. Recent Developments
- 14.2.9.5. Financials (Based on Availability)
- 14.2.10 Texas Instruments Incorporated
- 14.2.10.1. Overview
- 14.2.10.2. Products
- 14.2.10.3. SWOT Analysis
- 14.2.10.4. Recent Developments
- 14.2.10.5. Financials (Based on Availability)
- 14.2.11 Analog Devices Inc
- 14.2.11.1. Overview
- 14.2.11.2. Products
- 14.2.11.3. SWOT Analysis
- 14.2.11.4. Recent Developments
- 14.2.11.5. Financials (Based on Availability)
- 14.2.12 Stmicroelectronics NV
- 14.2.12.1. Overview
- 14.2.12.2. Products
- 14.2.12.3. SWOT Analysis
- 14.2.12.4. Recent Developments
- 14.2.12.5. Financials (Based on Availability)
- 14.2.1 Infineon Technologies AG
List of Figures
- Figure 1: Global Power Amplifier Industry Revenue Breakdown (Million, %) by Region 2024 & 2032
- Figure 2: North America Power Amplifier Industry Revenue (Million), by Country 2024 & 2032
- Figure 3: North America Power Amplifier Industry Revenue Share (%), by Country 2024 & 2032
- Figure 4: Europe Power Amplifier Industry Revenue (Million), by Country 2024 & 2032
- Figure 5: Europe Power Amplifier Industry Revenue Share (%), by Country 2024 & 2032
- Figure 6: Asia Pacific Power Amplifier Industry Revenue (Million), by Country 2024 & 2032
- Figure 7: Asia Pacific Power Amplifier Industry Revenue Share (%), by Country 2024 & 2032
- Figure 8: Rest of the World Power Amplifier Industry Revenue (Million), by Country 2024 & 2032
- Figure 9: Rest of the World Power Amplifier Industry Revenue Share (%), by Country 2024 & 2032
- Figure 10: North America Power Amplifier Industry Revenue (Million), by Industry Vertical 2024 & 2032
- Figure 11: North America Power Amplifier Industry Revenue Share (%), by Industry Vertical 2024 & 2032
- Figure 12: North America Power Amplifier Industry Revenue (Million), by Country 2024 & 2032
- Figure 13: North America Power Amplifier Industry Revenue Share (%), by Country 2024 & 2032
- Figure 14: Europe Power Amplifier Industry Revenue (Million), by Industry Vertical 2024 & 2032
- Figure 15: Europe Power Amplifier Industry Revenue Share (%), by Industry Vertical 2024 & 2032
- Figure 16: Europe Power Amplifier Industry Revenue (Million), by Country 2024 & 2032
- Figure 17: Europe Power Amplifier Industry Revenue Share (%), by Country 2024 & 2032
- Figure 18: Asia Pacific Power Amplifier Industry Revenue (Million), by Industry Vertical 2024 & 2032
- Figure 19: Asia Pacific Power Amplifier Industry Revenue Share (%), by Industry Vertical 2024 & 2032
- Figure 20: Asia Pacific Power Amplifier Industry Revenue (Million), by Country 2024 & 2032
- Figure 21: Asia Pacific Power Amplifier Industry Revenue Share (%), by Country 2024 & 2032
- Figure 22: Rest of the World Power Amplifier Industry Revenue (Million), by Industry Vertical 2024 & 2032
- Figure 23: Rest of the World Power Amplifier Industry Revenue Share (%), by Industry Vertical 2024 & 2032
- Figure 24: Rest of the World Power Amplifier Industry Revenue (Million), by Country 2024 & 2032
- Figure 25: Rest of the World Power Amplifier Industry Revenue Share (%), by Country 2024 & 2032
List of Tables
- Table 1: Global Power Amplifier Industry Revenue Million Forecast, by Region 2019 & 2032
- Table 2: Global Power Amplifier Industry Revenue Million Forecast, by Industry Vertical 2019 & 2032
- Table 3: Global Power Amplifier Industry Revenue Million Forecast, by Region 2019 & 2032
- Table 4: Global Power Amplifier Industry Revenue Million Forecast, by Country 2019 & 2032
- Table 5: United States Power Amplifier Industry Revenue (Million) Forecast, by Application 2019 & 2032
- Table 6: Canada Power Amplifier Industry Revenue (Million) Forecast, by Application 2019 & 2032
- Table 7: Global Power Amplifier Industry Revenue Million Forecast, by Country 2019 & 2032
- Table 8: Germany Power Amplifier Industry Revenue (Million) Forecast, by Application 2019 & 2032
- Table 9: United Kingdom Power Amplifier Industry Revenue (Million) Forecast, by Application 2019 & 2032
- Table 10: France Power Amplifier Industry Revenue (Million) Forecast, by Application 2019 & 2032
- Table 11: Rest of Europe Power Amplifier Industry Revenue (Million) Forecast, by Application 2019 & 2032
- Table 12: Global Power Amplifier Industry Revenue Million Forecast, by Country 2019 & 2032
- Table 13: China Power Amplifier Industry Revenue (Million) Forecast, by Application 2019 & 2032
- Table 14: Japan Power Amplifier Industry Revenue (Million) Forecast, by Application 2019 & 2032
- Table 15: South Korea Power Amplifier Industry Revenue (Million) Forecast, by Application 2019 & 2032
- Table 16: Rest of Asia Pacific Power Amplifier Industry Revenue (Million) Forecast, by Application 2019 & 2032
- Table 17: Global Power Amplifier Industry Revenue Million Forecast, by Country 2019 & 2032
- Table 18: Power Amplifier Industry Revenue (Million) Forecast, by Application 2019 & 2032
- Table 19: Global Power Amplifier Industry Revenue Million Forecast, by Industry Vertical 2019 & 2032
- Table 20: Global Power Amplifier Industry Revenue Million Forecast, by Country 2019 & 2032
- Table 21: United States Power Amplifier Industry Revenue (Million) Forecast, by Application 2019 & 2032
- Table 22: Canada Power Amplifier Industry Revenue (Million) Forecast, by Application 2019 & 2032
- Table 23: Global Power Amplifier Industry Revenue Million Forecast, by Industry Vertical 2019 & 2032
- Table 24: Global Power Amplifier Industry Revenue Million Forecast, by Country 2019 & 2032
- Table 25: Germany Power Amplifier Industry Revenue (Million) Forecast, by Application 2019 & 2032
- Table 26: United Kingdom Power Amplifier Industry Revenue (Million) Forecast, by Application 2019 & 2032
- Table 27: France Power Amplifier Industry Revenue (Million) Forecast, by Application 2019 & 2032
- Table 28: Rest of Europe Power Amplifier Industry Revenue (Million) Forecast, by Application 2019 & 2032
- Table 29: Global Power Amplifier Industry Revenue Million Forecast, by Industry Vertical 2019 & 2032
- Table 30: Global Power Amplifier Industry Revenue Million Forecast, by Country 2019 & 2032
- Table 31: China Power Amplifier Industry Revenue (Million) Forecast, by Application 2019 & 2032
- Table 32: Japan Power Amplifier Industry Revenue (Million) Forecast, by Application 2019 & 2032
- Table 33: South Korea Power Amplifier Industry Revenue (Million) Forecast, by Application 2019 & 2032
- Table 34: Rest of Asia Pacific Power Amplifier Industry Revenue (Million) Forecast, by Application 2019 & 2032
- Table 35: Global Power Amplifier Industry Revenue Million Forecast, by Industry Vertical 2019 & 2032
- Table 36: Global Power Amplifier Industry Revenue Million Forecast, by Country 2019 & 2032
Frequently Asked Questions
1. What is the projected Compound Annual Growth Rate (CAGR) of the Power Amplifier Industry?
The projected CAGR is approximately 8.50%.
2. Which companies are prominent players in the Power Amplifier Industry?
Key companies in the market include Infineon Technologies AG, Broadcom Limited, NXP Semiconductor, Toshiba Corporation, Fuji Electric Co Ltd, Maxim Integrated, Murata Manufacturing Co Ltd*List Not Exhaustive, Mitsubishi Electric Corporation, Qorvo Inc, Texas Instruments Incorporated, Analog Devices Inc, Stmicroelectronics NV.
3. What are the main segments of the Power Amplifier Industry?
The market segments include Industry Vertical.
4. Can you provide details about the market size?
The market size is estimated to be USD XX Million as of 2022.
5. What are some drivers contributing to market growth?
; Augmented Demand for Consumer Electronics; Growing Transition toward 5G and Long-term Evolution (LTE) Implementation.
6. What are the notable trends driving market growth?
Consumer Electronics Sector to Offer Potential Growth Opportunities.
7. Are there any restraints impacting market growth?
; Deminished Price Margin.
8. Can you provide examples of recent developments in the market?
N/A
9. What pricing options are available for accessing the report?
Pricing options include single-user, multi-user, and enterprise licenses priced at USD 4750, USD 5250, and USD 8750 respectively.
10. Is the market size provided in terms of value or volume?
The market size is provided in terms of value, measured in Million.
11. Are there any specific market keywords associated with the report?
Yes, the market keyword associated with the report is "Power Amplifier Industry," which aids in identifying and referencing the specific market segment covered.
12. How do I determine which pricing option suits my needs best?
The pricing options vary based on user requirements and access needs. Individual users may opt for single-user licenses, while businesses requiring broader access may choose multi-user or enterprise licenses for cost-effective access to the report.
13. Are there any additional resources or data provided in the Power Amplifier Industry report?
While the report offers comprehensive insights, it's advisable to review the specific contents or supplementary materials provided to ascertain if additional resources or data are available.
14. How can I stay updated on further developments or reports in the Power Amplifier Industry?
To stay informed about further developments, trends, and reports in the Power Amplifier Industry, consider subscribing to industry newsletters, following relevant companies and organizations, or regularly checking reputable industry news sources and publications.
Methodology
Step 1 - Identification of Relevant Samples Size from Population Database


Step 2 - Approaches for Defining Global Market Size (Value, Volume* & Price*)

Note*: In applicable scenarios
Step 3 - Data Sources
Primary Research
- Web Analytics
- Survey Reports
- Research Institute
- Latest Research Reports
- Opinion Leaders
Secondary Research
- Annual Reports
- White Paper
- Latest Press Release
- Industry Association
- Paid Database
- Investor Presentations

Step 4 - Data Triangulation
Involves using different sources of information in order to increase the validity of a study
These sources are likely to be stakeholders in a program - participants, other researchers, program staff, other community members, and so on.
Then we put all data in single framework & apply various statistical tools to find out the dynamic on the market.
During the analysis stage, feedback from the stakeholder groups would be compared to determine areas of agreement as well as areas of divergence


