
Key Insights
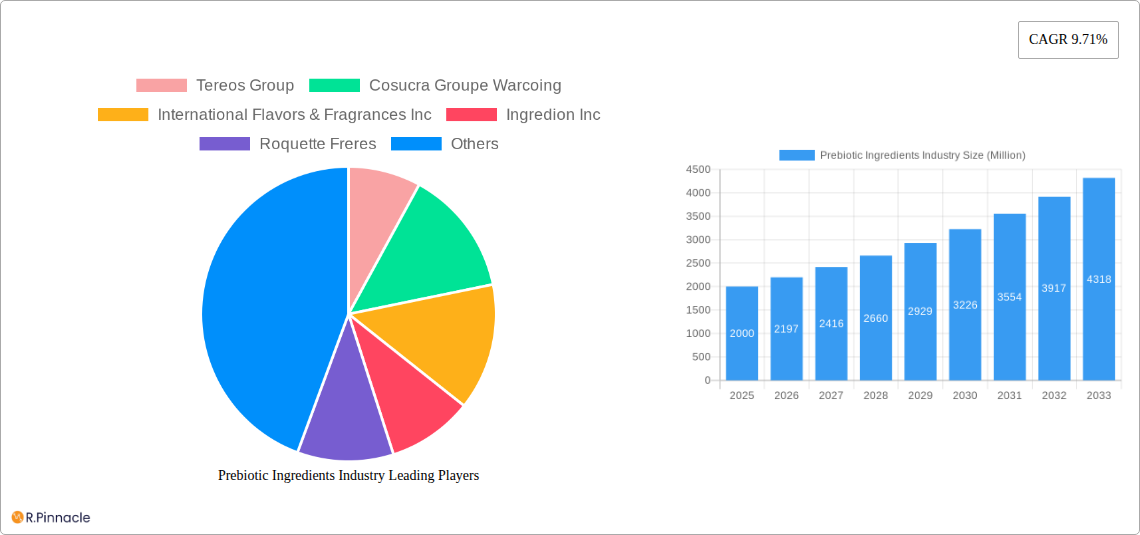
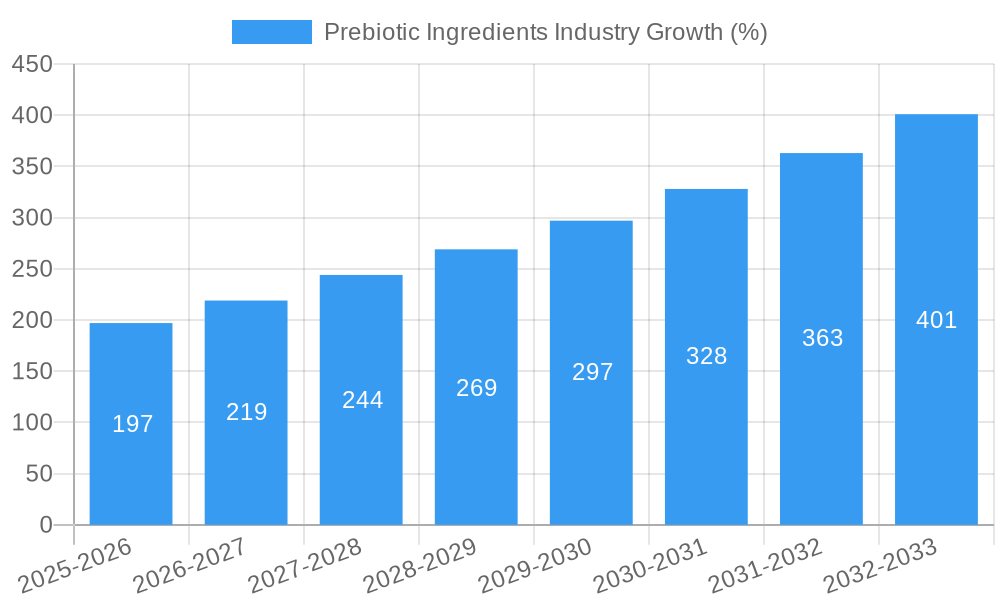
The prebiotic ingredients market, valued at approximately $XX million in 2025, is projected to experience robust growth, exhibiting a compound annual growth rate (CAGR) of 9.71% from 2025 to 2033. This expansion is driven by several key factors. The increasing consumer awareness of gut health and its impact on overall well-being fuels demand for prebiotic-enhanced foods and supplements. The functional food and beverage sector, a major application area, is witnessing significant growth, with manufacturers incorporating prebiotics to improve product attributes and cater to health-conscious consumers. Furthermore, the rising prevalence of digestive disorders and the associated need for effective preventative and therapeutic solutions are bolstering market demand. The infant formula and baby food segment also contributes significantly, driven by the understanding of the crucial role of gut microbiota in infant development. Technological advancements in prebiotic extraction and production, leading to increased efficiency and reduced costs, are further supporting market expansion.
However, challenges remain. Price fluctuations in raw materials, particularly for certain prebiotic types like inulin and fructooligosaccharides (FOS), can impact market profitability. Stringent regulatory requirements and varying standards across different regions pose another hurdle. Furthermore, maintaining consistent product quality and ensuring consumer trust are paramount for sustained market success. Despite these challenges, the long-term outlook for the prebiotic ingredients market remains positive, driven by ongoing research highlighting the significant health benefits of prebiotics and the continued expansion of related product categories, such as dietary supplements and pet food. Market segmentation reveals strong performance across various application areas and geographical regions, with North America and Europe currently leading the market. The Asia-Pacific region, however, is poised for significant growth due to rising disposable incomes and increasing health awareness. Major players like Tereos Group, Cosucra Groupe Warcoing, and Ingredion Inc. are strategically positioning themselves to capitalize on these trends.
Prebiotic Ingredients Industry Report: 2019-2033
This comprehensive report provides a detailed analysis of the Prebiotic Ingredients market, offering invaluable insights for industry professionals, investors, and strategic decision-makers. Spanning the period from 2019 to 2033 (Study Period), with a base year of 2025 and a forecast period of 2025-2033, this report leverages historical data (2019-2024) to project future market trends and opportunities. The market is valued at xx Million in 2025 (Estimated Year).
Prebiotic Ingredients Industry Market Structure & Innovation Trends
This section analyzes the competitive landscape of the prebiotic ingredients market, encompassing market concentration, innovation drivers, regulatory frameworks, and M&A activities. Key players like Tereos Group, Cosucra Groupe Warcoing, Ingredion Inc, Roquette Freres, Archer Daniels Midland Company, Kerry Group, Cargill Inc, and Beneo (Süddeutsche Zuckerrübenverwertungs-Genossenschaft eG) contribute significantly to the market's dynamism. The market share held by each player varies, with larger players often holding a significant portion, leading to a moderately concentrated market.
- Market Concentration: The market is characterized by a mix of large multinational corporations and smaller specialized companies. Precise market share figures require further in-depth analysis for individual companies.
- Innovation Drivers: Growing consumer awareness of gut health, the demand for functional foods, and advancements in prebiotic extraction and processing techniques are key drivers of innovation.
- Regulatory Frameworks: Regulations regarding food safety and labeling vary across regions, influencing product development and market access. Compliance costs can vary depending on the region, impacting smaller companies more significantly.
- Product Substitutes: While prebiotics have a distinct role in gut health, consumers may substitute with other products, especially if cost factors play a strong role. The competitive landscape necessitates continual innovation to maintain market share.
- End-User Demographics: The primary end-users are food and beverage manufacturers, infant formula producers, dietary supplement companies, and animal feed manufacturers. Growth in these segments directly correlates to the market's growth.
- M&A Activities: Recent mergers and acquisitions, such as ADM's acquisition of Deerland Probiotics and the investment in Cosucra, reflect the industry's consolidation and the growing focus on prebiotic ingredients. The estimated value of these transactions runs into millions, demonstrating industry interest in the sector.
Prebiotic Ingredients Industry Market Dynamics & Trends
The prebiotic ingredients market is experiencing robust growth, driven by several key factors. The increasing prevalence of health-conscious consumers actively seeking functional foods and supplements has considerably bolstered demand. Technological advancements in extraction and production methods have resulted in cost-effective and higher-quality prebiotic ingredients, further stimulating market expansion.
The rising incidence of digestive disorders, along with growing awareness of the gut-brain axis's significance in overall health, are other important factors driving market growth. The growing demand for plant-based foods is also driving the adoption of prebiotic ingredients. The industry is witnessing increased investment and research & development, further propelling innovation and market growth. Competitive dynamics are characterized by both intense rivalry among major players and the emergence of new, innovative companies. The market's compound annual growth rate (CAGR) during the forecast period is projected to be xx%, with market penetration expected to reach xx% by 2033. This growth, however, is also subject to some challenges, such as fluctuations in raw material costs and the regulatory environment.
Dominant Regions & Segments in Prebiotic Ingredients Industry
The North American and European regions currently dominate the prebiotic ingredients market, driven by high consumer demand and established infrastructure. However, Asia-Pacific is projected to experience rapid growth in the coming years.
Key Drivers:
- North America & Europe: High consumer awareness of gut health, robust regulatory frameworks, and well-established food and beverage industries.
- Asia-Pacific: Rapidly rising disposable incomes, increasing health consciousness, and a growing population.
Segment Dominance:
- Type: Inulin and Fructooligosaccharide (FOS) currently hold the largest market share due to their wide applications and established production capabilities. However, Galactooligosaccharide (GOS) is experiencing rapid growth, fueled by its application in infant formula.
- Application: The fortified food and beverage segment is the largest application segment, followed by infant formula and baby food. The dietary supplements and animal feed segments are also showing considerable growth potential. Pet food, as a sub-segment of animal feed, also displays significant growth.
Prebiotic Ingredients Industry Product Innovations
Recent innovations focus on developing novel prebiotic ingredients with enhanced functionalities, improved stability, and targeted health benefits. For instance, there's a strong trend toward creating customized prebiotic blends to target specific gut microbiota populations or address particular health concerns. This is coupled with advancements in extraction and processing methods leading to increased purity and yield. This emphasis on innovation strengthens market competitiveness and increases consumer choice, which drives growth.
Report Scope & Segmentation Analysis
This report segments the prebiotic ingredients market based on type (Inulin, Fructooligosaccharide (FOS), Galactooligosaccharide (GOS), and Other Types) and application (Fortified Food and Beverage, Infant Formula and Baby Food, Dietary Supplements, Animal Feed, and Pet Food). Each segment's growth trajectory is analyzed, considering market size, competitive dynamics, and future potential. For example, the infant formula and baby food segment shows strong growth due to the increased awareness about gut health in infants. Growth projections vary by segment; some segments exhibit faster growth rates, reflecting consumer demand, and technological advancements.
Key Drivers of Prebiotic Ingredients Industry Growth
The prebiotic ingredients market is experiencing significant growth due to several key factors:
- Growing awareness of gut health: Consumers are increasingly aware of the gut microbiome's crucial role in overall health and wellness.
- Rising demand for functional foods: The popularity of functional foods and beverages with added health benefits is driving demand for prebiotics.
- Technological advancements: Improvements in production processes have led to increased efficiency and reduced costs.
- Favorable regulatory environment: Many governments actively support the development and marketing of health-promoting ingredients.
Challenges in the Prebiotic Ingredients Industry Sector
Several challenges hinder the prebiotic ingredients industry's growth:
- Fluctuations in raw material costs: The cost of raw materials used in prebiotic production can fluctuate significantly, impacting profitability.
- Stringent regulatory requirements: Compliance with various regulatory requirements for food and dietary supplements can be costly.
- Intense competition: The market is becoming increasingly competitive, requiring companies to differentiate themselves.
Emerging Opportunities in Prebiotic Ingredients Industry
Several emerging opportunities exist for growth:
- Expansion into new markets: Emerging economies present significant growth potential.
- Development of novel prebiotic ingredients: There's a need for ingredients with unique functionalities and targeted health benefits.
- Personalized nutrition: The trend towards personalized nutrition presents opportunities to tailor prebiotic formulations.
Leading Players in the Prebiotic Ingredients Industry Market
- Tereos Group
- Cosucra Groupe Warcoing
- International Flavors & Fragrances Inc
- Ingredion Inc
- Roquette Freres
- Archer Daniels Midland Company
- Cooperatie Koninklijke Cosun U A (sensus Bv)
- Kerry Group
- Cargill Inc
- Süddeutsche Zuckerrübenverwertungs-Genossenschaft eG (Beneo)
Key Developments in Prebiotic Ingredients Industry Industry
- November 2021: Archer Daniels Midland Company acquired Deerland Probiotics, Prebiotics, and Enzymes, significantly expanding its presence in the prebiotic ingredients market.
- July 2021: Cosucra secured a EUR 10 million investment to support its growth in the plant-based ingredients sector.
- February 2021: Cargill and Manna Tree invested in Evolve Biosystems Inc., a probiotic technology startup, further highlighting the interest in gut health solutions.
Future Outlook for Prebiotic Ingredients Industry Market
The prebiotic ingredients market is poised for continued growth, driven by rising consumer awareness of gut health, the increasing popularity of functional foods, and ongoing innovation in product development. Strategic partnerships and acquisitions will continue to shape the market landscape. The expanding applications of prebiotics in various sectors offer significant opportunities for market expansion. The development of personalized nutrition products will also contribute to the industry's growth.
Prebiotic Ingredients Industry Segmentation
-
1. Type
- 1.1. Inulin
- 1.2. Fructooligosaccharide (FOS)
- 1.3. Galactooligosaccharide (GOS)
- 1.4. Other Types
-
2. Application
- 2.1. Fortified Food and Beverage
- 2.2. Infant Formula and Baby Food
- 2.3. Dietary Supplements
-
2.4. Animal Feed
- 2.4.1. Ruminant
- 2.4.2. Poultry
- 2.4.3. Swine
- 2.4.4. Aquaculture
- 2.4.5. Other Animal Feed
- 2.5. Pet Food
Prebiotic Ingredients Industry Segmentation By Geography
-
1. North America
- 1.1. United States
- 1.2. Canada
- 1.3. Mexico
- 1.4. Rest of North America
- 2. Europe
-
3. Spain
- 3.1. United Kingdom
- 3.2. France
- 3.3. Germany
- 3.4. Saudi Arabia
- 3.5. South Africa
- 3.6. Rest of Europe
-
4. Asia Pacific
- 4.1. China
- 4.2. India
- 4.3. Australia
- 4.4. Japan
- 4.5. Rest of Asia Pacific
-
5. Latin America
- 5.1. Brazil
- 5.2. Rest of Latin America

Prebiotic Ingredients Industry REPORT HIGHLIGHTS
| Aspects | Details |
|---|---|
| Study Period | 2019-2033 |
| Base Year | 2024 |
| Estimated Year | 2025 |
| Forecast Period | 2025-2033 |
| Historical Period | 2019-2024 |
| Growth Rate | CAGR of 9.71% from 2019-2033 |
| Segmentation |
|
Table of Contents
- 1. Introduction
- 1.1. Research Scope
- 1.2. Market Segmentation
- 1.3. Research Methodology
- 1.4. Definitions and Assumptions
- 2. Executive Summary
- 2.1. Introduction
- 3. Market Dynamics
- 3.1. Introduction
- 3.2. Market Drivers
- 3.2.1. Growing consumer awareness of the importance of gut health and its impact on overall well-being
- 3.3. Market Restrains
- 3.3.1. Supply Chain Volatility and Availability Of Other Flavor Ingredients
- 3.4. Market Trends
- 3.4.1. Escalated Demand for Prebiotic Ingredients For Human and Animal Nutrition
- 4. Market Factor Analysis
- 4.1. Porters Five Forces
- 4.2. Supply/Value Chain
- 4.3. PESTEL analysis
- 4.4. Market Entropy
- 4.5. Patent/Trademark Analysis
- 5. Global Prebiotic Ingredients Industry Analysis, Insights and Forecast, 2019-2031
- 5.1. Market Analysis, Insights and Forecast - by Type
- 5.1.1. Inulin
- 5.1.2. Fructooligosaccharide (FOS)
- 5.1.3. Galactooligosaccharide (GOS)
- 5.1.4. Other Types
- 5.2. Market Analysis, Insights and Forecast - by Application
- 5.2.1. Fortified Food and Beverage
- 5.2.2. Infant Formula and Baby Food
- 5.2.3. Dietary Supplements
- 5.2.4. Animal Feed
- 5.2.4.1. Ruminant
- 5.2.4.2. Poultry
- 5.2.4.3. Swine
- 5.2.4.4. Aquaculture
- 5.2.4.5. Other Animal Feed
- 5.2.5. Pet Food
- 5.3. Market Analysis, Insights and Forecast - by Region
- 5.3.1. North America
- 5.3.2. Europe
- 5.3.3. Spain
- 5.3.4. Asia Pacific
- 5.3.5. Latin America
- 5.1. Market Analysis, Insights and Forecast - by Type
- 6. North America Prebiotic Ingredients Industry Analysis, Insights and Forecast, 2019-2031
- 6.1. Market Analysis, Insights and Forecast - by Type
- 6.1.1. Inulin
- 6.1.2. Fructooligosaccharide (FOS)
- 6.1.3. Galactooligosaccharide (GOS)
- 6.1.4. Other Types
- 6.2. Market Analysis, Insights and Forecast - by Application
- 6.2.1. Fortified Food and Beverage
- 6.2.2. Infant Formula and Baby Food
- 6.2.3. Dietary Supplements
- 6.2.4. Animal Feed
- 6.2.4.1. Ruminant
- 6.2.4.2. Poultry
- 6.2.4.3. Swine
- 6.2.4.4. Aquaculture
- 6.2.4.5. Other Animal Feed
- 6.2.5. Pet Food
- 6.1. Market Analysis, Insights and Forecast - by Type
- 7. Europe Prebiotic Ingredients Industry Analysis, Insights and Forecast, 2019-2031
- 7.1. Market Analysis, Insights and Forecast - by Type
- 7.1.1. Inulin
- 7.1.2. Fructooligosaccharide (FOS)
- 7.1.3. Galactooligosaccharide (GOS)
- 7.1.4. Other Types
- 7.2. Market Analysis, Insights and Forecast - by Application
- 7.2.1. Fortified Food and Beverage
- 7.2.2. Infant Formula and Baby Food
- 7.2.3. Dietary Supplements
- 7.2.4. Animal Feed
- 7.2.4.1. Ruminant
- 7.2.4.2. Poultry
- 7.2.4.3. Swine
- 7.2.4.4. Aquaculture
- 7.2.4.5. Other Animal Feed
- 7.2.5. Pet Food
- 7.1. Market Analysis, Insights and Forecast - by Type
- 8. Spain Prebiotic Ingredients Industry Analysis, Insights and Forecast, 2019-2031
- 8.1. Market Analysis, Insights and Forecast - by Type
- 8.1.1. Inulin
- 8.1.2. Fructooligosaccharide (FOS)
- 8.1.3. Galactooligosaccharide (GOS)
- 8.1.4. Other Types
- 8.2. Market Analysis, Insights and Forecast - by Application
- 8.2.1. Fortified Food and Beverage
- 8.2.2. Infant Formula and Baby Food
- 8.2.3. Dietary Supplements
- 8.2.4. Animal Feed
- 8.2.4.1. Ruminant
- 8.2.4.2. Poultry
- 8.2.4.3. Swine
- 8.2.4.4. Aquaculture
- 8.2.4.5. Other Animal Feed
- 8.2.5. Pet Food
- 8.1. Market Analysis, Insights and Forecast - by Type
- 9. Asia Pacific Prebiotic Ingredients Industry Analysis, Insights and Forecast, 2019-2031
- 9.1. Market Analysis, Insights and Forecast - by Type
- 9.1.1. Inulin
- 9.1.2. Fructooligosaccharide (FOS)
- 9.1.3. Galactooligosaccharide (GOS)
- 9.1.4. Other Types
- 9.2. Market Analysis, Insights and Forecast - by Application
- 9.2.1. Fortified Food and Beverage
- 9.2.2. Infant Formula and Baby Food
- 9.2.3. Dietary Supplements
- 9.2.4. Animal Feed
- 9.2.4.1. Ruminant
- 9.2.4.2. Poultry
- 9.2.4.3. Swine
- 9.2.4.4. Aquaculture
- 9.2.4.5. Other Animal Feed
- 9.2.5. Pet Food
- 9.1. Market Analysis, Insights and Forecast - by Type
- 10. Latin America Prebiotic Ingredients Industry Analysis, Insights and Forecast, 2019-2031
- 10.1. Market Analysis, Insights and Forecast - by Type
- 10.1.1. Inulin
- 10.1.2. Fructooligosaccharide (FOS)
- 10.1.3. Galactooligosaccharide (GOS)
- 10.1.4. Other Types
- 10.2. Market Analysis, Insights and Forecast - by Application
- 10.2.1. Fortified Food and Beverage
- 10.2.2. Infant Formula and Baby Food
- 10.2.3. Dietary Supplements
- 10.2.4. Animal Feed
- 10.2.4.1. Ruminant
- 10.2.4.2. Poultry
- 10.2.4.3. Swine
- 10.2.4.4. Aquaculture
- 10.2.4.5. Other Animal Feed
- 10.2.5. Pet Food
- 10.1. Market Analysis, Insights and Forecast - by Type
- 11. North America Prebiotic Ingredients Industry Analysis, Insights and Forecast, 2019-2031
- 11.1. Market Analysis, Insights and Forecast - By Country/Sub-region
- 11.1.1 United States
- 11.1.2 Canada
- 11.1.3 Mexico
- 12. Europe Prebiotic Ingredients Industry Analysis, Insights and Forecast, 2019-2031
- 12.1. Market Analysis, Insights and Forecast - By Country/Sub-region
- 12.1.1 Germany
- 12.1.2 United Kingdom
- 12.1.3 France
- 12.1.4 Spain
- 12.1.5 Italy
- 12.1.6 Spain
- 12.1.7 Belgium
- 12.1.8 Netherland
- 12.1.9 Nordics
- 12.1.10 Rest of Europe
- 13. Asia Pacific Prebiotic Ingredients Industry Analysis, Insights and Forecast, 2019-2031
- 13.1. Market Analysis, Insights and Forecast - By Country/Sub-region
- 13.1.1 China
- 13.1.2 Japan
- 13.1.3 India
- 13.1.4 South Korea
- 13.1.5 Southeast Asia
- 13.1.6 Australia
- 13.1.7 Indonesia
- 13.1.8 Phillipes
- 13.1.9 Singapore
- 13.1.10 Thailandc
- 13.1.11 Rest of Asia Pacific
- 14. South America Prebiotic Ingredients Industry Analysis, Insights and Forecast, 2019-2031
- 14.1. Market Analysis, Insights and Forecast - By Country/Sub-region
- 14.1.1 Brazil
- 14.1.2 Argentina
- 14.1.3 Peru
- 14.1.4 Chile
- 14.1.5 Colombia
- 14.1.6 Ecuador
- 14.1.7 Venezuela
- 14.1.8 Rest of South America
- 15. MEA Prebiotic Ingredients Industry Analysis, Insights and Forecast, 2019-2031
- 15.1. Market Analysis, Insights and Forecast - By Country/Sub-region
- 15.1.1 United Arab Emirates
- 15.1.2 Saudi Arabia
- 15.1.3 South Africa
- 15.1.4 Rest of Middle East and Africa
- 16. Competitive Analysis
- 16.1. Global Market Share Analysis 2024
- 16.2. Company Profiles
- 16.2.1 Tereos Group
- 16.2.1.1. Overview
- 16.2.1.2. Products
- 16.2.1.3. SWOT Analysis
- 16.2.1.4. Recent Developments
- 16.2.1.5. Financials (Based on Availability)
- 16.2.2 Cosucra Groupe Warcoing
- 16.2.2.1. Overview
- 16.2.2.2. Products
- 16.2.2.3. SWOT Analysis
- 16.2.2.4. Recent Developments
- 16.2.2.5. Financials (Based on Availability)
- 16.2.3 International Flavors & Fragrances Inc
- 16.2.3.1. Overview
- 16.2.3.2. Products
- 16.2.3.3. SWOT Analysis
- 16.2.3.4. Recent Developments
- 16.2.3.5. Financials (Based on Availability)
- 16.2.4 Ingredion Inc
- 16.2.4.1. Overview
- 16.2.4.2. Products
- 16.2.4.3. SWOT Analysis
- 16.2.4.4. Recent Developments
- 16.2.4.5. Financials (Based on Availability)
- 16.2.5 Roquette Freres
- 16.2.5.1. Overview
- 16.2.5.2. Products
- 16.2.5.3. SWOT Analysis
- 16.2.5.4. Recent Developments
- 16.2.5.5. Financials (Based on Availability)
- 16.2.6 Archer Daniels Midland Company
- 16.2.6.1. Overview
- 16.2.6.2. Products
- 16.2.6.3. SWOT Analysis
- 16.2.6.4. Recent Developments
- 16.2.6.5. Financials (Based on Availability)
- 16.2.7 Cooperatie Koninklijke Cosun U A (sensus Bv)
- 16.2.7.1. Overview
- 16.2.7.2. Products
- 16.2.7.3. SWOT Analysis
- 16.2.7.4. Recent Developments
- 16.2.7.5. Financials (Based on Availability)
- 16.2.8 Kerry Group
- 16.2.8.1. Overview
- 16.2.8.2. Products
- 16.2.8.3. SWOT Analysis
- 16.2.8.4. Recent Developments
- 16.2.8.5. Financials (Based on Availability)
- 16.2.9 Cargill Inc
- 16.2.9.1. Overview
- 16.2.9.2. Products
- 16.2.9.3. SWOT Analysis
- 16.2.9.4. Recent Developments
- 16.2.9.5. Financials (Based on Availability)
- 16.2.10 Süddeutsche Zuckerrübenverwertungs-Genossenschaft eG (Beneo)
- 16.2.10.1. Overview
- 16.2.10.2. Products
- 16.2.10.3. SWOT Analysis
- 16.2.10.4. Recent Developments
- 16.2.10.5. Financials (Based on Availability)
- 16.2.1 Tereos Group
List of Figures
- Figure 1: Global Prebiotic Ingredients Industry Revenue Breakdown (Million, %) by Region 2024 & 2032
- Figure 2: North America Prebiotic Ingredients Industry Revenue (Million), by Country 2024 & 2032
- Figure 3: North America Prebiotic Ingredients Industry Revenue Share (%), by Country 2024 & 2032
- Figure 4: Europe Prebiotic Ingredients Industry Revenue (Million), by Country 2024 & 2032
- Figure 5: Europe Prebiotic Ingredients Industry Revenue Share (%), by Country 2024 & 2032
- Figure 6: Asia Pacific Prebiotic Ingredients Industry Revenue (Million), by Country 2024 & 2032
- Figure 7: Asia Pacific Prebiotic Ingredients Industry Revenue Share (%), by Country 2024 & 2032
- Figure 8: South America Prebiotic Ingredients Industry Revenue (Million), by Country 2024 & 2032
- Figure 9: South America Prebiotic Ingredients Industry Revenue Share (%), by Country 2024 & 2032
- Figure 10: MEA Prebiotic Ingredients Industry Revenue (Million), by Country 2024 & 2032
- Figure 11: MEA Prebiotic Ingredients Industry Revenue Share (%), by Country 2024 & 2032
- Figure 12: North America Prebiotic Ingredients Industry Revenue (Million), by Type 2024 & 2032
- Figure 13: North America Prebiotic Ingredients Industry Revenue Share (%), by Type 2024 & 2032
- Figure 14: North America Prebiotic Ingredients Industry Revenue (Million), by Application 2024 & 2032
- Figure 15: North America Prebiotic Ingredients Industry Revenue Share (%), by Application 2024 & 2032
- Figure 16: North America Prebiotic Ingredients Industry Revenue (Million), by Country 2024 & 2032
- Figure 17: North America Prebiotic Ingredients Industry Revenue Share (%), by Country 2024 & 2032
- Figure 18: Europe Prebiotic Ingredients Industry Revenue (Million), by Type 2024 & 2032
- Figure 19: Europe Prebiotic Ingredients Industry Revenue Share (%), by Type 2024 & 2032
- Figure 20: Europe Prebiotic Ingredients Industry Revenue (Million), by Application 2024 & 2032
- Figure 21: Europe Prebiotic Ingredients Industry Revenue Share (%), by Application 2024 & 2032
- Figure 22: Europe Prebiotic Ingredients Industry Revenue (Million), by Country 2024 & 2032
- Figure 23: Europe Prebiotic Ingredients Industry Revenue Share (%), by Country 2024 & 2032
- Figure 24: Spain Prebiotic Ingredients Industry Revenue (Million), by Type 2024 & 2032
- Figure 25: Spain Prebiotic Ingredients Industry Revenue Share (%), by Type 2024 & 2032
- Figure 26: Spain Prebiotic Ingredients Industry Revenue (Million), by Application 2024 & 2032
- Figure 27: Spain Prebiotic Ingredients Industry Revenue Share (%), by Application 2024 & 2032
- Figure 28: Spain Prebiotic Ingredients Industry Revenue (Million), by Country 2024 & 2032
- Figure 29: Spain Prebiotic Ingredients Industry Revenue Share (%), by Country 2024 & 2032
- Figure 30: Asia Pacific Prebiotic Ingredients Industry Revenue (Million), by Type 2024 & 2032
- Figure 31: Asia Pacific Prebiotic Ingredients Industry Revenue Share (%), by Type 2024 & 2032
- Figure 32: Asia Pacific Prebiotic Ingredients Industry Revenue (Million), by Application 2024 & 2032
- Figure 33: Asia Pacific Prebiotic Ingredients Industry Revenue Share (%), by Application 2024 & 2032
- Figure 34: Asia Pacific Prebiotic Ingredients Industry Revenue (Million), by Country 2024 & 2032
- Figure 35: Asia Pacific Prebiotic Ingredients Industry Revenue Share (%), by Country 2024 & 2032
- Figure 36: Latin America Prebiotic Ingredients Industry Revenue (Million), by Type 2024 & 2032
- Figure 37: Latin America Prebiotic Ingredients Industry Revenue Share (%), by Type 2024 & 2032
- Figure 38: Latin America Prebiotic Ingredients Industry Revenue (Million), by Application 2024 & 2032
- Figure 39: Latin America Prebiotic Ingredients Industry Revenue Share (%), by Application 2024 & 2032
- Figure 40: Latin America Prebiotic Ingredients Industry Revenue (Million), by Country 2024 & 2032
- Figure 41: Latin America Prebiotic Ingredients Industry Revenue Share (%), by Country 2024 & 2032
List of Tables
- Table 1: Global Prebiotic Ingredients Industry Revenue Million Forecast, by Region 2019 & 2032
- Table 2: Global Prebiotic Ingredients Industry Revenue Million Forecast, by Type 2019 & 2032
- Table 3: Global Prebiotic Ingredients Industry Revenue Million Forecast, by Application 2019 & 2032
- Table 4: Global Prebiotic Ingredients Industry Revenue Million Forecast, by Region 2019 & 2032
- Table 5: Global Prebiotic Ingredients Industry Revenue Million Forecast, by Country 2019 & 2032
- Table 6: United States Prebiotic Ingredients Industry Revenue (Million) Forecast, by Application 2019 & 2032
- Table 7: Canada Prebiotic Ingredients Industry Revenue (Million) Forecast, by Application 2019 & 2032
- Table 8: Mexico Prebiotic Ingredients Industry Revenue (Million) Forecast, by Application 2019 & 2032
- Table 9: Global Prebiotic Ingredients Industry Revenue Million Forecast, by Country 2019 & 2032
- Table 10: Germany Prebiotic Ingredients Industry Revenue (Million) Forecast, by Application 2019 & 2032
- Table 11: United Kingdom Prebiotic Ingredients Industry Revenue (Million) Forecast, by Application 2019 & 2032
- Table 12: France Prebiotic Ingredients Industry Revenue (Million) Forecast, by Application 2019 & 2032
- Table 13: Spain Prebiotic Ingredients Industry Revenue (Million) Forecast, by Application 2019 & 2032
- Table 14: Italy Prebiotic Ingredients Industry Revenue (Million) Forecast, by Application 2019 & 2032
- Table 15: Spain Prebiotic Ingredients Industry Revenue (Million) Forecast, by Application 2019 & 2032
- Table 16: Belgium Prebiotic Ingredients Industry Revenue (Million) Forecast, by Application 2019 & 2032
- Table 17: Netherland Prebiotic Ingredients Industry Revenue (Million) Forecast, by Application 2019 & 2032
- Table 18: Nordics Prebiotic Ingredients Industry Revenue (Million) Forecast, by Application 2019 & 2032
- Table 19: Rest of Europe Prebiotic Ingredients Industry Revenue (Million) Forecast, by Application 2019 & 2032
- Table 20: Global Prebiotic Ingredients Industry Revenue Million Forecast, by Country 2019 & 2032
- Table 21: China Prebiotic Ingredients Industry Revenue (Million) Forecast, by Application 2019 & 2032
- Table 22: Japan Prebiotic Ingredients Industry Revenue (Million) Forecast, by Application 2019 & 2032
- Table 23: India Prebiotic Ingredients Industry Revenue (Million) Forecast, by Application 2019 & 2032
- Table 24: South Korea Prebiotic Ingredients Industry Revenue (Million) Forecast, by Application 2019 & 2032
- Table 25: Southeast Asia Prebiotic Ingredients Industry Revenue (Million) Forecast, by Application 2019 & 2032
- Table 26: Australia Prebiotic Ingredients Industry Revenue (Million) Forecast, by Application 2019 & 2032
- Table 27: Indonesia Prebiotic Ingredients Industry Revenue (Million) Forecast, by Application 2019 & 2032
- Table 28: Phillipes Prebiotic Ingredients Industry Revenue (Million) Forecast, by Application 2019 & 2032
- Table 29: Singapore Prebiotic Ingredients Industry Revenue (Million) Forecast, by Application 2019 & 2032
- Table 30: Thailandc Prebiotic Ingredients Industry Revenue (Million) Forecast, by Application 2019 & 2032
- Table 31: Rest of Asia Pacific Prebiotic Ingredients Industry Revenue (Million) Forecast, by Application 2019 & 2032
- Table 32: Global Prebiotic Ingredients Industry Revenue Million Forecast, by Country 2019 & 2032
- Table 33: Brazil Prebiotic Ingredients Industry Revenue (Million) Forecast, by Application 2019 & 2032
- Table 34: Argentina Prebiotic Ingredients Industry Revenue (Million) Forecast, by Application 2019 & 2032
- Table 35: Peru Prebiotic Ingredients Industry Revenue (Million) Forecast, by Application 2019 & 2032
- Table 36: Chile Prebiotic Ingredients Industry Revenue (Million) Forecast, by Application 2019 & 2032
- Table 37: Colombia Prebiotic Ingredients Industry Revenue (Million) Forecast, by Application 2019 & 2032
- Table 38: Ecuador Prebiotic Ingredients Industry Revenue (Million) Forecast, by Application 2019 & 2032
- Table 39: Venezuela Prebiotic Ingredients Industry Revenue (Million) Forecast, by Application 2019 & 2032
- Table 40: Rest of South America Prebiotic Ingredients Industry Revenue (Million) Forecast, by Application 2019 & 2032
- Table 41: Global Prebiotic Ingredients Industry Revenue Million Forecast, by Country 2019 & 2032
- Table 42: United Arab Emirates Prebiotic Ingredients Industry Revenue (Million) Forecast, by Application 2019 & 2032
- Table 43: Saudi Arabia Prebiotic Ingredients Industry Revenue (Million) Forecast, by Application 2019 & 2032
- Table 44: South Africa Prebiotic Ingredients Industry Revenue (Million) Forecast, by Application 2019 & 2032
- Table 45: Rest of Middle East and Africa Prebiotic Ingredients Industry Revenue (Million) Forecast, by Application 2019 & 2032
- Table 46: Global Prebiotic Ingredients Industry Revenue Million Forecast, by Type 2019 & 2032
- Table 47: Global Prebiotic Ingredients Industry Revenue Million Forecast, by Application 2019 & 2032
- Table 48: Global Prebiotic Ingredients Industry Revenue Million Forecast, by Country 2019 & 2032
- Table 49: United States Prebiotic Ingredients Industry Revenue (Million) Forecast, by Application 2019 & 2032
- Table 50: Canada Prebiotic Ingredients Industry Revenue (Million) Forecast, by Application 2019 & 2032
- Table 51: Mexico Prebiotic Ingredients Industry Revenue (Million) Forecast, by Application 2019 & 2032
- Table 52: Rest of North America Prebiotic Ingredients Industry Revenue (Million) Forecast, by Application 2019 & 2032
- Table 53: Global Prebiotic Ingredients Industry Revenue Million Forecast, by Type 2019 & 2032
- Table 54: Global Prebiotic Ingredients Industry Revenue Million Forecast, by Application 2019 & 2032
- Table 55: Global Prebiotic Ingredients Industry Revenue Million Forecast, by Country 2019 & 2032
- Table 56: Global Prebiotic Ingredients Industry Revenue Million Forecast, by Type 2019 & 2032
- Table 57: Global Prebiotic Ingredients Industry Revenue Million Forecast, by Application 2019 & 2032
- Table 58: Global Prebiotic Ingredients Industry Revenue Million Forecast, by Country 2019 & 2032
- Table 59: United Kingdom Prebiotic Ingredients Industry Revenue (Million) Forecast, by Application 2019 & 2032
- Table 60: France Prebiotic Ingredients Industry Revenue (Million) Forecast, by Application 2019 & 2032
- Table 61: Germany Prebiotic Ingredients Industry Revenue (Million) Forecast, by Application 2019 & 2032
- Table 62: Saudi Arabia Prebiotic Ingredients Industry Revenue (Million) Forecast, by Application 2019 & 2032
- Table 63: South Africa Prebiotic Ingredients Industry Revenue (Million) Forecast, by Application 2019 & 2032
- Table 64: Rest of Europe Prebiotic Ingredients Industry Revenue (Million) Forecast, by Application 2019 & 2032
- Table 65: Global Prebiotic Ingredients Industry Revenue Million Forecast, by Type 2019 & 2032
- Table 66: Global Prebiotic Ingredients Industry Revenue Million Forecast, by Application 2019 & 2032
- Table 67: Global Prebiotic Ingredients Industry Revenue Million Forecast, by Country 2019 & 2032
- Table 68: China Prebiotic Ingredients Industry Revenue (Million) Forecast, by Application 2019 & 2032
- Table 69: India Prebiotic Ingredients Industry Revenue (Million) Forecast, by Application 2019 & 2032
- Table 70: Australia Prebiotic Ingredients Industry Revenue (Million) Forecast, by Application 2019 & 2032
- Table 71: Japan Prebiotic Ingredients Industry Revenue (Million) Forecast, by Application 2019 & 2032
- Table 72: Rest of Asia Pacific Prebiotic Ingredients Industry Revenue (Million) Forecast, by Application 2019 & 2032
- Table 73: Global Prebiotic Ingredients Industry Revenue Million Forecast, by Type 2019 & 2032
- Table 74: Global Prebiotic Ingredients Industry Revenue Million Forecast, by Application 2019 & 2032
- Table 75: Global Prebiotic Ingredients Industry Revenue Million Forecast, by Country 2019 & 2032
- Table 76: Brazil Prebiotic Ingredients Industry Revenue (Million) Forecast, by Application 2019 & 2032
- Table 77: Rest of Latin America Prebiotic Ingredients Industry Revenue (Million) Forecast, by Application 2019 & 2032
Frequently Asked Questions
1. What is the projected Compound Annual Growth Rate (CAGR) of the Prebiotic Ingredients Industry?
The projected CAGR is approximately 9.71%.
2. Which companies are prominent players in the Prebiotic Ingredients Industry?
Key companies in the market include Tereos Group, Cosucra Groupe Warcoing, International Flavors & Fragrances Inc, Ingredion Inc, Roquette Freres, Archer Daniels Midland Company, Cooperatie Koninklijke Cosun U A (sensus Bv), Kerry Group, Cargill Inc, Süddeutsche Zuckerrübenverwertungs-Genossenschaft eG (Beneo).
3. What are the main segments of the Prebiotic Ingredients Industry?
The market segments include Type, Application.
4. Can you provide details about the market size?
The market size is estimated to be USD XX Million as of 2022.
5. What are some drivers contributing to market growth?
Growing consumer awareness of the importance of gut health and its impact on overall well-being.
6. What are the notable trends driving market growth?
Escalated Demand for Prebiotic Ingredients For Human and Animal Nutrition.
7. Are there any restraints impacting market growth?
Supply Chain Volatility and Availability Of Other Flavor Ingredients.
8. Can you provide examples of recent developments in the market?
November 2021: Archer Daniels Midland Company, a global leader in nutrition and agricultural origination and processing, announced a significant expansion of its broad portfolio of health and wellness products and solutions with an agreement to purchase US-based Deerland Probiotics, Prebiotics, and Enzymes.
9. What pricing options are available for accessing the report?
Pricing options include single-user, multi-user, and enterprise licenses priced at USD 4750, USD 5250, and USD 8750 respectively.
10. Is the market size provided in terms of value or volume?
The market size is provided in terms of value, measured in Million.
11. Are there any specific market keywords associated with the report?
Yes, the market keyword associated with the report is "Prebiotic Ingredients Industry," which aids in identifying and referencing the specific market segment covered.
12. How do I determine which pricing option suits my needs best?
The pricing options vary based on user requirements and access needs. Individual users may opt for single-user licenses, while businesses requiring broader access may choose multi-user or enterprise licenses for cost-effective access to the report.
13. Are there any additional resources or data provided in the Prebiotic Ingredients Industry report?
While the report offers comprehensive insights, it's advisable to review the specific contents or supplementary materials provided to ascertain if additional resources or data are available.
14. How can I stay updated on further developments or reports in the Prebiotic Ingredients Industry?
To stay informed about further developments, trends, and reports in the Prebiotic Ingredients Industry, consider subscribing to industry newsletters, following relevant companies and organizations, or regularly checking reputable industry news sources and publications.
Methodology
Step 1 - Identification of Relevant Samples Size from Population Database


Step 2 - Approaches for Defining Global Market Size (Value, Volume* & Price*)

Note*: In applicable scenarios
Step 3 - Data Sources
Primary Research
- Web Analytics
- Survey Reports
- Research Institute
- Latest Research Reports
- Opinion Leaders
Secondary Research
- Annual Reports
- White Paper
- Latest Press Release
- Industry Association
- Paid Database
- Investor Presentations

Step 4 - Data Triangulation
Involves using different sources of information in order to increase the validity of a study
These sources are likely to be stakeholders in a program - participants, other researchers, program staff, other community members, and so on.
Then we put all data in single framework & apply various statistical tools to find out the dynamic on the market.
During the analysis stage, feedback from the stakeholder groups would be compared to determine areas of agreement as well as areas of divergence


