
Key Insights
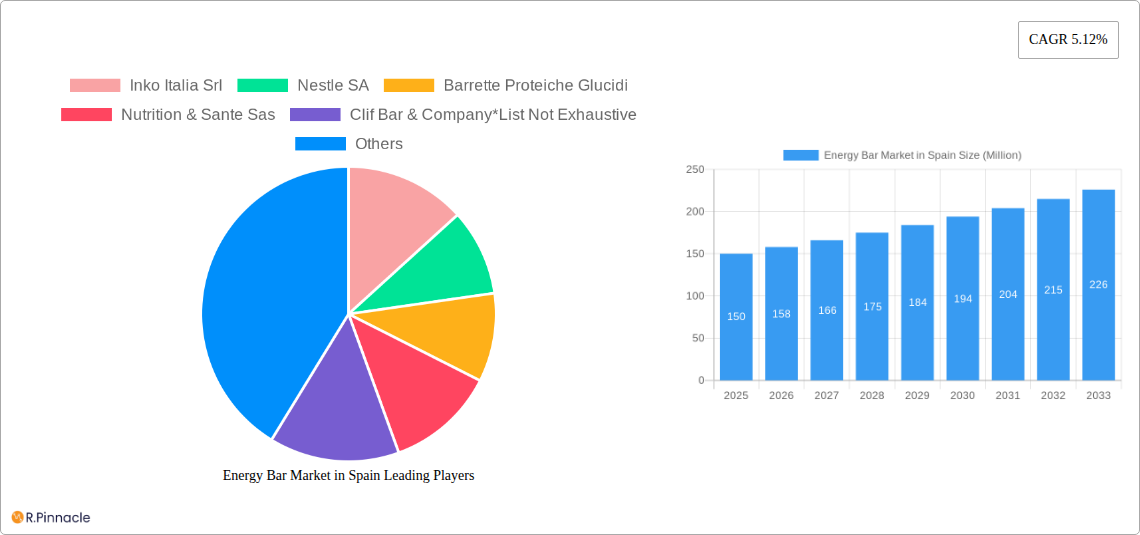
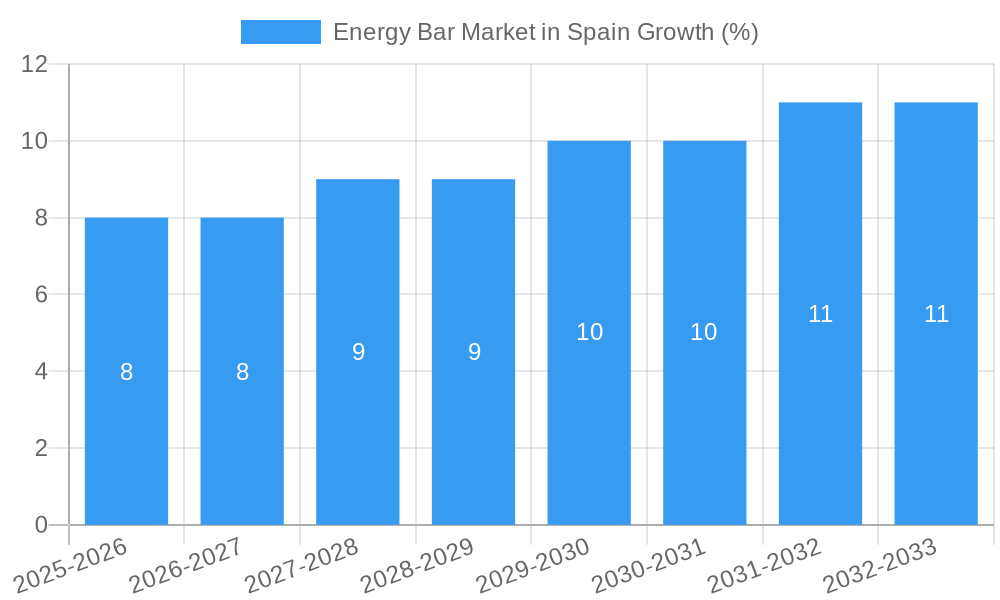
The Spanish energy bar market, valued at approximately €150 million in 2025, is projected to experience steady growth, exhibiting a Compound Annual Growth Rate (CAGR) of 5.12% from 2025 to 2033. This growth is fueled by several key factors. The increasing awareness of health and wellness amongst Spanish consumers is driving demand for convenient, nutritious snack options, with energy bars fitting this profile perfectly. The rising popularity of fitness and sports activities further contributes to this trend, as energy bars provide a readily available source of sustained energy. Furthermore, the expansion of online retail channels offers increased accessibility and convenience, contributing to market expansion. The market is segmented by type (organic and conventional) and distribution channel (supermarkets/hypermarkets, convenience stores, specialist retailers, online retail, and other channels). Supermarkets and hypermarkets currently dominate the distribution landscape, but online retail is experiencing significant growth, driven by evolving consumer behavior. Key players like Nestle SA, Inko Italia Srl, and Clif Bar & Company are competing in this dynamic market, focusing on product innovation and brand building to capture market share.
The growth of the organic energy bar segment is expected to outpace that of the conventional segment, reflecting a broader shift towards healthier and more sustainably produced food products. However, pricing remains a key restraint, particularly for organic options. Competition is intense, with both established international brands and smaller, local producers vying for consumer attention. Future growth will depend on factors such as the evolving consumer preferences, economic conditions, and innovative product development. Maintaining competitive pricing while offering high-quality ingredients and appealing flavors will be crucial for success in this increasingly competitive market. The continued expansion of online retail and increasing penetration of e-commerce among health-conscious consumers are projected to offer strong growth opportunities in the coming years.
Energy Bar Market in Spain: A Comprehensive Market Report (2019-2033)
This in-depth report provides a comprehensive analysis of the Energy Bar market in Spain, offering invaluable insights for industry professionals, investors, and strategic decision-makers. The study covers the period from 2019 to 2033, with a focus on the current market dynamics (Base Year: 2025, Estimated Year: 2025, Forecast Period: 2025-2033, Historical Period: 2019-2024).
Keywords: Energy Bar Market, Spain, Market Size, Market Share, Market Growth, CAGR, Organic Energy Bars, Conventional Energy Bars, Supermarkets, Convenience Stores, Online Retail, Nestle, Inko Italia Srl, Enervit, Abbott, Market Analysis, Market Trends, Market Forecast.
Energy Bar Market in Spain Market Structure & Innovation Trends
This section analyzes the competitive landscape of the Spanish energy bar market, examining market concentration, key innovation drivers, regulatory frameworks, and prevalent M&A activities. We delve into the end-user demographics shaping demand and the impact of product substitutes.
Market Concentration: The Spanish energy bar market exhibits a moderately concentrated structure, with key players like Nestle SA and Inko Italia Srl holding significant market shares (xx%). Smaller players, such as Barrette Proteiche Glucidi and Nutrition & Sante Sas, collectively contribute xx% to market volume. Market share data for 2024 will be presented within the report.
Innovation Drivers: Growing consumer demand for healthier, functional foods fuels innovation. This is evident in the rise of organic and protein-rich energy bars, catering to health-conscious consumers. Technological advancements in ingredients and production methods also contribute to product diversification.
Regulatory Framework: Spanish regulations concerning food labeling, ingredients, and marketing significantly impact market dynamics. Compliance with EU food safety standards is paramount for all players.
Product Substitutes: Other convenient snack options like protein shakes, fruit, and nuts pose a competitive challenge to energy bars.
M&A Activities: The report analyzes recent merger and acquisition activities within the Spanish energy bar market (estimated total value for deals in 2019-2024 at xx Million). The impact of these activities on market consolidation and future growth projections is assessed. Further detail on specific deals and their financial impacts will be included within the full report.
Energy Bar Market in Spain Market Dynamics & Trends
This section provides a detailed examination of the market's growth trajectory, analyzing key drivers, technological advancements, evolving consumer preferences, and intense competitive dynamics.
The Spanish energy bar market is projected to experience robust growth during the forecast period (2025-2033), driven by rising health consciousness, increasing demand for convenient food options, and growing disposable incomes. The market's Compound Annual Growth Rate (CAGR) is estimated at xx% during this period. The rising prevalence of active lifestyles and participation in fitness activities are also key factors influencing market expansion. Furthermore, the increasing adoption of online retail channels is altering distribution patterns and enhancing accessibility for consumers, thus boosting market penetration rates from xx% in 2024 to a projected xx% by 2033. Technological advancements in formulation and packaging enhance shelf life and nutritional value, thus further increasing consumer adoption. However, intense competition from both established and emerging players poses a challenge. The report details the competitive strategies employed by each major player, including pricing, product differentiation, and marketing approaches.
Dominant Regions & Segments in Energy Bar Market in Spain
This section identifies the leading regions and segments within the Spanish energy bar market based on type (Organic, Conventional) and distribution channel (Supermarkets/Hypermarkets, Convenience Stores, Specialist Retailers, Online Retail, Other Distribution Channels).
By Type: The conventional energy bar segment currently holds the largest market share due to its wider availability and affordability. However, the organic energy bar segment is witnessing significant growth, driven by the increasing preference for natural and healthy food options.
By Distribution Channel: Supermarkets and hypermarkets remain the dominant distribution channel, owing to their extensive reach and established supply chains. However, the online retail segment is experiencing rapid expansion, facilitated by the growing e-commerce penetration and convenience offered to consumers. Growth in online sales is further driven by attractive promotional offers and discounts.
Regional Dominance: (Further details on specific regions and their drivers are provided within the full report, including analysis of economic factors and infrastructure influencing growth in different areas.)
Energy Bar Market in Spain Product Innovations
Recent innovations in the Spanish energy bar market encompass the development of new flavor profiles, enhanced nutritional compositions (including added protein, fiber, and vitamins), and improved packaging technologies to extend shelf life. These advancements cater to the evolving consumer demands for healthier, more convenient, and tastier options. The incorporation of functional ingredients, such as probiotics and adaptogens, represents another emerging trend aimed at improving energy bar functionality beyond basic nutrition. The increased usage of sustainable and eco-friendly packaging materials reflects the growing importance of environmental consciousness in the food industry.
Report Scope & Segmentation Analysis
This report comprehensively segments the Spanish energy bar market by Type (Organic, Conventional) and Distribution Channel (Supermarkets/Hypermarkets, Convenience Stores, Specialist Retailers, Online Retail, Other Distribution Channels). Each segment's growth projections, market size estimations, and competitive dynamics are thoroughly examined. Organic energy bars, while currently representing a smaller market share than conventional bars, showcase a faster growth rate, reflecting the escalating consumer demand for healthier products. Distribution channels demonstrate varied growth trajectories, with online retail exhibiting the most dynamic expansion. The report provides detailed market size estimates for each segment, presenting both historical and forecasted figures for the entire study period (2019-2033).
Key Drivers of Energy Bar Market in Spain Growth
Several factors are driving growth in the Spanish energy bar market, including the increasing prevalence of health-conscious lifestyles, the growing demand for on-the-go snack options, and rising disposable incomes. The expansion of the fitness and sports nutrition sector fuels this demand for convenient energy sources. Further driving growth is the increased awareness of the importance of balanced nutrition, resulting in a higher consumption of energy bars as part of a well-rounded diet. Government initiatives promoting healthy eating habits also play a significant role in market growth.
Challenges in the Energy Bar Market in Spain Sector
Challenges facing the Spanish energy bar market include intense competition, fluctuations in raw material prices, and evolving consumer preferences. Maintaining consistent product quality and innovation to address the continuously changing consumer demands is critical. Supply chain disruptions can impact production costs and availability, posing a risk to market stability. Maintaining brand loyalty in a competitive market necessitates targeted marketing strategies. The regulatory environment, particularly regarding food safety and labeling, also presents operational challenges.
Emerging Opportunities in Energy Bar Market in Spain
The Spanish energy bar market presents various emerging opportunities, such as the increasing demand for functional energy bars with added health benefits (e.g., immunity-boosting ingredients). Expanding into new product segments, like vegan or gluten-free energy bars, caters to diverse dietary needs and preferences. The development of sustainable and eco-friendly packaging to appeal to environmentally conscious consumers offers another avenue for growth. The utilization of new technologies to create enhanced formulations represents an additional area of promising development.
Leading Players in the Energy Bar Market in Spain Market
- Inko Italia Srl
- Nestle SA
- Barrette Proteiche Glucidi
- Nutrition & Sante Sas
- Clif Bar & Company
- Enervit
- Abbott
Key Developments in Energy Bar Market in Spain Industry
- 2022 Q3: Nestle SA launched a new line of organic energy bars.
- 2023 Q1: Inko Italia Srl partnered with a major retailer to expand distribution.
- 2024 Q2: New regulations on sugar content in energy bars were implemented.
- (Further details on key industry developments will be presented within the full report)
Future Outlook for Energy Bar Market in Spain Market
The future of the Spanish energy bar market looks bright, driven by continuous innovation, expanding consumer base, and increased focus on health and wellness. Strategic partnerships, technological advancements, and effective marketing initiatives will be key factors determining future growth trajectories. Further exploring emerging distribution channels, like specialized online platforms for fitness enthusiasts, should allow for significant growth opportunities. The expansion into new product segments will continue to be a key market driver.
Energy Bar Market in Spain Segmentation
-
1. Type
- 1.1. Organic
- 1.2. Conventional
-
2. Distribution Channel
- 2.1. Supermarkets/Hypermarkets
- 2.2. Convenience Stores
- 2.3. Specialist Retailers
- 2.4. Online Retail
- 2.5. Other Distribution Channels
Energy Bar Market in Spain Segmentation By Geography
-
1. North America
- 1.1. United States
- 1.2. Canada
- 1.3. Mexico
-
2. South America
- 2.1. Brazil
- 2.2. Argentina
- 2.3. Rest of South America
-
3. Europe
- 3.1. United Kingdom
- 3.2. Germany
- 3.3. France
- 3.4. Italy
- 3.5. Spain
- 3.6. Russia
- 3.7. Benelux
- 3.8. Nordics
- 3.9. Rest of Europe
-
4. Middle East & Africa
- 4.1. Turkey
- 4.2. Israel
- 4.3. GCC
- 4.4. North Africa
- 4.5. South Africa
- 4.6. Rest of Middle East & Africa
-
5. Asia Pacific
- 5.1. China
- 5.2. India
- 5.3. Japan
- 5.4. South Korea
- 5.5. ASEAN
- 5.6. Oceania
- 5.7. Rest of Asia Pacific
Energy Bar Market in Spain REPORT HIGHLIGHTS
| Aspects | Details |
|---|---|
| Study Period | 2019-2033 |
| Base Year | 2024 |
| Estimated Year | 2025 |
| Forecast Period | 2025-2033 |
| Historical Period | 2019-2024 |
| Growth Rate | CAGR of 5.12% from 2019-2033 |
| Segmentation |
|
Table of Contents
- 1. Introduction
- 1.1. Research Scope
- 1.2. Market Segmentation
- 1.3. Research Methodology
- 1.4. Definitions and Assumptions
- 2. Executive Summary
- 2.1. Introduction
- 3. Market Dynamics
- 3.1. Introduction
- 3.2. Market Drivers
- 3.2.1. Increasing Consumer Demand for Products with Low Environmental Impacts; Dedicated Policies and Government Efforts to Promote the use of Biotechnology
- 3.3. Market Restrains
- 3.3.1. Deteriorating Fertility of Agricultural Lands
- 3.4. Market Trends
- 3.4.1. Rising Healthy Snacking Trend
- 4. Market Factor Analysis
- 4.1. Porters Five Forces
- 4.2. Supply/Value Chain
- 4.3. PESTEL analysis
- 4.4. Market Entropy
- 4.5. Patent/Trademark Analysis
- 5. Global Energy Bar Market in Spain Analysis, Insights and Forecast, 2019-2031
- 5.1. Market Analysis, Insights and Forecast - by Type
- 5.1.1. Organic
- 5.1.2. Conventional
- 5.2. Market Analysis, Insights and Forecast - by Distribution Channel
- 5.2.1. Supermarkets/Hypermarkets
- 5.2.2. Convenience Stores
- 5.2.3. Specialist Retailers
- 5.2.4. Online Retail
- 5.2.5. Other Distribution Channels
- 5.3. Market Analysis, Insights and Forecast - by Region
- 5.3.1. North America
- 5.3.2. South America
- 5.3.3. Europe
- 5.3.4. Middle East & Africa
- 5.3.5. Asia Pacific
- 5.1. Market Analysis, Insights and Forecast - by Type
- 6. North America Energy Bar Market in Spain Analysis, Insights and Forecast, 2019-2031
- 6.1. Market Analysis, Insights and Forecast - by Type
- 6.1.1. Organic
- 6.1.2. Conventional
- 6.2. Market Analysis, Insights and Forecast - by Distribution Channel
- 6.2.1. Supermarkets/Hypermarkets
- 6.2.2. Convenience Stores
- 6.2.3. Specialist Retailers
- 6.2.4. Online Retail
- 6.2.5. Other Distribution Channels
- 6.1. Market Analysis, Insights and Forecast - by Type
- 7. South America Energy Bar Market in Spain Analysis, Insights and Forecast, 2019-2031
- 7.1. Market Analysis, Insights and Forecast - by Type
- 7.1.1. Organic
- 7.1.2. Conventional
- 7.2. Market Analysis, Insights and Forecast - by Distribution Channel
- 7.2.1. Supermarkets/Hypermarkets
- 7.2.2. Convenience Stores
- 7.2.3. Specialist Retailers
- 7.2.4. Online Retail
- 7.2.5. Other Distribution Channels
- 7.1. Market Analysis, Insights and Forecast - by Type
- 8. Europe Energy Bar Market in Spain Analysis, Insights and Forecast, 2019-2031
- 8.1. Market Analysis, Insights and Forecast - by Type
- 8.1.1. Organic
- 8.1.2. Conventional
- 8.2. Market Analysis, Insights and Forecast - by Distribution Channel
- 8.2.1. Supermarkets/Hypermarkets
- 8.2.2. Convenience Stores
- 8.2.3. Specialist Retailers
- 8.2.4. Online Retail
- 8.2.5. Other Distribution Channels
- 8.1. Market Analysis, Insights and Forecast - by Type
- 9. Middle East & Africa Energy Bar Market in Spain Analysis, Insights and Forecast, 2019-2031
- 9.1. Market Analysis, Insights and Forecast - by Type
- 9.1.1. Organic
- 9.1.2. Conventional
- 9.2. Market Analysis, Insights and Forecast - by Distribution Channel
- 9.2.1. Supermarkets/Hypermarkets
- 9.2.2. Convenience Stores
- 9.2.3. Specialist Retailers
- 9.2.4. Online Retail
- 9.2.5. Other Distribution Channels
- 9.1. Market Analysis, Insights and Forecast - by Type
- 10. Asia Pacific Energy Bar Market in Spain Analysis, Insights and Forecast, 2019-2031
- 10.1. Market Analysis, Insights and Forecast - by Type
- 10.1.1. Organic
- 10.1.2. Conventional
- 10.2. Market Analysis, Insights and Forecast - by Distribution Channel
- 10.2.1. Supermarkets/Hypermarkets
- 10.2.2. Convenience Stores
- 10.2.3. Specialist Retailers
- 10.2.4. Online Retail
- 10.2.5. Other Distribution Channels
- 10.1. Market Analysis, Insights and Forecast - by Type
- 11. Competitive Analysis
- 11.1. Global Market Share Analysis 2024
- 11.2. Company Profiles
- 11.2.1 Inko Italia Srl
- 11.2.1.1. Overview
- 11.2.1.2. Products
- 11.2.1.3. SWOT Analysis
- 11.2.1.4. Recent Developments
- 11.2.1.5. Financials (Based on Availability)
- 11.2.2 Nestle SA
- 11.2.2.1. Overview
- 11.2.2.2. Products
- 11.2.2.3. SWOT Analysis
- 11.2.2.4. Recent Developments
- 11.2.2.5. Financials (Based on Availability)
- 11.2.3 Barrette Proteiche Glucidi
- 11.2.3.1. Overview
- 11.2.3.2. Products
- 11.2.3.3. SWOT Analysis
- 11.2.3.4. Recent Developments
- 11.2.3.5. Financials (Based on Availability)
- 11.2.4 Nutrition & Sante Sas
- 11.2.4.1. Overview
- 11.2.4.2. Products
- 11.2.4.3. SWOT Analysis
- 11.2.4.4. Recent Developments
- 11.2.4.5. Financials (Based on Availability)
- 11.2.5 Clif Bar & Company*List Not Exhaustive
- 11.2.5.1. Overview
- 11.2.5.2. Products
- 11.2.5.3. SWOT Analysis
- 11.2.5.4. Recent Developments
- 11.2.5.5. Financials (Based on Availability)
- 11.2.6 Enervit
- 11.2.6.1. Overview
- 11.2.6.2. Products
- 11.2.6.3. SWOT Analysis
- 11.2.6.4. Recent Developments
- 11.2.6.5. Financials (Based on Availability)
- 11.2.7 Abbott
- 11.2.7.1. Overview
- 11.2.7.2. Products
- 11.2.7.3. SWOT Analysis
- 11.2.7.4. Recent Developments
- 11.2.7.5. Financials (Based on Availability)
- 11.2.1 Inko Italia Srl
List of Figures
- Figure 1: Global Energy Bar Market in Spain Revenue Breakdown (Million, %) by Region 2024 & 2032
- Figure 2: Spain Energy Bar Market in Spain Revenue (Million), by Country 2024 & 2032
- Figure 3: Spain Energy Bar Market in Spain Revenue Share (%), by Country 2024 & 2032
- Figure 4: North America Energy Bar Market in Spain Revenue (Million), by Type 2024 & 2032
- Figure 5: North America Energy Bar Market in Spain Revenue Share (%), by Type 2024 & 2032
- Figure 6: North America Energy Bar Market in Spain Revenue (Million), by Distribution Channel 2024 & 2032
- Figure 7: North America Energy Bar Market in Spain Revenue Share (%), by Distribution Channel 2024 & 2032
- Figure 8: North America Energy Bar Market in Spain Revenue (Million), by Country 2024 & 2032
- Figure 9: North America Energy Bar Market in Spain Revenue Share (%), by Country 2024 & 2032
- Figure 10: South America Energy Bar Market in Spain Revenue (Million), by Type 2024 & 2032
- Figure 11: South America Energy Bar Market in Spain Revenue Share (%), by Type 2024 & 2032
- Figure 12: South America Energy Bar Market in Spain Revenue (Million), by Distribution Channel 2024 & 2032
- Figure 13: South America Energy Bar Market in Spain Revenue Share (%), by Distribution Channel 2024 & 2032
- Figure 14: South America Energy Bar Market in Spain Revenue (Million), by Country 2024 & 2032
- Figure 15: South America Energy Bar Market in Spain Revenue Share (%), by Country 2024 & 2032
- Figure 16: Europe Energy Bar Market in Spain Revenue (Million), by Type 2024 & 2032
- Figure 17: Europe Energy Bar Market in Spain Revenue Share (%), by Type 2024 & 2032
- Figure 18: Europe Energy Bar Market in Spain Revenue (Million), by Distribution Channel 2024 & 2032
- Figure 19: Europe Energy Bar Market in Spain Revenue Share (%), by Distribution Channel 2024 & 2032
- Figure 20: Europe Energy Bar Market in Spain Revenue (Million), by Country 2024 & 2032
- Figure 21: Europe Energy Bar Market in Spain Revenue Share (%), by Country 2024 & 2032
- Figure 22: Middle East & Africa Energy Bar Market in Spain Revenue (Million), by Type 2024 & 2032
- Figure 23: Middle East & Africa Energy Bar Market in Spain Revenue Share (%), by Type 2024 & 2032
- Figure 24: Middle East & Africa Energy Bar Market in Spain Revenue (Million), by Distribution Channel 2024 & 2032
- Figure 25: Middle East & Africa Energy Bar Market in Spain Revenue Share (%), by Distribution Channel 2024 & 2032
- Figure 26: Middle East & Africa Energy Bar Market in Spain Revenue (Million), by Country 2024 & 2032
- Figure 27: Middle East & Africa Energy Bar Market in Spain Revenue Share (%), by Country 2024 & 2032
- Figure 28: Asia Pacific Energy Bar Market in Spain Revenue (Million), by Type 2024 & 2032
- Figure 29: Asia Pacific Energy Bar Market in Spain Revenue Share (%), by Type 2024 & 2032
- Figure 30: Asia Pacific Energy Bar Market in Spain Revenue (Million), by Distribution Channel 2024 & 2032
- Figure 31: Asia Pacific Energy Bar Market in Spain Revenue Share (%), by Distribution Channel 2024 & 2032
- Figure 32: Asia Pacific Energy Bar Market in Spain Revenue (Million), by Country 2024 & 2032
- Figure 33: Asia Pacific Energy Bar Market in Spain Revenue Share (%), by Country 2024 & 2032
List of Tables
- Table 1: Global Energy Bar Market in Spain Revenue Million Forecast, by Region 2019 & 2032
- Table 2: Global Energy Bar Market in Spain Revenue Million Forecast, by Type 2019 & 2032
- Table 3: Global Energy Bar Market in Spain Revenue Million Forecast, by Distribution Channel 2019 & 2032
- Table 4: Global Energy Bar Market in Spain Revenue Million Forecast, by Region 2019 & 2032
- Table 5: Global Energy Bar Market in Spain Revenue Million Forecast, by Country 2019 & 2032
- Table 6: Global Energy Bar Market in Spain Revenue Million Forecast, by Type 2019 & 2032
- Table 7: Global Energy Bar Market in Spain Revenue Million Forecast, by Distribution Channel 2019 & 2032
- Table 8: Global Energy Bar Market in Spain Revenue Million Forecast, by Country 2019 & 2032
- Table 9: United States Energy Bar Market in Spain Revenue (Million) Forecast, by Application 2019 & 2032
- Table 10: Canada Energy Bar Market in Spain Revenue (Million) Forecast, by Application 2019 & 2032
- Table 11: Mexico Energy Bar Market in Spain Revenue (Million) Forecast, by Application 2019 & 2032
- Table 12: Global Energy Bar Market in Spain Revenue Million Forecast, by Type 2019 & 2032
- Table 13: Global Energy Bar Market in Spain Revenue Million Forecast, by Distribution Channel 2019 & 2032
- Table 14: Global Energy Bar Market in Spain Revenue Million Forecast, by Country 2019 & 2032
- Table 15: Brazil Energy Bar Market in Spain Revenue (Million) Forecast, by Application 2019 & 2032
- Table 16: Argentina Energy Bar Market in Spain Revenue (Million) Forecast, by Application 2019 & 2032
- Table 17: Rest of South America Energy Bar Market in Spain Revenue (Million) Forecast, by Application 2019 & 2032
- Table 18: Global Energy Bar Market in Spain Revenue Million Forecast, by Type 2019 & 2032
- Table 19: Global Energy Bar Market in Spain Revenue Million Forecast, by Distribution Channel 2019 & 2032
- Table 20: Global Energy Bar Market in Spain Revenue Million Forecast, by Country 2019 & 2032
- Table 21: United Kingdom Energy Bar Market in Spain Revenue (Million) Forecast, by Application 2019 & 2032
- Table 22: Germany Energy Bar Market in Spain Revenue (Million) Forecast, by Application 2019 & 2032
- Table 23: France Energy Bar Market in Spain Revenue (Million) Forecast, by Application 2019 & 2032
- Table 24: Italy Energy Bar Market in Spain Revenue (Million) Forecast, by Application 2019 & 2032
- Table 25: Spain Energy Bar Market in Spain Revenue (Million) Forecast, by Application 2019 & 2032
- Table 26: Russia Energy Bar Market in Spain Revenue (Million) Forecast, by Application 2019 & 2032
- Table 27: Benelux Energy Bar Market in Spain Revenue (Million) Forecast, by Application 2019 & 2032
- Table 28: Nordics Energy Bar Market in Spain Revenue (Million) Forecast, by Application 2019 & 2032
- Table 29: Rest of Europe Energy Bar Market in Spain Revenue (Million) Forecast, by Application 2019 & 2032
- Table 30: Global Energy Bar Market in Spain Revenue Million Forecast, by Type 2019 & 2032
- Table 31: Global Energy Bar Market in Spain Revenue Million Forecast, by Distribution Channel 2019 & 2032
- Table 32: Global Energy Bar Market in Spain Revenue Million Forecast, by Country 2019 & 2032
- Table 33: Turkey Energy Bar Market in Spain Revenue (Million) Forecast, by Application 2019 & 2032
- Table 34: Israel Energy Bar Market in Spain Revenue (Million) Forecast, by Application 2019 & 2032
- Table 35: GCC Energy Bar Market in Spain Revenue (Million) Forecast, by Application 2019 & 2032
- Table 36: North Africa Energy Bar Market in Spain Revenue (Million) Forecast, by Application 2019 & 2032
- Table 37: South Africa Energy Bar Market in Spain Revenue (Million) Forecast, by Application 2019 & 2032
- Table 38: Rest of Middle East & Africa Energy Bar Market in Spain Revenue (Million) Forecast, by Application 2019 & 2032
- Table 39: Global Energy Bar Market in Spain Revenue Million Forecast, by Type 2019 & 2032
- Table 40: Global Energy Bar Market in Spain Revenue Million Forecast, by Distribution Channel 2019 & 2032
- Table 41: Global Energy Bar Market in Spain Revenue Million Forecast, by Country 2019 & 2032
- Table 42: China Energy Bar Market in Spain Revenue (Million) Forecast, by Application 2019 & 2032
- Table 43: India Energy Bar Market in Spain Revenue (Million) Forecast, by Application 2019 & 2032
- Table 44: Japan Energy Bar Market in Spain Revenue (Million) Forecast, by Application 2019 & 2032
- Table 45: South Korea Energy Bar Market in Spain Revenue (Million) Forecast, by Application 2019 & 2032
- Table 46: ASEAN Energy Bar Market in Spain Revenue (Million) Forecast, by Application 2019 & 2032
- Table 47: Oceania Energy Bar Market in Spain Revenue (Million) Forecast, by Application 2019 & 2032
- Table 48: Rest of Asia Pacific Energy Bar Market in Spain Revenue (Million) Forecast, by Application 2019 & 2032
Frequently Asked Questions
1. What is the projected Compound Annual Growth Rate (CAGR) of the Energy Bar Market in Spain?
The projected CAGR is approximately 5.12%.
2. Which companies are prominent players in the Energy Bar Market in Spain?
Key companies in the market include Inko Italia Srl, Nestle SA, Barrette Proteiche Glucidi, Nutrition & Sante Sas, Clif Bar & Company*List Not Exhaustive, Enervit, Abbott.
3. What are the main segments of the Energy Bar Market in Spain?
The market segments include Type, Distribution Channel.
4. Can you provide details about the market size?
The market size is estimated to be USD XX Million as of 2022.
5. What are some drivers contributing to market growth?
Increasing Consumer Demand for Products with Low Environmental Impacts; Dedicated Policies and Government Efforts to Promote the use of Biotechnology.
6. What are the notable trends driving market growth?
Rising Healthy Snacking Trend.
7. Are there any restraints impacting market growth?
Deteriorating Fertility of Agricultural Lands.
8. Can you provide examples of recent developments in the market?
N/A
9. What pricing options are available for accessing the report?
Pricing options include single-user, multi-user, and enterprise licenses priced at USD 3800, USD 4500, and USD 5800 respectively.
10. Is the market size provided in terms of value or volume?
The market size is provided in terms of value, measured in Million.
11. Are there any specific market keywords associated with the report?
Yes, the market keyword associated with the report is "Energy Bar Market in Spain," which aids in identifying and referencing the specific market segment covered.
12. How do I determine which pricing option suits my needs best?
The pricing options vary based on user requirements and access needs. Individual users may opt for single-user licenses, while businesses requiring broader access may choose multi-user or enterprise licenses for cost-effective access to the report.
13. Are there any additional resources or data provided in the Energy Bar Market in Spain report?
While the report offers comprehensive insights, it's advisable to review the specific contents or supplementary materials provided to ascertain if additional resources or data are available.
14. How can I stay updated on further developments or reports in the Energy Bar Market in Spain?
To stay informed about further developments, trends, and reports in the Energy Bar Market in Spain, consider subscribing to industry newsletters, following relevant companies and organizations, or regularly checking reputable industry news sources and publications.
Methodology
Step 1 - Identification of Relevant Samples Size from Population Database


Step 2 - Approaches for Defining Global Market Size (Value, Volume* & Price*)

Note*: In applicable scenarios
Step 3 - Data Sources
Primary Research
- Web Analytics
- Survey Reports
- Research Institute
- Latest Research Reports
- Opinion Leaders
Secondary Research
- Annual Reports
- White Paper
- Latest Press Release
- Industry Association
- Paid Database
- Investor Presentations

Step 4 - Data Triangulation
Involves using different sources of information in order to increase the validity of a study
These sources are likely to be stakeholders in a program - participants, other researchers, program staff, other community members, and so on.
Then we put all data in single framework & apply various statistical tools to find out the dynamic on the market.
During the analysis stage, feedback from the stakeholder groups would be compared to determine areas of agreement as well as areas of divergence


