
Key Insights
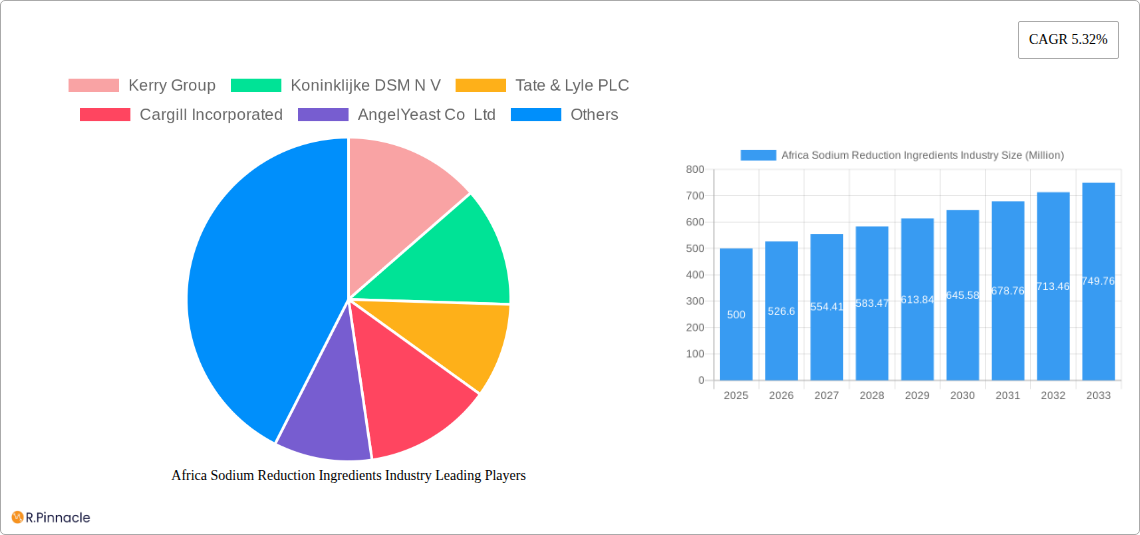
The Africa Sodium Reduction Ingredients market, valued at approximately $500 million in 2025, is projected to experience robust growth, driven by increasing awareness of the health risks associated with high sodium intake and the rising prevalence of hypertension across the continent. Governments are increasingly implementing policies to reduce sodium consumption, creating a favorable regulatory environment for sodium reduction ingredients. This is further fueled by a growing consumer preference for healthier food options and the expanding middle class with increased disposable income. Key market drivers include the growing demand for processed foods with reduced sodium content, the increasing popularity of health and wellness products, and the rising incidence of diet-related diseases. Leading players like Kerry Group, DSM, Tate & Lyle, Cargill, and Angel Yeast are actively investing in research and development to provide innovative sodium reduction solutions tailored to the African market, stimulating market competition and innovation. The market segmentation will likely be driven by ingredient type (e.g., potassium chloride, sea salt alternatives, yeast extracts), application (e.g., baked goods, meat products, processed snacks), and distribution channels (e.g., direct sales, distributors).
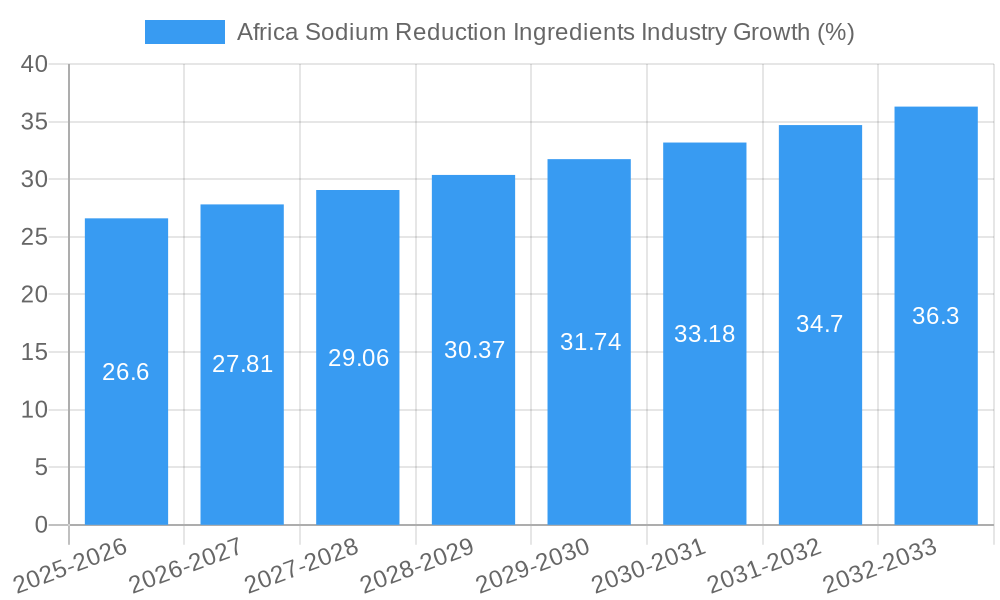
However, challenges remain. The market faces constraints such as the high cost of sodium reduction ingredients compared to conventional salt, limited consumer awareness in certain regions, and the potential for negative impacts on taste and texture in food products. Overcoming these hurdles requires focused education campaigns, collaboration between industry stakeholders and regulatory bodies, and the development of cost-effective and palatable sodium reduction solutions. The market's growth trajectory will heavily rely on addressing these challenges and adapting strategies to meet the diverse needs and preferences across various African nations. The market is expected to achieve a Compound Annual Growth Rate (CAGR) of 5.32% from 2025 to 2033, indicating a significant expansion over the forecast period.
Africa Sodium Reduction Ingredients Industry: Market Analysis & Future Outlook (2019-2033)
This comprehensive report provides a detailed analysis of the Africa Sodium Reduction Ingredients industry, offering invaluable insights for industry professionals, investors, and strategic decision-makers. The study period covers 2019-2033, with 2025 as the base and estimated year. The forecast period spans 2025-2033, and the historical period encompasses 2019-2024. The report leverages extensive market research, incorporating data on market size (in Millions), CAGR, and key industry trends.
Africa Sodium Reduction Ingredients Industry Market Structure & Innovation Trends
This section analyzes the competitive landscape, innovation drivers, and regulatory influences shaping the African sodium reduction ingredients market. We examine market concentration, identifying key players such as Kerry Group, Koninklijke DSM N.V., Tate & Lyle PLC, Cargill Incorporated, AngelYeast Co Ltd, and Givaudan (list not exhaustive). The report quantifies market share held by major players and explores the impact of mergers and acquisitions (M&A) activities, including estimated deal values (in Millions) where available. We also assess the influence of regulatory frameworks on product development and innovation, alongside analyzing the role of substitute products and evolving end-user demographics. The analysis includes an in-depth examination of innovative strategies adopted by key players in this dynamic market. For example, we'll examine the market share distribution among the top 5 players, the total M&A deal value over the historical period (xx Million), and the average deal size (xx Million).
Africa Sodium Reduction Ingredients Industry Market Dynamics & Trends
This section delves into the key factors driving market growth and shaping industry dynamics. We explore the Compound Annual Growth Rate (CAGR) for the forecast period (xx%), market penetration rates (xx%), and the impact of technological advancements on product development and consumer preferences. The competitive landscape analysis includes a detailed study of market strategies employed by key players and the evolving consumer demand for healthier food products, influenced by factors like rising health consciousness and increasing prevalence of diet-related diseases. The report also considers the influence of technological disruptions, such as advancements in ingredient formulation and processing techniques, on the market's trajectory.
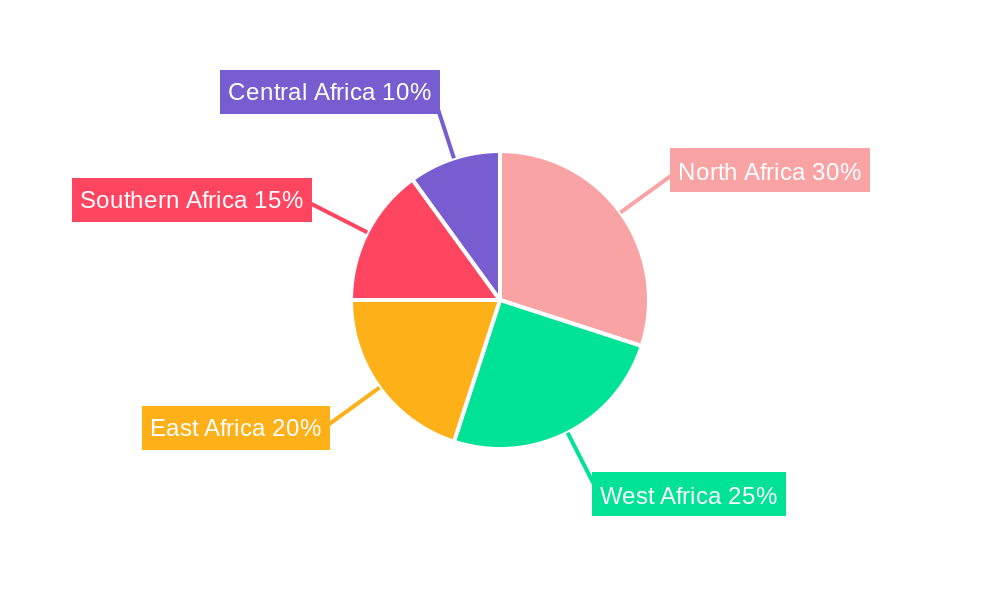
Dominant Regions & Segments in Africa Sodium Reduction Ingredients Industry
This section identifies the leading regions and segments within the African sodium reduction ingredients market. A detailed analysis pinpoints the dominant region/country (e.g., South Africa, Nigeria, etc.) and highlights contributing factors.
- Key Drivers:
- Supportive economic policies promoting healthy eating.
- Growing investments in food processing infrastructure.
- Increasing government regulations on sodium content in food products.
- Rising disposable incomes leading to increased demand for processed foods.
The dominance analysis examines the specific reasons behind the leading region's success, comparing its growth trajectory against other regions. Detailed regional breakdowns (xx Million) will be included.
Africa Sodium Reduction Ingredients Industry Product Innovations
This section summarizes recent product developments, focusing on applications, competitive advantages, and underlying technological trends. The analysis highlights how these innovations are improving market fit, addressing specific consumer needs, and enhancing the efficacy of sodium reduction strategies in food processing. Examples of new product launches and their market reception will be included.
Report Scope & Segmentation Analysis
This report provides a detailed segmentation analysis of the Africa Sodium Reduction Ingredients market. The detailed segments and sub-segments, their respective market sizes (in Millions), and growth projections for the forecast period will be provided. Competitive dynamics within each segment will be assessed.
Key Drivers of Africa Sodium Reduction Ingredients Industry Growth
This section identifies the key factors driving growth within the African sodium reduction ingredients market. These include technological advancements, favorable economic conditions, and supportive regulatory frameworks. Specific examples illustrating these drivers and their quantifiable impact will be provided. For example, the impact of government regulations aimed at lowering sodium intake on market growth will be analyzed.
Challenges in the Africa Sodium Reduction Ingredients Industry Sector
This section analyzes the challenges hindering market growth, including regulatory hurdles, supply chain complexities, and intense competition. The report assesses the quantifiable impact of these challenges on market expansion and provides insights into mitigation strategies.
Emerging Opportunities in Africa Sodium Reduction Ingredients Industry
This section highlights emerging trends and untapped opportunities within the African sodium reduction ingredients market. We explore new markets, technological advancements, and evolving consumer preferences that present potential growth avenues for industry players.
Leading Players in the Africa Sodium Reduction Ingredients Industry Market
- Kerry Group
- Koninklijke DSM N.V.
- Tate & Lyle PLC
- Cargill Incorporated
- AngelYeast Co Ltd
- Givaudan
- List Not Exhaustive
Key Developments in Africa Sodium Reduction Ingredients Industry
This section details significant industry developments, including product launches, mergers, and acquisitions, with specific dates (year/month). The impact of each development on market dynamics will be assessed.
Future Outlook for Africa Sodium Reduction Ingredients Industry Market
This section offers a concise summary of the future growth potential for the African sodium reduction ingredients market. The analysis identifies strategic opportunities and growth accelerators that will shape industry development over the forecast period (2025-2033).
Africa Sodium Reduction Ingredients Industry Segmentation
-
1. Product Type
- 1.1. Amino Acids and Glutamates
- 1.2. Mineral Salts
- 1.3. Yeast Extracts
- 1.4. Other Product Types
-
2. Application
- 2.1. Bakery and Confectionery
- 2.2. Condiments, Seasonings and Sauces
- 2.3. Dairy and Frozen Foods
- 2.4. Meat and Meat Products
- 2.5. Snacks
- 2.6. Others
-
3. Geography
- 3.1. South Africa
- 3.2. Nigeria
- 3.3. Algeria
- 3.4. Rest of Africa
Africa Sodium Reduction Ingredients Industry Segmentation By Geography
- 1. South Africa
- 2. Nigeria
- 3. Algeria
- 4. Rest of Africa
Africa Sodium Reduction Ingredients Industry REPORT HIGHLIGHTS
| Aspects | Details |
|---|---|
| Study Period | 2019-2033 |
| Base Year | 2024 |
| Estimated Year | 2025 |
| Forecast Period | 2025-2033 |
| Historical Period | 2019-2024 |
| Growth Rate | CAGR of 5.32% from 2019-2033 |
| Segmentation |
|
Table of Contents
- 1. Introduction
- 1.1. Research Scope
- 1.2. Market Segmentation
- 1.3. Research Methodology
- 1.4. Definitions and Assumptions
- 2. Executive Summary
- 2.1. Introduction
- 3. Market Dynamics
- 3.1. Introduction
- 3.2. Market Drivers
- 3.3. Market Restrains
- 3.4. Market Trends
- 3.4.1. Increased Utilization of Mineral Salts as Sodium Reduction Ingredients
- 4. Market Factor Analysis
- 4.1. Porters Five Forces
- 4.2. Supply/Value Chain
- 4.3. PESTEL analysis
- 4.4. Market Entropy
- 4.5. Patent/Trademark Analysis
- 5. Global Africa Sodium Reduction Ingredients Industry Analysis, Insights and Forecast, 2019-2031
- 5.1. Market Analysis, Insights and Forecast - by Product Type
- 5.1.1. Amino Acids and Glutamates
- 5.1.2. Mineral Salts
- 5.1.3. Yeast Extracts
- 5.1.4. Other Product Types
- 5.2. Market Analysis, Insights and Forecast - by Application
- 5.2.1. Bakery and Confectionery
- 5.2.2. Condiments, Seasonings and Sauces
- 5.2.3. Dairy and Frozen Foods
- 5.2.4. Meat and Meat Products
- 5.2.5. Snacks
- 5.2.6. Others
- 5.3. Market Analysis, Insights and Forecast - by Geography
- 5.3.1. South Africa
- 5.3.2. Nigeria
- 5.3.3. Algeria
- 5.3.4. Rest of Africa
- 5.4. Market Analysis, Insights and Forecast - by Region
- 5.4.1. South Africa
- 5.4.2. Nigeria
- 5.4.3. Algeria
- 5.4.4. Rest of Africa
- 5.1. Market Analysis, Insights and Forecast - by Product Type
- 6. South Africa Africa Sodium Reduction Ingredients Industry Analysis, Insights and Forecast, 2019-2031
- 6.1. Market Analysis, Insights and Forecast - by Product Type
- 6.1.1. Amino Acids and Glutamates
- 6.1.2. Mineral Salts
- 6.1.3. Yeast Extracts
- 6.1.4. Other Product Types
- 6.2. Market Analysis, Insights and Forecast - by Application
- 6.2.1. Bakery and Confectionery
- 6.2.2. Condiments, Seasonings and Sauces
- 6.2.3. Dairy and Frozen Foods
- 6.2.4. Meat and Meat Products
- 6.2.5. Snacks
- 6.2.6. Others
- 6.3. Market Analysis, Insights and Forecast - by Geography
- 6.3.1. South Africa
- 6.3.2. Nigeria
- 6.3.3. Algeria
- 6.3.4. Rest of Africa
- 6.1. Market Analysis, Insights and Forecast - by Product Type
- 7. Nigeria Africa Sodium Reduction Ingredients Industry Analysis, Insights and Forecast, 2019-2031
- 7.1. Market Analysis, Insights and Forecast - by Product Type
- 7.1.1. Amino Acids and Glutamates
- 7.1.2. Mineral Salts
- 7.1.3. Yeast Extracts
- 7.1.4. Other Product Types
- 7.2. Market Analysis, Insights and Forecast - by Application
- 7.2.1. Bakery and Confectionery
- 7.2.2. Condiments, Seasonings and Sauces
- 7.2.3. Dairy and Frozen Foods
- 7.2.4. Meat and Meat Products
- 7.2.5. Snacks
- 7.2.6. Others
- 7.3. Market Analysis, Insights and Forecast - by Geography
- 7.3.1. South Africa
- 7.3.2. Nigeria
- 7.3.3. Algeria
- 7.3.4. Rest of Africa
- 7.1. Market Analysis, Insights and Forecast - by Product Type
- 8. Algeria Africa Sodium Reduction Ingredients Industry Analysis, Insights and Forecast, 2019-2031
- 8.1. Market Analysis, Insights and Forecast - by Product Type
- 8.1.1. Amino Acids and Glutamates
- 8.1.2. Mineral Salts
- 8.1.3. Yeast Extracts
- 8.1.4. Other Product Types
- 8.2. Market Analysis, Insights and Forecast - by Application
- 8.2.1. Bakery and Confectionery
- 8.2.2. Condiments, Seasonings and Sauces
- 8.2.3. Dairy and Frozen Foods
- 8.2.4. Meat and Meat Products
- 8.2.5. Snacks
- 8.2.6. Others
- 8.3. Market Analysis, Insights and Forecast - by Geography
- 8.3.1. South Africa
- 8.3.2. Nigeria
- 8.3.3. Algeria
- 8.3.4. Rest of Africa
- 8.1. Market Analysis, Insights and Forecast - by Product Type
- 9. Rest of Africa Africa Sodium Reduction Ingredients Industry Analysis, Insights and Forecast, 2019-2031
- 9.1. Market Analysis, Insights and Forecast - by Product Type
- 9.1.1. Amino Acids and Glutamates
- 9.1.2. Mineral Salts
- 9.1.3. Yeast Extracts
- 9.1.4. Other Product Types
- 9.2. Market Analysis, Insights and Forecast - by Application
- 9.2.1. Bakery and Confectionery
- 9.2.2. Condiments, Seasonings and Sauces
- 9.2.3. Dairy and Frozen Foods
- 9.2.4. Meat and Meat Products
- 9.2.5. Snacks
- 9.2.6. Others
- 9.3. Market Analysis, Insights and Forecast - by Geography
- 9.3.1. South Africa
- 9.3.2. Nigeria
- 9.3.3. Algeria
- 9.3.4. Rest of Africa
- 9.1. Market Analysis, Insights and Forecast - by Product Type
- 10. Competitive Analysis
- 10.1. Global Market Share Analysis 2024
- 10.2. Company Profiles
- 10.2.1 Kerry Group
- 10.2.1.1. Overview
- 10.2.1.2. Products
- 10.2.1.3. SWOT Analysis
- 10.2.1.4. Recent Developments
- 10.2.1.5. Financials (Based on Availability)
- 10.2.2 Koninklijke DSM N V
- 10.2.2.1. Overview
- 10.2.2.2. Products
- 10.2.2.3. SWOT Analysis
- 10.2.2.4. Recent Developments
- 10.2.2.5. Financials (Based on Availability)
- 10.2.3 Tate & Lyle PLC
- 10.2.3.1. Overview
- 10.2.3.2. Products
- 10.2.3.3. SWOT Analysis
- 10.2.3.4. Recent Developments
- 10.2.3.5. Financials (Based on Availability)
- 10.2.4 Cargill Incorporated
- 10.2.4.1. Overview
- 10.2.4.2. Products
- 10.2.4.3. SWOT Analysis
- 10.2.4.4. Recent Developments
- 10.2.4.5. Financials (Based on Availability)
- 10.2.5 AngelYeast Co Ltd
- 10.2.5.1. Overview
- 10.2.5.2. Products
- 10.2.5.3. SWOT Analysis
- 10.2.5.4. Recent Developments
- 10.2.5.5. Financials (Based on Availability)
- 10.2.6 Givaudan*List Not Exhaustive
- 10.2.6.1. Overview
- 10.2.6.2. Products
- 10.2.6.3. SWOT Analysis
- 10.2.6.4. Recent Developments
- 10.2.6.5. Financials (Based on Availability)
- 10.2.1 Kerry Group
List of Figures
- Figure 1: Global Africa Sodium Reduction Ingredients Industry Revenue Breakdown (Million, %) by Region 2024 & 2032
- Figure 2: South Africa Africa Sodium Reduction Ingredients Industry Revenue (Million), by Product Type 2024 & 2032
- Figure 3: South Africa Africa Sodium Reduction Ingredients Industry Revenue Share (%), by Product Type 2024 & 2032
- Figure 4: South Africa Africa Sodium Reduction Ingredients Industry Revenue (Million), by Application 2024 & 2032
- Figure 5: South Africa Africa Sodium Reduction Ingredients Industry Revenue Share (%), by Application 2024 & 2032
- Figure 6: South Africa Africa Sodium Reduction Ingredients Industry Revenue (Million), by Geography 2024 & 2032
- Figure 7: South Africa Africa Sodium Reduction Ingredients Industry Revenue Share (%), by Geography 2024 & 2032
- Figure 8: South Africa Africa Sodium Reduction Ingredients Industry Revenue (Million), by Country 2024 & 2032
- Figure 9: South Africa Africa Sodium Reduction Ingredients Industry Revenue Share (%), by Country 2024 & 2032
- Figure 10: Nigeria Africa Sodium Reduction Ingredients Industry Revenue (Million), by Product Type 2024 & 2032
- Figure 11: Nigeria Africa Sodium Reduction Ingredients Industry Revenue Share (%), by Product Type 2024 & 2032
- Figure 12: Nigeria Africa Sodium Reduction Ingredients Industry Revenue (Million), by Application 2024 & 2032
- Figure 13: Nigeria Africa Sodium Reduction Ingredients Industry Revenue Share (%), by Application 2024 & 2032
- Figure 14: Nigeria Africa Sodium Reduction Ingredients Industry Revenue (Million), by Geography 2024 & 2032
- Figure 15: Nigeria Africa Sodium Reduction Ingredients Industry Revenue Share (%), by Geography 2024 & 2032
- Figure 16: Nigeria Africa Sodium Reduction Ingredients Industry Revenue (Million), by Country 2024 & 2032
- Figure 17: Nigeria Africa Sodium Reduction Ingredients Industry Revenue Share (%), by Country 2024 & 2032
- Figure 18: Algeria Africa Sodium Reduction Ingredients Industry Revenue (Million), by Product Type 2024 & 2032
- Figure 19: Algeria Africa Sodium Reduction Ingredients Industry Revenue Share (%), by Product Type 2024 & 2032
- Figure 20: Algeria Africa Sodium Reduction Ingredients Industry Revenue (Million), by Application 2024 & 2032
- Figure 21: Algeria Africa Sodium Reduction Ingredients Industry Revenue Share (%), by Application 2024 & 2032
- Figure 22: Algeria Africa Sodium Reduction Ingredients Industry Revenue (Million), by Geography 2024 & 2032
- Figure 23: Algeria Africa Sodium Reduction Ingredients Industry Revenue Share (%), by Geography 2024 & 2032
- Figure 24: Algeria Africa Sodium Reduction Ingredients Industry Revenue (Million), by Country 2024 & 2032
- Figure 25: Algeria Africa Sodium Reduction Ingredients Industry Revenue Share (%), by Country 2024 & 2032
- Figure 26: Rest of Africa Africa Sodium Reduction Ingredients Industry Revenue (Million), by Product Type 2024 & 2032
- Figure 27: Rest of Africa Africa Sodium Reduction Ingredients Industry Revenue Share (%), by Product Type 2024 & 2032
- Figure 28: Rest of Africa Africa Sodium Reduction Ingredients Industry Revenue (Million), by Application 2024 & 2032
- Figure 29: Rest of Africa Africa Sodium Reduction Ingredients Industry Revenue Share (%), by Application 2024 & 2032
- Figure 30: Rest of Africa Africa Sodium Reduction Ingredients Industry Revenue (Million), by Geography 2024 & 2032
- Figure 31: Rest of Africa Africa Sodium Reduction Ingredients Industry Revenue Share (%), by Geography 2024 & 2032
- Figure 32: Rest of Africa Africa Sodium Reduction Ingredients Industry Revenue (Million), by Country 2024 & 2032
- Figure 33: Rest of Africa Africa Sodium Reduction Ingredients Industry Revenue Share (%), by Country 2024 & 2032
List of Tables
- Table 1: Global Africa Sodium Reduction Ingredients Industry Revenue Million Forecast, by Region 2019 & 2032
- Table 2: Global Africa Sodium Reduction Ingredients Industry Revenue Million Forecast, by Product Type 2019 & 2032
- Table 3: Global Africa Sodium Reduction Ingredients Industry Revenue Million Forecast, by Application 2019 & 2032
- Table 4: Global Africa Sodium Reduction Ingredients Industry Revenue Million Forecast, by Geography 2019 & 2032
- Table 5: Global Africa Sodium Reduction Ingredients Industry Revenue Million Forecast, by Region 2019 & 2032
- Table 6: Global Africa Sodium Reduction Ingredients Industry Revenue Million Forecast, by Product Type 2019 & 2032
- Table 7: Global Africa Sodium Reduction Ingredients Industry Revenue Million Forecast, by Application 2019 & 2032
- Table 8: Global Africa Sodium Reduction Ingredients Industry Revenue Million Forecast, by Geography 2019 & 2032
- Table 9: Global Africa Sodium Reduction Ingredients Industry Revenue Million Forecast, by Country 2019 & 2032
- Table 10: Global Africa Sodium Reduction Ingredients Industry Revenue Million Forecast, by Product Type 2019 & 2032
- Table 11: Global Africa Sodium Reduction Ingredients Industry Revenue Million Forecast, by Application 2019 & 2032
- Table 12: Global Africa Sodium Reduction Ingredients Industry Revenue Million Forecast, by Geography 2019 & 2032
- Table 13: Global Africa Sodium Reduction Ingredients Industry Revenue Million Forecast, by Country 2019 & 2032
- Table 14: Global Africa Sodium Reduction Ingredients Industry Revenue Million Forecast, by Product Type 2019 & 2032
- Table 15: Global Africa Sodium Reduction Ingredients Industry Revenue Million Forecast, by Application 2019 & 2032
- Table 16: Global Africa Sodium Reduction Ingredients Industry Revenue Million Forecast, by Geography 2019 & 2032
- Table 17: Global Africa Sodium Reduction Ingredients Industry Revenue Million Forecast, by Country 2019 & 2032
- Table 18: Global Africa Sodium Reduction Ingredients Industry Revenue Million Forecast, by Product Type 2019 & 2032
- Table 19: Global Africa Sodium Reduction Ingredients Industry Revenue Million Forecast, by Application 2019 & 2032
- Table 20: Global Africa Sodium Reduction Ingredients Industry Revenue Million Forecast, by Geography 2019 & 2032
- Table 21: Global Africa Sodium Reduction Ingredients Industry Revenue Million Forecast, by Country 2019 & 2032
Frequently Asked Questions
1. What is the projected Compound Annual Growth Rate (CAGR) of the Africa Sodium Reduction Ingredients Industry?
The projected CAGR is approximately 5.32%.
2. Which companies are prominent players in the Africa Sodium Reduction Ingredients Industry?
Key companies in the market include Kerry Group, Koninklijke DSM N V, Tate & Lyle PLC, Cargill Incorporated, AngelYeast Co Ltd, Givaudan*List Not Exhaustive.
3. What are the main segments of the Africa Sodium Reduction Ingredients Industry?
The market segments include Product Type, Application, Geography.
4. Can you provide details about the market size?
The market size is estimated to be USD XX Million as of 2022.
5. What are some drivers contributing to market growth?
N/A
6. What are the notable trends driving market growth?
Increased Utilization of Mineral Salts as Sodium Reduction Ingredients.
7. Are there any restraints impacting market growth?
N/A
8. Can you provide examples of recent developments in the market?
N/A
9. What pricing options are available for accessing the report?
Pricing options include single-user, multi-user, and enterprise licenses priced at USD 4750, USD 5250, and USD 8750 respectively.
10. Is the market size provided in terms of value or volume?
The market size is provided in terms of value, measured in Million.
11. Are there any specific market keywords associated with the report?
Yes, the market keyword associated with the report is "Africa Sodium Reduction Ingredients Industry," which aids in identifying and referencing the specific market segment covered.
12. How do I determine which pricing option suits my needs best?
The pricing options vary based on user requirements and access needs. Individual users may opt for single-user licenses, while businesses requiring broader access may choose multi-user or enterprise licenses for cost-effective access to the report.
13. Are there any additional resources or data provided in the Africa Sodium Reduction Ingredients Industry report?
While the report offers comprehensive insights, it's advisable to review the specific contents or supplementary materials provided to ascertain if additional resources or data are available.
14. How can I stay updated on further developments or reports in the Africa Sodium Reduction Ingredients Industry?
To stay informed about further developments, trends, and reports in the Africa Sodium Reduction Ingredients Industry, consider subscribing to industry newsletters, following relevant companies and organizations, or regularly checking reputable industry news sources and publications.
Methodology
Step 1 - Identification of Relevant Samples Size from Population Database


Step 2 - Approaches for Defining Global Market Size (Value, Volume* & Price*)

Note*: In applicable scenarios
Step 3 - Data Sources
Primary Research
- Web Analytics
- Survey Reports
- Research Institute
- Latest Research Reports
- Opinion Leaders
Secondary Research
- Annual Reports
- White Paper
- Latest Press Release
- Industry Association
- Paid Database
- Investor Presentations

Step 4 - Data Triangulation
Involves using different sources of information in order to increase the validity of a study
These sources are likely to be stakeholders in a program - participants, other researchers, program staff, other community members, and so on.
Then we put all data in single framework & apply various statistical tools to find out the dynamic on the market.
During the analysis stage, feedback from the stakeholder groups would be compared to determine areas of agreement as well as areas of divergence


