
Key Insights
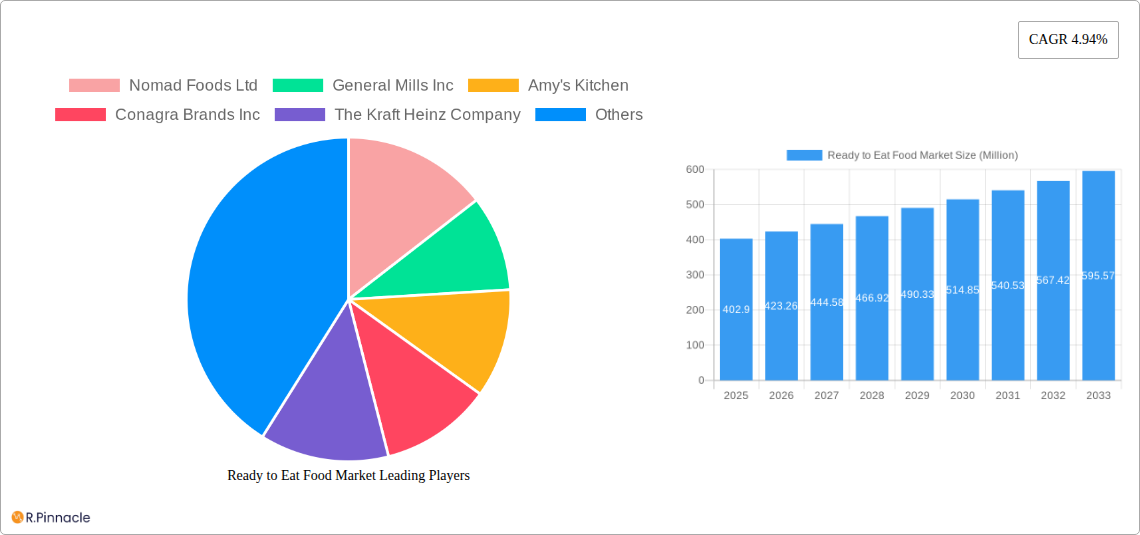
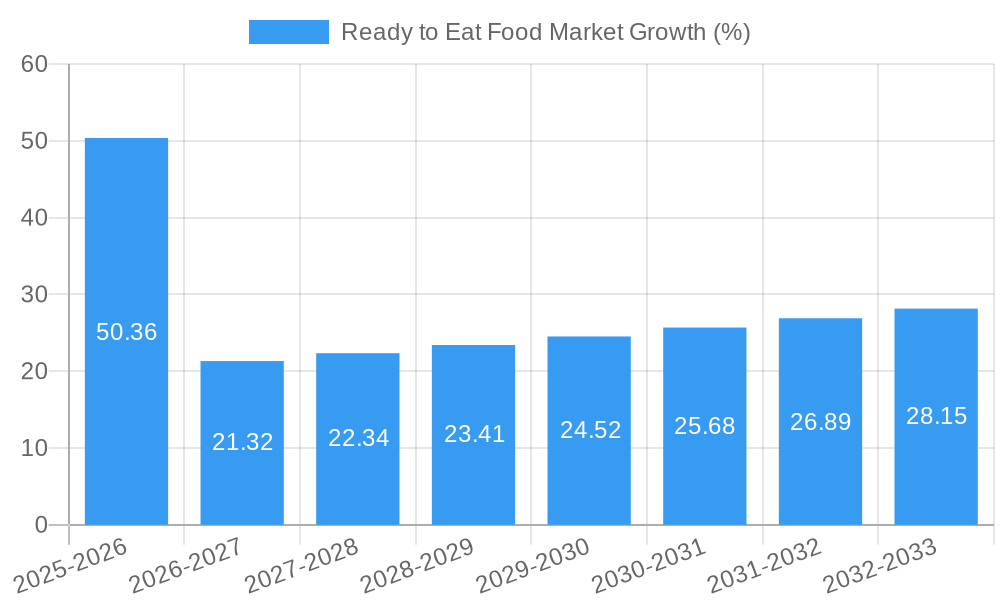
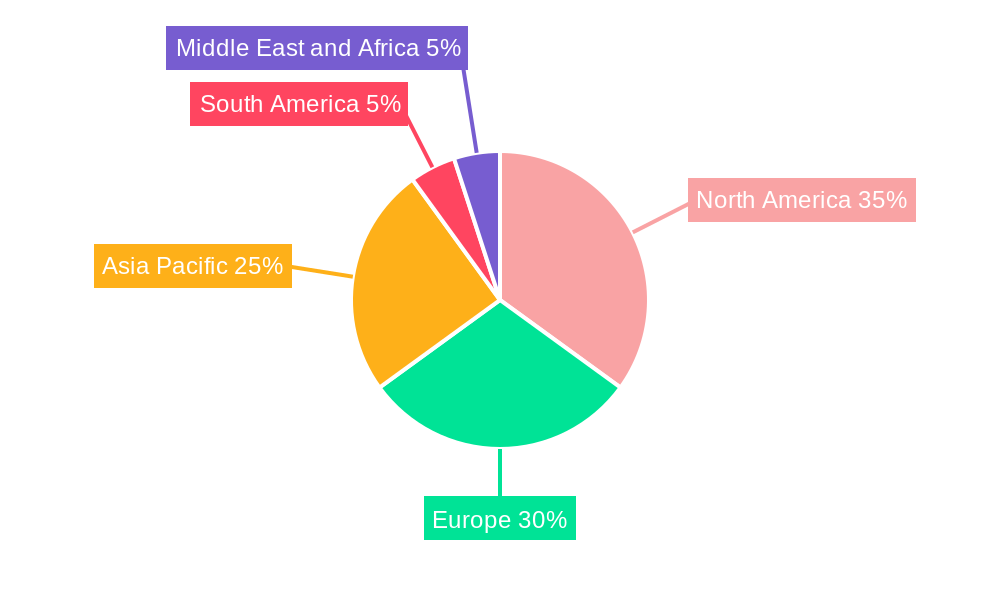
The ready-to-eat (RTE) food market, valued at $402.90 million in 2025, is projected to experience robust growth, driven by evolving consumer lifestyles and increasing demand for convenience. The market's Compound Annual Growth Rate (CAGR) of 4.94% from 2019 to 2024 suggests a continued upward trajectory through 2033. Key drivers include the rising prevalence of busy lifestyles, increased disposable incomes in developing economies, and the growing popularity of health-conscious RTE options. The market is segmented by product type (instant breakfast/cereals, instant soups and snacks, ready meals, baked goods, meat products, and others) and distribution channels (hypermarkets/supermarkets, convenience stores, online retail stores, and others). The dominance of specific product categories and distribution channels will likely shift as consumer preferences evolve and technological advancements in food processing and online retail continue. Hypermarkets and supermarkets currently hold a significant market share, though online retail is expected to show substantial growth, driven by e-commerce penetration and the increasing adoption of online grocery shopping. Leading companies like Nestlé, General Mills, and Conagra Brands are strategically investing in product innovation and expanding their distribution networks to capture a larger share of this expanding market. Regional variations are expected, with North America and Europe continuing to be major markets due to established consumer preferences and higher disposable incomes. However, the Asia-Pacific region is poised for considerable expansion, given its substantial population growth and rising middle class.
Growth in the RTE food market is further fueled by several trends. The increasing preference for healthier and more nutritious options is creating demand for RTE foods with low sodium, low sugar, and organic ingredients. Sustainability concerns are also impacting purchasing decisions; consumers increasingly favor brands committed to eco-friendly packaging and responsible sourcing. Simultaneously, innovation in food technology is driving the creation of novel RTE products, expanding the range of flavors, formats, and functionalities available to consumers. While rising raw material costs and stringent regulatory requirements pose some challenges, the overall market outlook for RTE foods remains positive, driven by its inherent convenience and adaptability to consumer demands. The projected growth is expected to be influenced by global economic conditions and shifting consumer preferences, requiring ongoing adaptation from industry players.
Ready to Eat Food Market Report: 2019-2033
This comprehensive report provides a detailed analysis of the Ready to Eat Food Market, offering invaluable insights for industry professionals and strategic decision-makers. With a study period spanning 2019-2033, a base year of 2025, and a forecast period of 2025-2033, this report leverages historical data (2019-2024) to project future market trends and opportunities. The market is valued at xx Million in 2025 and is projected to reach xx Million by 2033, exhibiting a CAGR of xx%.
Ready to Eat Food Market Structure & Innovation Trends
This section analyzes the competitive landscape, innovation drivers, and regulatory influences shaping the Ready to Eat Food market. We examine market concentration, highlighting the leading players such as Nomad Foods Ltd, General Mills Inc, Amy's Kitchen, Conagra Brands Inc, The Kraft Heinz Company, McCain Foods Limited, Campbell Soup Company, Premier Foods Group Limited, Dr August Oetker Nahrungsmittel KG, and Nestlé S A, and their respective market shares. The report also explores the impact of mergers and acquisitions (M&A) activities, including deal values and their implications on market dynamics. For example, the September 2022 acquisition of Scelta Products by McCain Foods significantly strengthened their position in the frozen appetizer segment. The analysis considers factors like regulatory frameworks impacting food safety and labeling, the presence of substitute products, end-user demographics and their evolving preferences, and innovation drivers such as the growing demand for convenience and healthier options. Expected M&A deal values are projected to reach xx Million over the forecast period. The report further explores innovation trends across various product segments, analyzing the introduction of new technologies and processes impacting product development and market penetration.
Ready to Eat Food Market Dynamics & Trends
This section delves into the key factors driving market growth, technological disruptions, evolving consumer preferences, and competitive dynamics within the Ready to Eat Food market. We examine the increasing demand for convenience foods, fueled by changing lifestyles and busy schedules. The impact of technological advancements, such as automation in food processing and improved packaging solutions, is also analyzed. We explore consumer preferences for healthier options, including organic and plant-based products, along with the growing demand for personalized and customized meal solutions. The report assesses competitive dynamics, focusing on strategies adopted by leading players, including product diversification, brand building, and strategic partnerships. Detailed analysis of market penetration rates across different segments and regions is provided, along with a projection of the compound annual growth rate (CAGR).
Dominant Regions & Segments in Ready to Eat Food Market
This section identifies the leading regions and segments within the Ready to Eat Food market. We analyze regional dominance based on factors such as economic growth, consumer spending patterns, and infrastructure development. The key segments analyzed include:
Product Type:
- Instant Breakfast/Cereals
- Instant Soups and Snacks
- Ready Meals
- Baked Goods
- Meat Products
- Other Product Types
Distribution Channel:
- Hypermarkets/Supermarkets
- Convenience Stores
- Online Retail Stores
- Other Distribution Channels
For each segment, we provide a detailed analysis of its market size, growth drivers, and competitive dynamics. We identify the dominant regions and countries within each segment, highlighting the specific factors driving their success. For example, the growth of online retail channels is particularly strong in developed countries with robust e-commerce infrastructure and high internet penetration. The report further explores the impact of government policies and regulations on market growth within different regions.
Ready to Eat Food Market Product Innovations
Recent years have witnessed significant product innovation in the Ready to Eat Food market. Key trends include the development of healthier and more convenient options, the increasing use of plant-based ingredients, and the integration of technology for enhanced food safety and traceability. Companies are leveraging technological advancements to create innovative products that meet changing consumer demands. The introduction of ready-to-eat vegan meals, for example, reflects a growing market trend and consumer preference. These innovations are enhancing the market fit of ready-to-eat products, driving sales and expanding the market reach.
Report Scope & Segmentation Analysis
This report segments the Ready to Eat Food market by product type (Instant Breakfast/Cereals, Instant Soups and Snacks, Ready Meals, Baked Goods, Meat Products, Other Product Types) and distribution channel (Hypermarkets/Supermarkets, Convenience Stores, Online Retail Stores, Other Distribution Channels). Each segment's growth projections, market sizes, and competitive dynamics are analyzed. The report provides detailed insights into the market share of key players within each segment, as well as their strategic initiatives. For example, the ready meals segment is experiencing robust growth, driven by the increasing demand for convenient and healthy meal options.
Key Drivers of Ready to Eat Food Market Growth
Several key factors are driving the growth of the Ready to Eat Food market. The increasing prevalence of busy lifestyles and the demand for convenience are primary drivers. Technological advancements in food processing and packaging are also contributing to market expansion. Furthermore, favorable economic conditions in several regions, along with supportive government regulations, are boosting market growth. Changes in consumer preferences towards healthier and more diverse food options further contribute to the expansion of this market.
Challenges in the Ready to Eat Food Market Sector
The Ready to Eat Food market faces several challenges, including stringent regulatory requirements impacting food safety and labeling, which increase production costs. Supply chain disruptions and fluctuations in raw material prices pose significant risks. Furthermore, intense competition among established players and the emergence of new entrants exert pressure on margins and market share. These challenges are impacting the overall profitability and growth potential of the market.
Emerging Opportunities in Ready to Eat Food Market
Several emerging opportunities exist within the Ready to Eat Food market. The growing demand for personalized and customized meal solutions presents a significant opportunity for companies to cater to niche consumer segments. The expansion of e-commerce channels provides new avenues for distribution and market reach. The increasing focus on sustainability and environmentally friendly practices opens doors for companies to develop innovative products and processes. The exploration of new markets and regions with high growth potential also presents substantial opportunities for expansion and revenue generation.
Leading Players in the Ready to Eat Food Market Market
- Nomad Foods Ltd
- General Mills Inc
- Amy's Kitchen
- Conagra Brands Inc
- The Kraft Heinz Company
- McCain Foods Limited
- Campbell Soup Company
- Premier Foods Group Limited
- Dr August Oetker Nahrungsmittel KG
- Nestlé S A
Key Developments in Ready to Eat Food Market Industry
- September 2022: McCain Foods acquired Netherlands-based Scelta Products, strengthening its position in prepared frozen appetizers.
- August 2022: General Mills Inc. launched prepared meal kits under Betty Crocker, Old El Paso, Pillsbury, and Annie's Organic brands, expanding its ready-to-eat offerings.
- August 2021: Nestlé's Freshly launched a fully vegan meal line, tapping into the growing demand for plant-based options.
Future Outlook for Ready to Eat Food Market Market
The Ready to Eat Food market is poised for continued growth, driven by evolving consumer preferences, technological advancements, and expansion into new markets. Strategic partnerships, product diversification, and focus on innovation will be crucial for success. The market is expected to witness significant growth in the coming years, presenting substantial opportunities for companies to capture market share and enhance profitability.
Ready to Eat Food Market Segmentation
-
1. Product Type
- 1.1. Instant Breakfast/Cereals
- 1.2. Instant Soups and Snacks
- 1.3. Ready Meals
- 1.4. Baked Goods
- 1.5. Meat Products
- 1.6. Other Product Types
-
2. Distribution Channel
- 2.1. Hypermarkets/Supermarkets
- 2.2. Convenience Stores
- 2.3. Online Retail Stores
- 2.4. Other Distribution Channels
Ready to Eat Food Market Segmentation By Geography
-
1. North America
- 1.1. United States
- 1.2. Canada
- 1.3. Mexico
- 1.4. Rest of North America
-
2. Europe
- 2.1. Spain
- 2.2. United Kingdom
- 2.3. Germany
- 2.4. France
- 2.5. Italy
- 2.6. Russia
- 2.7. Rest of Europe
-
3. Asia Pacific
- 3.1. China
- 3.2. Japan
- 3.3. India
- 3.4. Australia
- 3.5. Rest of Asia Pacific
-
4. South America
- 4.1. Brazil
- 4.2. Argentina
- 4.3. Rest of South America
-
5. Middle East and Africa
- 5.1. South Africa
- 5.2. Saudi Arabia
- 5.3. Rest of Middle East and Africa
Ready to Eat Food Market REPORT HIGHLIGHTS
| Aspects | Details |
|---|---|
| Study Period | 2019-2033 |
| Base Year | 2024 |
| Estimated Year | 2025 |
| Forecast Period | 2025-2033 |
| Historical Period | 2019-2024 |
| Growth Rate | CAGR of 4.94% from 2019-2033 |
| Segmentation |
|
Table of Contents
- 1. Introduction
- 1.1. Research Scope
- 1.2. Market Segmentation
- 1.3. Research Methodology
- 1.4. Definitions and Assumptions
- 2. Executive Summary
- 2.1. Introduction
- 3. Market Dynamics
- 3.1. Introduction
- 3.2. Market Drivers
- 3.2.1. The numerous benefits offered by collagen in the food and beverage industry
- 3.3. Market Restrains
- 3.3.1. Increasing vegan population in the region
- 3.4. Market Trends
- 3.4.1. Surge in Demand for Convenient and Healthy Instant Food
- 4. Market Factor Analysis
- 4.1. Porters Five Forces
- 4.2. Supply/Value Chain
- 4.3. PESTEL analysis
- 4.4. Market Entropy
- 4.5. Patent/Trademark Analysis
- 5. Global Ready to Eat Food Market Analysis, Insights and Forecast, 2019-2031
- 5.1. Market Analysis, Insights and Forecast - by Product Type
- 5.1.1. Instant Breakfast/Cereals
- 5.1.2. Instant Soups and Snacks
- 5.1.3. Ready Meals
- 5.1.4. Baked Goods
- 5.1.5. Meat Products
- 5.1.6. Other Product Types
- 5.2. Market Analysis, Insights and Forecast - by Distribution Channel
- 5.2.1. Hypermarkets/Supermarkets
- 5.2.2. Convenience Stores
- 5.2.3. Online Retail Stores
- 5.2.4. Other Distribution Channels
- 5.3. Market Analysis, Insights and Forecast - by Region
- 5.3.1. North America
- 5.3.2. Europe
- 5.3.3. Asia Pacific
- 5.3.4. South America
- 5.3.5. Middle East and Africa
- 5.1. Market Analysis, Insights and Forecast - by Product Type
- 6. North America Ready to Eat Food Market Analysis, Insights and Forecast, 2019-2031
- 6.1. Market Analysis, Insights and Forecast - by Product Type
- 6.1.1. Instant Breakfast/Cereals
- 6.1.2. Instant Soups and Snacks
- 6.1.3. Ready Meals
- 6.1.4. Baked Goods
- 6.1.5. Meat Products
- 6.1.6. Other Product Types
- 6.2. Market Analysis, Insights and Forecast - by Distribution Channel
- 6.2.1. Hypermarkets/Supermarkets
- 6.2.2. Convenience Stores
- 6.2.3. Online Retail Stores
- 6.2.4. Other Distribution Channels
- 6.1. Market Analysis, Insights and Forecast - by Product Type
- 7. Europe Ready to Eat Food Market Analysis, Insights and Forecast, 2019-2031
- 7.1. Market Analysis, Insights and Forecast - by Product Type
- 7.1.1. Instant Breakfast/Cereals
- 7.1.2. Instant Soups and Snacks
- 7.1.3. Ready Meals
- 7.1.4. Baked Goods
- 7.1.5. Meat Products
- 7.1.6. Other Product Types
- 7.2. Market Analysis, Insights and Forecast - by Distribution Channel
- 7.2.1. Hypermarkets/Supermarkets
- 7.2.2. Convenience Stores
- 7.2.3. Online Retail Stores
- 7.2.4. Other Distribution Channels
- 7.1. Market Analysis, Insights and Forecast - by Product Type
- 8. Asia Pacific Ready to Eat Food Market Analysis, Insights and Forecast, 2019-2031
- 8.1. Market Analysis, Insights and Forecast - by Product Type
- 8.1.1. Instant Breakfast/Cereals
- 8.1.2. Instant Soups and Snacks
- 8.1.3. Ready Meals
- 8.1.4. Baked Goods
- 8.1.5. Meat Products
- 8.1.6. Other Product Types
- 8.2. Market Analysis, Insights and Forecast - by Distribution Channel
- 8.2.1. Hypermarkets/Supermarkets
- 8.2.2. Convenience Stores
- 8.2.3. Online Retail Stores
- 8.2.4. Other Distribution Channels
- 8.1. Market Analysis, Insights and Forecast - by Product Type
- 9. South America Ready to Eat Food Market Analysis, Insights and Forecast, 2019-2031
- 9.1. Market Analysis, Insights and Forecast - by Product Type
- 9.1.1. Instant Breakfast/Cereals
- 9.1.2. Instant Soups and Snacks
- 9.1.3. Ready Meals
- 9.1.4. Baked Goods
- 9.1.5. Meat Products
- 9.1.6. Other Product Types
- 9.2. Market Analysis, Insights and Forecast - by Distribution Channel
- 9.2.1. Hypermarkets/Supermarkets
- 9.2.2. Convenience Stores
- 9.2.3. Online Retail Stores
- 9.2.4. Other Distribution Channels
- 9.1. Market Analysis, Insights and Forecast - by Product Type
- 10. Middle East and Africa Ready to Eat Food Market Analysis, Insights and Forecast, 2019-2031
- 10.1. Market Analysis, Insights and Forecast - by Product Type
- 10.1.1. Instant Breakfast/Cereals
- 10.1.2. Instant Soups and Snacks
- 10.1.3. Ready Meals
- 10.1.4. Baked Goods
- 10.1.5. Meat Products
- 10.1.6. Other Product Types
- 10.2. Market Analysis, Insights and Forecast - by Distribution Channel
- 10.2.1. Hypermarkets/Supermarkets
- 10.2.2. Convenience Stores
- 10.2.3. Online Retail Stores
- 10.2.4. Other Distribution Channels
- 10.1. Market Analysis, Insights and Forecast - by Product Type
- 11. North America Ready to Eat Food Market Analysis, Insights and Forecast, 2019-2031
- 11.1. Market Analysis, Insights and Forecast - By Country/Sub-region
- 11.1.1 United States
- 11.1.2 Canada
- 11.1.3 Mexico
- 11.1.4 Rest of North America
- 12. Europe Ready to Eat Food Market Analysis, Insights and Forecast, 2019-2031
- 12.1. Market Analysis, Insights and Forecast - By Country/Sub-region
- 12.1.1 Spain
- 12.1.2 United Kingdom
- 12.1.3 Germany
- 12.1.4 France
- 12.1.5 Italy
- 12.1.6 Russia
- 12.1.7 Rest of Europe
- 13. Asia Pacific Ready to Eat Food Market Analysis, Insights and Forecast, 2019-2031
- 13.1. Market Analysis, Insights and Forecast - By Country/Sub-region
- 13.1.1 China
- 13.1.2 Japan
- 13.1.3 India
- 13.1.4 Australia
- 13.1.5 Rest of Asia Pacific
- 14. South America Ready to Eat Food Market Analysis, Insights and Forecast, 2019-2031
- 14.1. Market Analysis, Insights and Forecast - By Country/Sub-region
- 14.1.1 Brazil
- 14.1.2 Argentina
- 14.1.3 Rest of South America
- 15. Middle East and Africa Ready to Eat Food Market Analysis, Insights and Forecast, 2019-2031
- 15.1. Market Analysis, Insights and Forecast - By Country/Sub-region
- 15.1.1 South Africa
- 15.1.2 Saudi Arabia
- 15.1.3 Rest of Middle East and Africa
- 16. Competitive Analysis
- 16.1. Global Market Share Analysis 2024
- 16.2. Company Profiles
- 16.2.1 Nomad Foods Ltd
- 16.2.1.1. Overview
- 16.2.1.2. Products
- 16.2.1.3. SWOT Analysis
- 16.2.1.4. Recent Developments
- 16.2.1.5. Financials (Based on Availability)
- 16.2.2 General Mills Inc
- 16.2.2.1. Overview
- 16.2.2.2. Products
- 16.2.2.3. SWOT Analysis
- 16.2.2.4. Recent Developments
- 16.2.2.5. Financials (Based on Availability)
- 16.2.3 Amy's Kitchen
- 16.2.3.1. Overview
- 16.2.3.2. Products
- 16.2.3.3. SWOT Analysis
- 16.2.3.4. Recent Developments
- 16.2.3.5. Financials (Based on Availability)
- 16.2.4 Conagra Brands Inc
- 16.2.4.1. Overview
- 16.2.4.2. Products
- 16.2.4.3. SWOT Analysis
- 16.2.4.4. Recent Developments
- 16.2.4.5. Financials (Based on Availability)
- 16.2.5 The Kraft Heinz Company
- 16.2.5.1. Overview
- 16.2.5.2. Products
- 16.2.5.3. SWOT Analysis
- 16.2.5.4. Recent Developments
- 16.2.5.5. Financials (Based on Availability)
- 16.2.6 McCain Foods Limited
- 16.2.6.1. Overview
- 16.2.6.2. Products
- 16.2.6.3. SWOT Analysis
- 16.2.6.4. Recent Developments
- 16.2.6.5. Financials (Based on Availability)
- 16.2.7 Campbell Soup Company
- 16.2.7.1. Overview
- 16.2.7.2. Products
- 16.2.7.3. SWOT Analysis
- 16.2.7.4. Recent Developments
- 16.2.7.5. Financials (Based on Availability)
- 16.2.8 Premier Foods Group Limited
- 16.2.8.1. Overview
- 16.2.8.2. Products
- 16.2.8.3. SWOT Analysis
- 16.2.8.4. Recent Developments
- 16.2.8.5. Financials (Based on Availability)
- 16.2.9 Dr August Oetker Nahrungsmittel KG
- 16.2.9.1. Overview
- 16.2.9.2. Products
- 16.2.9.3. SWOT Analysis
- 16.2.9.4. Recent Developments
- 16.2.9.5. Financials (Based on Availability)
- 16.2.10 Nestlé S A
- 16.2.10.1. Overview
- 16.2.10.2. Products
- 16.2.10.3. SWOT Analysis
- 16.2.10.4. Recent Developments
- 16.2.10.5. Financials (Based on Availability)
- 16.2.1 Nomad Foods Ltd
List of Figures
- Figure 1: Global Ready to Eat Food Market Revenue Breakdown (Million, %) by Region 2024 & 2032
- Figure 2: North America Ready to Eat Food Market Revenue (Million), by Country 2024 & 2032
- Figure 3: North America Ready to Eat Food Market Revenue Share (%), by Country 2024 & 2032
- Figure 4: Europe Ready to Eat Food Market Revenue (Million), by Country 2024 & 2032
- Figure 5: Europe Ready to Eat Food Market Revenue Share (%), by Country 2024 & 2032
- Figure 6: Asia Pacific Ready to Eat Food Market Revenue (Million), by Country 2024 & 2032
- Figure 7: Asia Pacific Ready to Eat Food Market Revenue Share (%), by Country 2024 & 2032
- Figure 8: South America Ready to Eat Food Market Revenue (Million), by Country 2024 & 2032
- Figure 9: South America Ready to Eat Food Market Revenue Share (%), by Country 2024 & 2032
- Figure 10: Middle East and Africa Ready to Eat Food Market Revenue (Million), by Country 2024 & 2032
- Figure 11: Middle East and Africa Ready to Eat Food Market Revenue Share (%), by Country 2024 & 2032
- Figure 12: North America Ready to Eat Food Market Revenue (Million), by Product Type 2024 & 2032
- Figure 13: North America Ready to Eat Food Market Revenue Share (%), by Product Type 2024 & 2032
- Figure 14: North America Ready to Eat Food Market Revenue (Million), by Distribution Channel 2024 & 2032
- Figure 15: North America Ready to Eat Food Market Revenue Share (%), by Distribution Channel 2024 & 2032
- Figure 16: North America Ready to Eat Food Market Revenue (Million), by Country 2024 & 2032
- Figure 17: North America Ready to Eat Food Market Revenue Share (%), by Country 2024 & 2032
- Figure 18: Europe Ready to Eat Food Market Revenue (Million), by Product Type 2024 & 2032
- Figure 19: Europe Ready to Eat Food Market Revenue Share (%), by Product Type 2024 & 2032
- Figure 20: Europe Ready to Eat Food Market Revenue (Million), by Distribution Channel 2024 & 2032
- Figure 21: Europe Ready to Eat Food Market Revenue Share (%), by Distribution Channel 2024 & 2032
- Figure 22: Europe Ready to Eat Food Market Revenue (Million), by Country 2024 & 2032
- Figure 23: Europe Ready to Eat Food Market Revenue Share (%), by Country 2024 & 2032
- Figure 24: Asia Pacific Ready to Eat Food Market Revenue (Million), by Product Type 2024 & 2032
- Figure 25: Asia Pacific Ready to Eat Food Market Revenue Share (%), by Product Type 2024 & 2032
- Figure 26: Asia Pacific Ready to Eat Food Market Revenue (Million), by Distribution Channel 2024 & 2032
- Figure 27: Asia Pacific Ready to Eat Food Market Revenue Share (%), by Distribution Channel 2024 & 2032
- Figure 28: Asia Pacific Ready to Eat Food Market Revenue (Million), by Country 2024 & 2032
- Figure 29: Asia Pacific Ready to Eat Food Market Revenue Share (%), by Country 2024 & 2032
- Figure 30: South America Ready to Eat Food Market Revenue (Million), by Product Type 2024 & 2032
- Figure 31: South America Ready to Eat Food Market Revenue Share (%), by Product Type 2024 & 2032
- Figure 32: South America Ready to Eat Food Market Revenue (Million), by Distribution Channel 2024 & 2032
- Figure 33: South America Ready to Eat Food Market Revenue Share (%), by Distribution Channel 2024 & 2032
- Figure 34: South America Ready to Eat Food Market Revenue (Million), by Country 2024 & 2032
- Figure 35: South America Ready to Eat Food Market Revenue Share (%), by Country 2024 & 2032
- Figure 36: Middle East and Africa Ready to Eat Food Market Revenue (Million), by Product Type 2024 & 2032
- Figure 37: Middle East and Africa Ready to Eat Food Market Revenue Share (%), by Product Type 2024 & 2032
- Figure 38: Middle East and Africa Ready to Eat Food Market Revenue (Million), by Distribution Channel 2024 & 2032
- Figure 39: Middle East and Africa Ready to Eat Food Market Revenue Share (%), by Distribution Channel 2024 & 2032
- Figure 40: Middle East and Africa Ready to Eat Food Market Revenue (Million), by Country 2024 & 2032
- Figure 41: Middle East and Africa Ready to Eat Food Market Revenue Share (%), by Country 2024 & 2032
List of Tables
- Table 1: Global Ready to Eat Food Market Revenue Million Forecast, by Region 2019 & 2032
- Table 2: Global Ready to Eat Food Market Revenue Million Forecast, by Product Type 2019 & 2032
- Table 3: Global Ready to Eat Food Market Revenue Million Forecast, by Distribution Channel 2019 & 2032
- Table 4: Global Ready to Eat Food Market Revenue Million Forecast, by Region 2019 & 2032
- Table 5: Global Ready to Eat Food Market Revenue Million Forecast, by Country 2019 & 2032
- Table 6: United States Ready to Eat Food Market Revenue (Million) Forecast, by Application 2019 & 2032
- Table 7: Canada Ready to Eat Food Market Revenue (Million) Forecast, by Application 2019 & 2032
- Table 8: Mexico Ready to Eat Food Market Revenue (Million) Forecast, by Application 2019 & 2032
- Table 9: Rest of North America Ready to Eat Food Market Revenue (Million) Forecast, by Application 2019 & 2032
- Table 10: Global Ready to Eat Food Market Revenue Million Forecast, by Country 2019 & 2032
- Table 11: Spain Ready to Eat Food Market Revenue (Million) Forecast, by Application 2019 & 2032
- Table 12: United Kingdom Ready to Eat Food Market Revenue (Million) Forecast, by Application 2019 & 2032
- Table 13: Germany Ready to Eat Food Market Revenue (Million) Forecast, by Application 2019 & 2032
- Table 14: France Ready to Eat Food Market Revenue (Million) Forecast, by Application 2019 & 2032
- Table 15: Italy Ready to Eat Food Market Revenue (Million) Forecast, by Application 2019 & 2032
- Table 16: Russia Ready to Eat Food Market Revenue (Million) Forecast, by Application 2019 & 2032
- Table 17: Rest of Europe Ready to Eat Food Market Revenue (Million) Forecast, by Application 2019 & 2032
- Table 18: Global Ready to Eat Food Market Revenue Million Forecast, by Country 2019 & 2032
- Table 19: China Ready to Eat Food Market Revenue (Million) Forecast, by Application 2019 & 2032
- Table 20: Japan Ready to Eat Food Market Revenue (Million) Forecast, by Application 2019 & 2032
- Table 21: India Ready to Eat Food Market Revenue (Million) Forecast, by Application 2019 & 2032
- Table 22: Australia Ready to Eat Food Market Revenue (Million) Forecast, by Application 2019 & 2032
- Table 23: Rest of Asia Pacific Ready to Eat Food Market Revenue (Million) Forecast, by Application 2019 & 2032
- Table 24: Global Ready to Eat Food Market Revenue Million Forecast, by Country 2019 & 2032
- Table 25: Brazil Ready to Eat Food Market Revenue (Million) Forecast, by Application 2019 & 2032
- Table 26: Argentina Ready to Eat Food Market Revenue (Million) Forecast, by Application 2019 & 2032
- Table 27: Rest of South America Ready to Eat Food Market Revenue (Million) Forecast, by Application 2019 & 2032
- Table 28: Global Ready to Eat Food Market Revenue Million Forecast, by Country 2019 & 2032
- Table 29: South Africa Ready to Eat Food Market Revenue (Million) Forecast, by Application 2019 & 2032
- Table 30: Saudi Arabia Ready to Eat Food Market Revenue (Million) Forecast, by Application 2019 & 2032
- Table 31: Rest of Middle East and Africa Ready to Eat Food Market Revenue (Million) Forecast, by Application 2019 & 2032
- Table 32: Global Ready to Eat Food Market Revenue Million Forecast, by Product Type 2019 & 2032
- Table 33: Global Ready to Eat Food Market Revenue Million Forecast, by Distribution Channel 2019 & 2032
- Table 34: Global Ready to Eat Food Market Revenue Million Forecast, by Country 2019 & 2032
- Table 35: United States Ready to Eat Food Market Revenue (Million) Forecast, by Application 2019 & 2032
- Table 36: Canada Ready to Eat Food Market Revenue (Million) Forecast, by Application 2019 & 2032
- Table 37: Mexico Ready to Eat Food Market Revenue (Million) Forecast, by Application 2019 & 2032
- Table 38: Rest of North America Ready to Eat Food Market Revenue (Million) Forecast, by Application 2019 & 2032
- Table 39: Global Ready to Eat Food Market Revenue Million Forecast, by Product Type 2019 & 2032
- Table 40: Global Ready to Eat Food Market Revenue Million Forecast, by Distribution Channel 2019 & 2032
- Table 41: Global Ready to Eat Food Market Revenue Million Forecast, by Country 2019 & 2032
- Table 42: Spain Ready to Eat Food Market Revenue (Million) Forecast, by Application 2019 & 2032
- Table 43: United Kingdom Ready to Eat Food Market Revenue (Million) Forecast, by Application 2019 & 2032
- Table 44: Germany Ready to Eat Food Market Revenue (Million) Forecast, by Application 2019 & 2032
- Table 45: France Ready to Eat Food Market Revenue (Million) Forecast, by Application 2019 & 2032
- Table 46: Italy Ready to Eat Food Market Revenue (Million) Forecast, by Application 2019 & 2032
- Table 47: Russia Ready to Eat Food Market Revenue (Million) Forecast, by Application 2019 & 2032
- Table 48: Rest of Europe Ready to Eat Food Market Revenue (Million) Forecast, by Application 2019 & 2032
- Table 49: Global Ready to Eat Food Market Revenue Million Forecast, by Product Type 2019 & 2032
- Table 50: Global Ready to Eat Food Market Revenue Million Forecast, by Distribution Channel 2019 & 2032
- Table 51: Global Ready to Eat Food Market Revenue Million Forecast, by Country 2019 & 2032
- Table 52: China Ready to Eat Food Market Revenue (Million) Forecast, by Application 2019 & 2032
- Table 53: Japan Ready to Eat Food Market Revenue (Million) Forecast, by Application 2019 & 2032
- Table 54: India Ready to Eat Food Market Revenue (Million) Forecast, by Application 2019 & 2032
- Table 55: Australia Ready to Eat Food Market Revenue (Million) Forecast, by Application 2019 & 2032
- Table 56: Rest of Asia Pacific Ready to Eat Food Market Revenue (Million) Forecast, by Application 2019 & 2032
- Table 57: Global Ready to Eat Food Market Revenue Million Forecast, by Product Type 2019 & 2032
- Table 58: Global Ready to Eat Food Market Revenue Million Forecast, by Distribution Channel 2019 & 2032
- Table 59: Global Ready to Eat Food Market Revenue Million Forecast, by Country 2019 & 2032
- Table 60: Brazil Ready to Eat Food Market Revenue (Million) Forecast, by Application 2019 & 2032
- Table 61: Argentina Ready to Eat Food Market Revenue (Million) Forecast, by Application 2019 & 2032
- Table 62: Rest of South America Ready to Eat Food Market Revenue (Million) Forecast, by Application 2019 & 2032
- Table 63: Global Ready to Eat Food Market Revenue Million Forecast, by Product Type 2019 & 2032
- Table 64: Global Ready to Eat Food Market Revenue Million Forecast, by Distribution Channel 2019 & 2032
- Table 65: Global Ready to Eat Food Market Revenue Million Forecast, by Country 2019 & 2032
- Table 66: South Africa Ready to Eat Food Market Revenue (Million) Forecast, by Application 2019 & 2032
- Table 67: Saudi Arabia Ready to Eat Food Market Revenue (Million) Forecast, by Application 2019 & 2032
- Table 68: Rest of Middle East and Africa Ready to Eat Food Market Revenue (Million) Forecast, by Application 2019 & 2032
Frequently Asked Questions
1. What is the projected Compound Annual Growth Rate (CAGR) of the Ready to Eat Food Market?
The projected CAGR is approximately 4.94%.
2. Which companies are prominent players in the Ready to Eat Food Market?
Key companies in the market include Nomad Foods Ltd, General Mills Inc, Amy's Kitchen, Conagra Brands Inc, The Kraft Heinz Company, McCain Foods Limited, Campbell Soup Company, Premier Foods Group Limited, Dr August Oetker Nahrungsmittel KG, Nestlé S A.
3. What are the main segments of the Ready to Eat Food Market?
The market segments include Product Type, Distribution Channel.
4. Can you provide details about the market size?
The market size is estimated to be USD 402.90 Million as of 2022.
5. What are some drivers contributing to market growth?
The numerous benefits offered by collagen in the food and beverage industry.
6. What are the notable trends driving market growth?
Surge in Demand for Convenient and Healthy Instant Food.
7. Are there any restraints impacting market growth?
Increasing vegan population in the region.
8. Can you provide examples of recent developments in the market?
In September 2022, McCain Foods acquired Netherlands-based Scelta Products. This acquisition will strengthen the position of the company in prepared frozen appetizers and will add innovation and capacity to frozen appetizers. Nomad Foods Ltd
9. What pricing options are available for accessing the report?
Pricing options include single-user, multi-user, and enterprise licenses priced at USD 4750, USD 5250, and USD 8750 respectively.
10. Is the market size provided in terms of value or volume?
The market size is provided in terms of value, measured in Million.
11. Are there any specific market keywords associated with the report?
Yes, the market keyword associated with the report is "Ready to Eat Food Market," which aids in identifying and referencing the specific market segment covered.
12. How do I determine which pricing option suits my needs best?
The pricing options vary based on user requirements and access needs. Individual users may opt for single-user licenses, while businesses requiring broader access may choose multi-user or enterprise licenses for cost-effective access to the report.
13. Are there any additional resources or data provided in the Ready to Eat Food Market report?
While the report offers comprehensive insights, it's advisable to review the specific contents or supplementary materials provided to ascertain if additional resources or data are available.
14. How can I stay updated on further developments or reports in the Ready to Eat Food Market?
To stay informed about further developments, trends, and reports in the Ready to Eat Food Market, consider subscribing to industry newsletters, following relevant companies and organizations, or regularly checking reputable industry news sources and publications.
Methodology
Step 1 - Identification of Relevant Samples Size from Population Database


Step 2 - Approaches for Defining Global Market Size (Value, Volume* & Price*)

Note*: In applicable scenarios
Step 3 - Data Sources
Primary Research
- Web Analytics
- Survey Reports
- Research Institute
- Latest Research Reports
- Opinion Leaders
Secondary Research
- Annual Reports
- White Paper
- Latest Press Release
- Industry Association
- Paid Database
- Investor Presentations

Step 4 - Data Triangulation
Involves using different sources of information in order to increase the validity of a study
These sources are likely to be stakeholders in a program - participants, other researchers, program staff, other community members, and so on.
Then we put all data in single framework & apply various statistical tools to find out the dynamic on the market.
During the analysis stage, feedback from the stakeholder groups would be compared to determine areas of agreement as well as areas of divergence


