

Key Insights
The Recombinant DNA Technology market is poised for substantial expansion, driven by pioneering advancements in biotechnology and pharmaceuticals. Increased demand for novel therapies and diagnostic tools, coupled with the global rise in chronic diseases, are key market accelerators. Furthermore, the integration of recombinant DNA technology in agriculture, for developing resilient crops and improving yields, significantly contributes to this growth. Research institutions also play a pivotal role in advancing genetic engineering and fostering new applications. The market is segmented by end-user (Biotechnology & Pharmaceutical Companies, Academic & Government Research Institutes, Others), product (Medical & Non-medical Vaccines), component (Expression System, Cloning Vector), and application (Food & Agriculture, Health & Disease, Environment). Despite regulatory hurdles and ethical considerations, the market's growth trajectory remains robust. A Compound Annual Growth Rate (CAGR) of 9.8% indicates sustained expansion, with industry leaders prioritizing R&D investment. North America and Europe currently dominate, with Asia Pacific emerging as a significant growth region due to increasing biotechnology infrastructure and research initiatives.
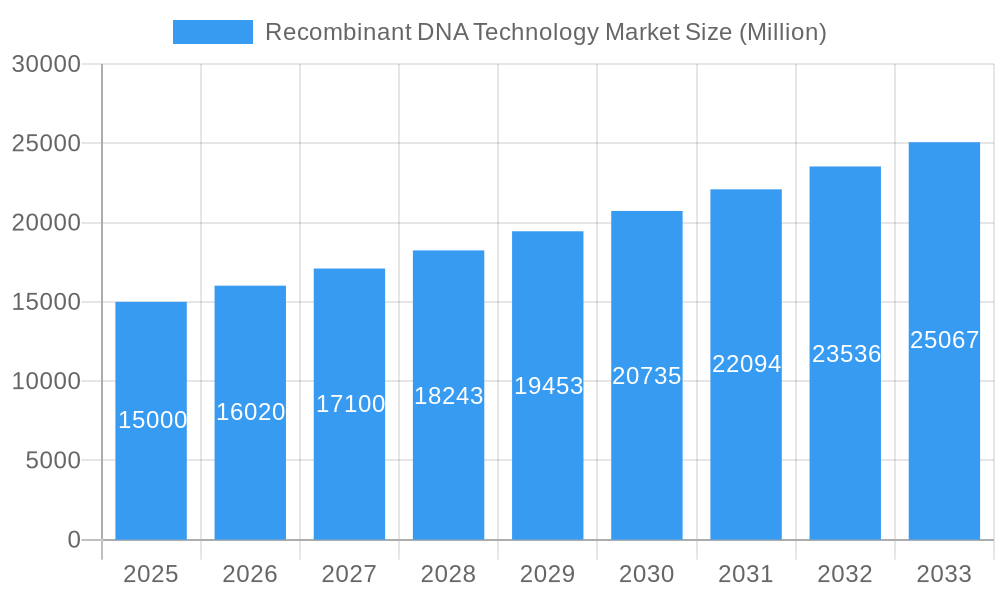
Recombinant DNA Technology Market Market Size (In Billion)
The competitive environment features established pharmaceutical corporations and specialized biotechnology firms. Strategic priorities include portfolio expansion, strategic partnerships, and mergers and acquisitions to strengthen market positions. Ongoing R&D in gene therapy, personalized medicine, and advanced diagnostics offers significant future growth prospects. The market size is estimated at $189.91 billion in the base year of 2025, with a projected CAGR of 9.8%, providing a clear outlook on market progression and future potential through 2033.
Recombinant DNA Technology Market Company Market Share
Recombinant DNA Technology Market: A Comprehensive Report (2019-2033)
This comprehensive report provides a detailed analysis of the Recombinant DNA Technology market, offering invaluable insights for industry professionals, investors, and researchers. Covering the period 2019-2033, with a focus on 2025, this report meticulously examines market structure, dynamics, leading players, and future growth potential. The report leverages extensive data analysis to forecast market trends and identify key opportunities.
Recombinant DNA Technology Market Structure & Innovation Trends
This section delves into the competitive landscape of the Recombinant DNA Technology market, analyzing market concentration, innovation drivers, and regulatory frameworks. We examine the influence of mergers and acquisitions (M&A) activities, exploring deal values and their impact on market share distribution. The analysis considers end-user demographics, including Biotechnology and Pharmaceutical Companies, Academic and Government Research Institutes, and Other End Users, to understand market segmentation and growth drivers.
- Market Concentration: The market exhibits a moderately consolidated structure, with key players holding significant market share. The top five companies account for approximately xx% of the global market.
- Innovation Drivers: Continuous advancements in genetic engineering techniques, coupled with increasing demand for novel therapeutics and diagnostics, are key innovation drivers. Investment in R&D and strategic collaborations further accelerate innovation.
- Regulatory Frameworks: Stringent regulatory approvals and guidelines for genetically modified organisms (GMOs) significantly influence market growth. Variations in regulatory landscapes across different regions affect market dynamics.
- Product Substitutes: While no direct substitutes exist, alternative technologies like traditional methods of drug discovery face increasing competition from the efficiency and precision of recombinant DNA technology.
- M&A Activities: The market has witnessed several significant M&A deals in recent years, with deal values exceeding xx Million. These transactions have reshaped the competitive landscape and spurred innovation.
Recombinant DNA Technology Market Dynamics & Trends
This section explores the market's growth trajectory, analyzing key drivers, disruptive technologies, consumer preferences, and competitive dynamics. We provide a comprehensive overview of market growth, using Compound Annual Growth Rate (CAGR) and market penetration rates to illustrate trends. The analysis considers factors such as increasing prevalence of chronic diseases, rising demand for personalized medicine, and advancements in gene editing technologies. The impact of technological disruptions, like CRISPR-Cas9 technology, on market growth is also examined. Competitive dynamics, including pricing strategies, product differentiation, and market expansion initiatives, are thoroughly evaluated. The report estimates a CAGR of xx% during the forecast period (2025-2033), driven by these factors. Market penetration in key segments is projected to reach xx% by 2033.
Dominant Regions & Segments in Recombinant DNA Technology Market
This section pinpoints the leading regions, countries, and segments within the Recombinant DNA Technology market. The analysis encompasses End Users (Biotechnology and Pharmaceutical Companies, Academic and Government Research Institutes, Other End Users), Products (Medical, Non-medical Vaccines), Components (Expression Systems, Cloning Vectors), and Applications (Food and Agriculture, Health and Disease, Environment, Other Applications).
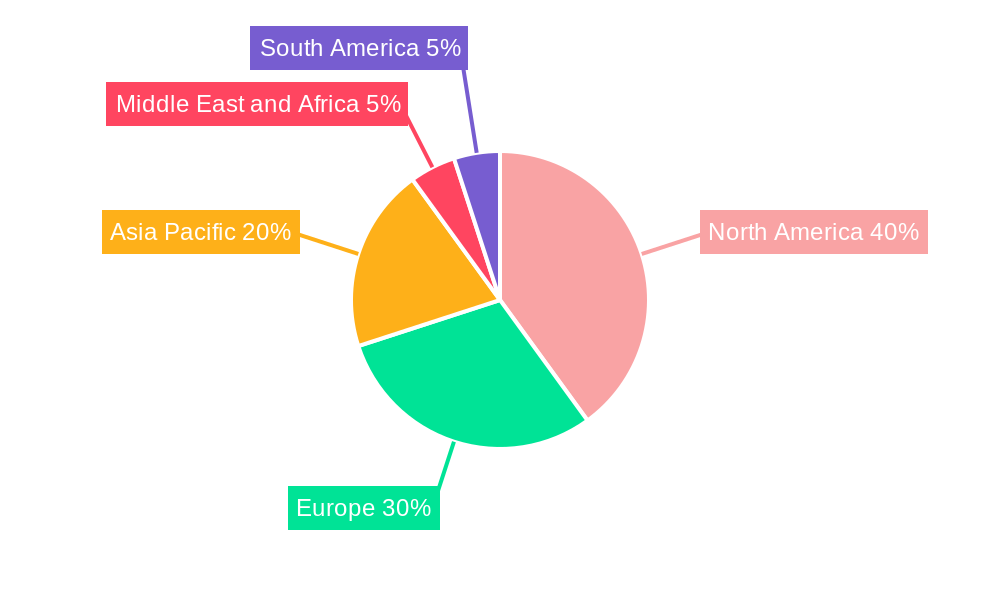
Dominant Region: North America currently holds the largest market share, driven by strong R&D investment and the presence of major players. Europe and Asia Pacific are also significant markets, exhibiting strong growth potential.
Key Drivers (by segment):
- Biotechnology and Pharmaceutical Companies: High R&D expenditure and the focus on developing novel biologics.
- Academic and Government Research Institutes: Significant funding for research projects and collaborations with industry.
- Medical Products: Growing demand for biopharmaceuticals and targeted therapies.
- Expression Systems: The efficiency and flexibility of these systems drive widespread adoption.
- Health and Disease Applications: The therapeutic potential of recombinant DNA technology in addressing various diseases.
Dominance Analysis: The dominance of North America is attributed to robust funding for biotechnology and pharmaceutical research, a highly developed regulatory framework, and the presence of major market players. The Asia-Pacific region is projected to show significant growth due to increasing healthcare spending and government initiatives promoting biotechnology development.
Recombinant DNA Technology Market Product Innovations
Recent product developments in the Recombinant DNA Technology market showcase advancements in gene editing, protein engineering, and therapeutic applications. The focus is on developing more efficient and cost-effective expression systems and creating novel therapeutic proteins with enhanced efficacy and safety profiles. These innovations are improving market fit by addressing unmet medical needs and expanding into new applications. The integration of artificial intelligence and machine learning in the design and optimization of recombinant proteins is also gaining momentum, driving further innovation.
Report Scope & Segmentation Analysis
This report provides a comprehensive segmentation of the Recombinant DNA Technology market across various parameters:
End User: Biotechnology and Pharmaceutical Companies (xx Million in 2025, projected growth of xx% by 2033), Academic and Government Research Institutes (xx Million in 2025, projected growth of xx% by 2033), Other End Users (xx Million in 2025, projected growth of xx% by 2033). Competitive dynamics within each segment vary significantly, with biotechnology and pharmaceutical companies driving most of the revenue.
Product: Medical (xx Million in 2025, projected growth of xx% by 2033), Non-medical Vaccines (xx Million in 2025, projected growth of xx% by 2033). Medical products dominate the market, reflecting the extensive use of recombinant proteins in therapeutics.
Component: Expression Systems (xx Million in 2025, projected growth of xx% by 2033), Cloning Vectors (xx Million in 2025, projected growth of xx% by 2033). Both components are integral to recombinant DNA technology, showing similar growth trajectories.
Application: Food and Agriculture (xx Million in 2025, projected growth of xx% by 2033), Health and Disease (xx Million in 2025, projected growth of xx% by 2033), Environment (xx Million in 2025, projected growth of xx% by 2033), Other Applications (xx Million in 2025, projected growth of xx% by 2033). Health and disease applications account for the largest segment due to the significant therapeutic potential of recombinant DNA technology.
Key Drivers of Recombinant DNA Technology Market Growth
Several factors fuel the growth of the Recombinant DNA Technology market. Advancements in gene editing technologies like CRISPR-Cas9 are significantly enhancing the precision and efficiency of genetic manipulation. Increased funding for biotechnology research and development is driving innovation and the creation of new therapeutic products. The rising prevalence of chronic diseases and the growing need for personalized medicine contribute to the demand for recombinant DNA-based therapies. Furthermore, favorable government regulations and supportive policies in several regions encourage market growth.
Challenges in the Recombinant DNA Technology Market Sector
Despite its immense potential, the Recombinant DNA Technology market faces challenges. Stringent regulatory approvals can cause delays in product launches and increase development costs. Supply chain disruptions can affect the availability of essential components and reagents, impacting production timelines. Intense competition among established players and emerging companies creates price pressures and necessitates continuous innovation to maintain market share. These factors can collectively impact market growth by xx%.
Emerging Opportunities in Recombinant DNA Technology Market
The Recombinant DNA Technology market offers promising opportunities. The expansion into new therapeutic areas, such as gene therapy and immunotherapy, presents significant growth prospects. Advancements in synthetic biology and the development of novel expression systems are opening new avenues for creating highly efficient and scalable production platforms. Increasing awareness and acceptance of gene-editing technologies among the public are paving the way for wider adoption of recombinant DNA-based solutions.
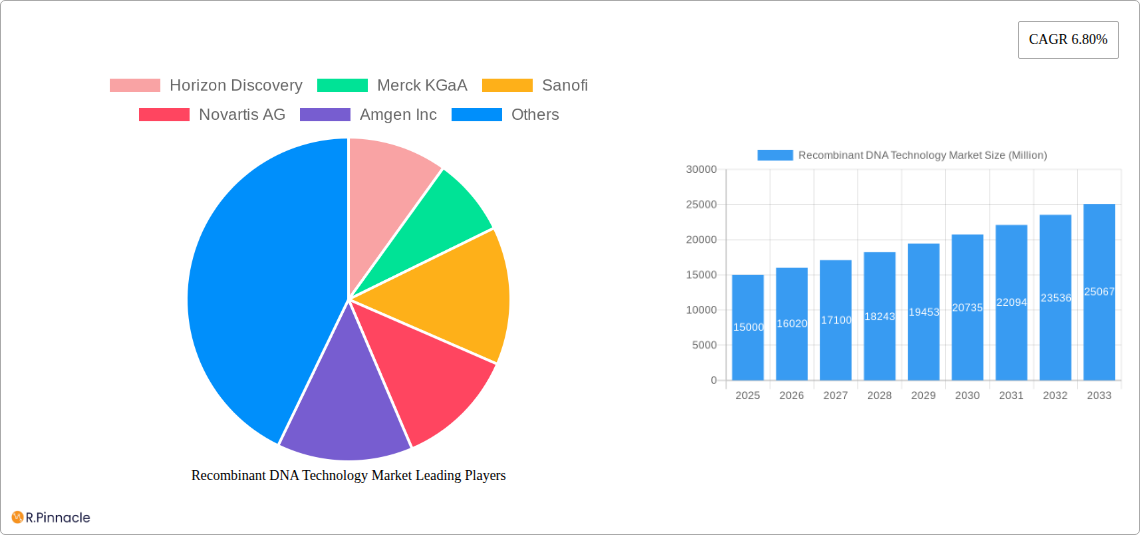
Leading Players in the Recombinant DNA Technology Market
Key Developments in Recombinant DNA Technology Market Industry
- March 2022: VBI Vaccines Inc. launched PreHevbrio (Recombinant Hepatitis B Vaccine) in the United States.
- February 2022: VBI Vaccines Inc. received positive opinion from the European Medicines Agency for PreHevbri (3-antigen hepatitis B vaccine).
These launches demonstrate significant progress in the development and commercialization of recombinant vaccines, expanding the market's reach and potential.
Future Outlook for Recombinant DNA Technology Market
The future outlook for the Recombinant DNA Technology market is highly positive. Continued advancements in gene editing, synthetic biology, and protein engineering will fuel innovation and drive market growth. Expanding applications in therapeutics, diagnostics, and industrial biotechnology will further contribute to market expansion. Strategic collaborations between research institutions, biotechnology companies, and pharmaceutical companies will accelerate the development and commercialization of novel recombinant DNA-based products, creating significant opportunities for growth. The market is poised for substantial expansion, driven by these technological advancements and expanding applications.
Recombinant DNA Technology Market Segmentation
-
1. Product
-
1.1. Medical
- 1.1.1. Therapeutic Agent
- 1.1.2. Human Protein
- 1.1.3. Vaccine
-
1.2. Non-medical
- 1.2.1. Biotech Crops
- 1.2.2. Specialty Chemicals
- 1.2.3. Other Non-medical Products
-
1.1. Medical
-
2. Component
- 2.1. Expression System
- 2.2. Cloning Vector
-
3. Application
- 3.1. Food and Agriculture
- 3.2. Health and Disease
- 3.3. Environment
- 3.4. Other Applications
-
4. End User
- 4.1. Biotechnology and Pharmaceutical Companies
- 4.2. Academic and Government Research Institutes
- 4.3. Other End Users
Recombinant DNA Technology Market Segmentation By Geography
-
1. North America
- 1.1. United States
- 1.2. Canada
- 1.3. Mexico
-
2. Europe
- 2.1. Germany
- 2.2. United Kingdom
- 2.3. France
- 2.4. Italy
- 2.5. Spain
- 2.6. Rest of Europe
-
3. Asia Pacific
- 3.1. China
- 3.2. Japan
- 3.3. India
- 3.4. Australia
- 3.5. South korea
- 3.6. Rest of Asia Pacific
-
4. Middle East and Africa
- 4.1. GCC
- 4.2. South Africa
- 4.3. Rest of Middle East and Africa
-
5. South America
- 5.1. Brazil
- 5.2. Argentina
- 5.3. Rest of South America
Recombinant DNA Technology Market Regional Market Share
Geographic Coverage of Recombinant DNA Technology Market
Recombinant DNA Technology Market REPORT HIGHLIGHTS
| Aspects | Details |
|---|---|
| Study Period | 2020-2034 |
| Base Year | 2025 |
| Estimated Year | 2026 |
| Forecast Period | 2026-2034 |
| Historical Period | 2020-2025 |
| Growth Rate | CAGR of 9.8% from 2020-2034 |
| Segmentation |
|
Table of Contents
- 1. Introduction
- 1.1. Research Scope
- 1.2. Market Segmentation
- 1.3. Research Objective
- 1.4. Definitions and Assumptions
- 2. Executive Summary
- 2.1. Market Snapshot
- 3. Market Dynamics
- 3.1. Market Drivers
- 3.2. Market Restrains
- 3.3. Market Trends
- 3.4. Market Opportunities
- 4. Market Factor Analysis
- 4.1. Porters Five Forces
- 4.1.1. Bargaining Power of Suppliers
- 4.1.2. Bargaining Power of Buyers
- 4.1.3. Threat of New Entrants
- 4.1.4. Threat of Substitutes
- 4.1.5. Competitive Rivalry
- 4.2. PESTEL analysis
- 4.3. BCG Analysis
- 4.3.1. Stars (High Growth, High Market Share)
- 4.3.2. Cash Cows (Low Growth, High Market Share)
- 4.3.3. Question Mark (High Growth, Low Market Share)
- 4.3.4. Dogs (Low Growth, Low Market Share)
- 4.4. Ansoff Matrix Analysis
- 4.5. Supply Chain Analysis
- 4.6. Regulatory Landscape
- 4.7. Current Market Potential and Opportunity Assessment (TAM–SAM–SOM Framework)
- 4.8. PRI Analyst Note
- 4.1. Porters Five Forces
- 5. Market Analysis, Insights and Forecast 2021-2033
- 5.1. Market Analysis, Insights and Forecast - by Product
- 5.1.1. Medical
- 5.1.1.1. Therapeutic Agent
- 5.1.1.2. Human Protein
- 5.1.1.3. Vaccine
- 5.1.2. Non-medical
- 5.1.2.1. Biotech Crops
- 5.1.2.2. Specialty Chemicals
- 5.1.2.3. Other Non-medical Products
- 5.1.1. Medical
- 5.2. Market Analysis, Insights and Forecast - by Component
- 5.2.1. Expression System
- 5.2.2. Cloning Vector
- 5.3. Market Analysis, Insights and Forecast - by Application
- 5.3.1. Food and Agriculture
- 5.3.2. Health and Disease
- 5.3.3. Environment
- 5.3.4. Other Applications
- 5.4. Market Analysis, Insights and Forecast - by End User
- 5.4.1. Biotechnology and Pharmaceutical Companies
- 5.4.2. Academic and Government Research Institutes
- 5.4.3. Other End Users
- 5.5. Market Analysis, Insights and Forecast - by Region
- 5.5.1. North America
- 5.5.2. Europe
- 5.5.3. Asia Pacific
- 5.5.4. Middle East and Africa
- 5.5.5. South America
- 5.1. Market Analysis, Insights and Forecast - by Product
- 6. Global Recombinant DNA Technology Market Analysis, Insights and Forecast, 2021-2033
- 6.1. Market Analysis, Insights and Forecast - by Product
- 6.1.1. Medical
- 6.1.1.1. Therapeutic Agent
- 6.1.1.2. Human Protein
- 6.1.1.3. Vaccine
- 6.1.2. Non-medical
- 6.1.2.1. Biotech Crops
- 6.1.2.2. Specialty Chemicals
- 6.1.2.3. Other Non-medical Products
- 6.1.1. Medical
- 6.2. Market Analysis, Insights and Forecast - by Component
- 6.2.1. Expression System
- 6.2.2. Cloning Vector
- 6.3. Market Analysis, Insights and Forecast - by Application
- 6.3.1. Food and Agriculture
- 6.3.2. Health and Disease
- 6.3.3. Environment
- 6.3.4. Other Applications
- 6.4. Market Analysis, Insights and Forecast - by End User
- 6.4.1. Biotechnology and Pharmaceutical Companies
- 6.4.2. Academic and Government Research Institutes
- 6.4.3. Other End Users
- 6.1. Market Analysis, Insights and Forecast - by Product
- 7. North America Recombinant DNA Technology Market Analysis, Insights and Forecast, 2020-2032
- 7.1. Market Analysis, Insights and Forecast - by Product
- 7.1.1. Medical
- 7.1.1.1. Therapeutic Agent
- 7.1.1.2. Human Protein
- 7.1.1.3. Vaccine
- 7.1.2. Non-medical
- 7.1.2.1. Biotech Crops
- 7.1.2.2. Specialty Chemicals
- 7.1.2.3. Other Non-medical Products
- 7.1.1. Medical
- 7.2. Market Analysis, Insights and Forecast - by Component
- 7.2.1. Expression System
- 7.2.2. Cloning Vector
- 7.3. Market Analysis, Insights and Forecast - by Application
- 7.3.1. Food and Agriculture
- 7.3.2. Health and Disease
- 7.3.3. Environment
- 7.3.4. Other Applications
- 7.4. Market Analysis, Insights and Forecast - by End User
- 7.4.1. Biotechnology and Pharmaceutical Companies
- 7.4.2. Academic and Government Research Institutes
- 7.4.3. Other End Users
- 7.1. Market Analysis, Insights and Forecast - by Product
- 8. Europe Recombinant DNA Technology Market Analysis, Insights and Forecast, 2020-2032
- 8.1. Market Analysis, Insights and Forecast - by Product
- 8.1.1. Medical
- 8.1.1.1. Therapeutic Agent
- 8.1.1.2. Human Protein
- 8.1.1.3. Vaccine
- 8.1.2. Non-medical
- 8.1.2.1. Biotech Crops
- 8.1.2.2. Specialty Chemicals
- 8.1.2.3. Other Non-medical Products
- 8.1.1. Medical
- 8.2. Market Analysis, Insights and Forecast - by Component
- 8.2.1. Expression System
- 8.2.2. Cloning Vector
- 8.3. Market Analysis, Insights and Forecast - by Application
- 8.3.1. Food and Agriculture
- 8.3.2. Health and Disease
- 8.3.3. Environment
- 8.3.4. Other Applications
- 8.4. Market Analysis, Insights and Forecast - by End User
- 8.4.1. Biotechnology and Pharmaceutical Companies
- 8.4.2. Academic and Government Research Institutes
- 8.4.3. Other End Users
- 8.1. Market Analysis, Insights and Forecast - by Product
- 9. Asia Pacific Recombinant DNA Technology Market Analysis, Insights and Forecast, 2020-2032
- 9.1. Market Analysis, Insights and Forecast - by Product
- 9.1.1. Medical
- 9.1.1.1. Therapeutic Agent
- 9.1.1.2. Human Protein
- 9.1.1.3. Vaccine
- 9.1.2. Non-medical
- 9.1.2.1. Biotech Crops
- 9.1.2.2. Specialty Chemicals
- 9.1.2.3. Other Non-medical Products
- 9.1.1. Medical
- 9.2. Market Analysis, Insights and Forecast - by Component
- 9.2.1. Expression System
- 9.2.2. Cloning Vector
- 9.3. Market Analysis, Insights and Forecast - by Application
- 9.3.1. Food and Agriculture
- 9.3.2. Health and Disease
- 9.3.3. Environment
- 9.3.4. Other Applications
- 9.4. Market Analysis, Insights and Forecast - by End User
- 9.4.1. Biotechnology and Pharmaceutical Companies
- 9.4.2. Academic and Government Research Institutes
- 9.4.3. Other End Users
- 9.1. Market Analysis, Insights and Forecast - by Product
- 10. Middle East and Africa Recombinant DNA Technology Market Analysis, Insights and Forecast, 2020-2032
- 10.1. Market Analysis, Insights and Forecast - by Product
- 10.1.1. Medical
- 10.1.1.1. Therapeutic Agent
- 10.1.1.2. Human Protein
- 10.1.1.3. Vaccine
- 10.1.2. Non-medical
- 10.1.2.1. Biotech Crops
- 10.1.2.2. Specialty Chemicals
- 10.1.2.3. Other Non-medical Products
- 10.1.1. Medical
- 10.2. Market Analysis, Insights and Forecast - by Component
- 10.2.1. Expression System
- 10.2.2. Cloning Vector
- 10.3. Market Analysis, Insights and Forecast - by Application
- 10.3.1. Food and Agriculture
- 10.3.2. Health and Disease
- 10.3.3. Environment
- 10.3.4. Other Applications
- 10.4. Market Analysis, Insights and Forecast - by End User
- 10.4.1. Biotechnology and Pharmaceutical Companies
- 10.4.2. Academic and Government Research Institutes
- 10.4.3. Other End Users
- 10.1. Market Analysis, Insights and Forecast - by Product
- 11. South America Recombinant DNA Technology Market Analysis, Insights and Forecast, 2020-2032
- 11.1. Market Analysis, Insights and Forecast - by Product
- 11.1.1. Medical
- 11.1.1.1. Therapeutic Agent
- 11.1.1.2. Human Protein
- 11.1.1.3. Vaccine
- 11.1.2. Non-medical
- 11.1.2.1. Biotech Crops
- 11.1.2.2. Specialty Chemicals
- 11.1.2.3. Other Non-medical Products
- 11.1.1. Medical
- 11.2. Market Analysis, Insights and Forecast - by Component
- 11.2.1. Expression System
- 11.2.2. Cloning Vector
- 11.3. Market Analysis, Insights and Forecast - by Application
- 11.3.1. Food and Agriculture
- 11.3.2. Health and Disease
- 11.3.3. Environment
- 11.3.4. Other Applications
- 11.4. Market Analysis, Insights and Forecast - by End User
- 11.4.1. Biotechnology and Pharmaceutical Companies
- 11.4.2. Academic and Government Research Institutes
- 11.4.3. Other End Users
- 11.1. Market Analysis, Insights and Forecast - by Product
- 12. Competitive Analysis
- 12.1. Company Profiles
- 12.1.1 Horizon Discovery
- 12.1.1.1. Company Overview
- 12.1.1.2. Products
- 12.1.1.3. Company Financials
- 12.1.1.4. SWOT Analysis
- 12.1.2 Merck KGaA
- 12.1.2.1. Company Overview
- 12.1.2.2. Products
- 12.1.2.3. Company Financials
- 12.1.2.4. SWOT Analysis
- 12.1.3 Sanofi
- 12.1.3.1. Company Overview
- 12.1.3.2. Products
- 12.1.3.3. Company Financials
- 12.1.3.4. SWOT Analysis
- 12.1.4 Novartis AG
- 12.1.4.1. Company Overview
- 12.1.4.2. Products
- 12.1.4.3. Company Financials
- 12.1.4.4. SWOT Analysis
- 12.1.5 Amgen Inc
- 12.1.5.1. Company Overview
- 12.1.5.2. Products
- 12.1.5.3. Company Financials
- 12.1.5.4. SWOT Analysis
- 12.1.6 Eli Lilly and Company
- 12.1.6.1. Company Overview
- 12.1.6.2. Products
- 12.1.6.3. Company Financials
- 12.1.6.4. SWOT Analysis
- 12.1.7 New England Biolabs
- 12.1.7.1. Company Overview
- 12.1.7.2. Products
- 12.1.7.3. Company Financials
- 12.1.7.4. SWOT Analysis
- 12.1.8 F Hoffmann-La Roche Ltd (Genentech Inc )
- 12.1.8.1. Company Overview
- 12.1.8.2. Products
- 12.1.8.3. Company Financials
- 12.1.8.4. SWOT Analysis
- 12.1.9 GenScript
- 12.1.9.1. Company Overview
- 12.1.9.2. Products
- 12.1.9.3. Company Financials
- 12.1.9.4. SWOT Analysis
- 12.1.10 Novo Nordisk A/S
- 12.1.10.1. Company Overview
- 12.1.10.2. Products
- 12.1.10.3. Company Financials
- 12.1.10.4. SWOT Analysis
- 12.1.11 Syngene International Limited
- 12.1.11.1. Company Overview
- 12.1.11.2. Products
- 12.1.11.3. Company Financials
- 12.1.11.4. SWOT Analysis
- 12.1.12 Pfizer Inc
- 12.1.12.1. Company Overview
- 12.1.12.2. Products
- 12.1.12.3. Company Financials
- 12.1.12.4. SWOT Analysis
- 12.1.1 Horizon Discovery
- 12.2. Market Entropy
- 12.2.1 Company's Key Areas Served
- 12.2.2 Recent Developments
- 12.3. Company Market Share Analysis 2025
- 12.3.1 Top 5 Companies Market Share Analysis
- 12.3.2 Top 3 Companies Market Share Analysis
- 12.4. List of Potential Customers
- 13. Research Methodology
List of Figures
- Figure 1: Global Recombinant DNA Technology Market Revenue Breakdown (billion, %) by Region 2025 & 2033
- Figure 2: Global Recombinant DNA Technology Market Volume Breakdown (K Unit, %) by Region 2025 & 2033
- Figure 3: North America Recombinant DNA Technology Market Revenue (billion), by Product 2025 & 2033
- Figure 4: North America Recombinant DNA Technology Market Volume (K Unit), by Product 2025 & 2033
- Figure 5: North America Recombinant DNA Technology Market Revenue Share (%), by Product 2025 & 2033
- Figure 6: North America Recombinant DNA Technology Market Volume Share (%), by Product 2025 & 2033
- Figure 7: North America Recombinant DNA Technology Market Revenue (billion), by Component 2025 & 2033
- Figure 8: North America Recombinant DNA Technology Market Volume (K Unit), by Component 2025 & 2033
- Figure 9: North America Recombinant DNA Technology Market Revenue Share (%), by Component 2025 & 2033
- Figure 10: North America Recombinant DNA Technology Market Volume Share (%), by Component 2025 & 2033
- Figure 11: North America Recombinant DNA Technology Market Revenue (billion), by Application 2025 & 2033
- Figure 12: North America Recombinant DNA Technology Market Volume (K Unit), by Application 2025 & 2033
- Figure 13: North America Recombinant DNA Technology Market Revenue Share (%), by Application 2025 & 2033
- Figure 14: North America Recombinant DNA Technology Market Volume Share (%), by Application 2025 & 2033
- Figure 15: North America Recombinant DNA Technology Market Revenue (billion), by End User 2025 & 2033
- Figure 16: North America Recombinant DNA Technology Market Volume (K Unit), by End User 2025 & 2033
- Figure 17: North America Recombinant DNA Technology Market Revenue Share (%), by End User 2025 & 2033
- Figure 18: North America Recombinant DNA Technology Market Volume Share (%), by End User 2025 & 2033
- Figure 19: North America Recombinant DNA Technology Market Revenue (billion), by Country 2025 & 2033
- Figure 20: North America Recombinant DNA Technology Market Volume (K Unit), by Country 2025 & 2033
- Figure 21: North America Recombinant DNA Technology Market Revenue Share (%), by Country 2025 & 2033
- Figure 22: North America Recombinant DNA Technology Market Volume Share (%), by Country 2025 & 2033
- Figure 23: Europe Recombinant DNA Technology Market Revenue (billion), by Product 2025 & 2033
- Figure 24: Europe Recombinant DNA Technology Market Volume (K Unit), by Product 2025 & 2033
- Figure 25: Europe Recombinant DNA Technology Market Revenue Share (%), by Product 2025 & 2033
- Figure 26: Europe Recombinant DNA Technology Market Volume Share (%), by Product 2025 & 2033
- Figure 27: Europe Recombinant DNA Technology Market Revenue (billion), by Component 2025 & 2033
- Figure 28: Europe Recombinant DNA Technology Market Volume (K Unit), by Component 2025 & 2033
- Figure 29: Europe Recombinant DNA Technology Market Revenue Share (%), by Component 2025 & 2033
- Figure 30: Europe Recombinant DNA Technology Market Volume Share (%), by Component 2025 & 2033
- Figure 31: Europe Recombinant DNA Technology Market Revenue (billion), by Application 2025 & 2033
- Figure 32: Europe Recombinant DNA Technology Market Volume (K Unit), by Application 2025 & 2033
- Figure 33: Europe Recombinant DNA Technology Market Revenue Share (%), by Application 2025 & 2033
- Figure 34: Europe Recombinant DNA Technology Market Volume Share (%), by Application 2025 & 2033
- Figure 35: Europe Recombinant DNA Technology Market Revenue (billion), by End User 2025 & 2033
- Figure 36: Europe Recombinant DNA Technology Market Volume (K Unit), by End User 2025 & 2033
- Figure 37: Europe Recombinant DNA Technology Market Revenue Share (%), by End User 2025 & 2033
- Figure 38: Europe Recombinant DNA Technology Market Volume Share (%), by End User 2025 & 2033
- Figure 39: Europe Recombinant DNA Technology Market Revenue (billion), by Country 2025 & 2033
- Figure 40: Europe Recombinant DNA Technology Market Volume (K Unit), by Country 2025 & 2033
- Figure 41: Europe Recombinant DNA Technology Market Revenue Share (%), by Country 2025 & 2033
- Figure 42: Europe Recombinant DNA Technology Market Volume Share (%), by Country 2025 & 2033
- Figure 43: Asia Pacific Recombinant DNA Technology Market Revenue (billion), by Product 2025 & 2033
- Figure 44: Asia Pacific Recombinant DNA Technology Market Volume (K Unit), by Product 2025 & 2033
- Figure 45: Asia Pacific Recombinant DNA Technology Market Revenue Share (%), by Product 2025 & 2033
- Figure 46: Asia Pacific Recombinant DNA Technology Market Volume Share (%), by Product 2025 & 2033
- Figure 47: Asia Pacific Recombinant DNA Technology Market Revenue (billion), by Component 2025 & 2033
- Figure 48: Asia Pacific Recombinant DNA Technology Market Volume (K Unit), by Component 2025 & 2033
- Figure 49: Asia Pacific Recombinant DNA Technology Market Revenue Share (%), by Component 2025 & 2033
- Figure 50: Asia Pacific Recombinant DNA Technology Market Volume Share (%), by Component 2025 & 2033
- Figure 51: Asia Pacific Recombinant DNA Technology Market Revenue (billion), by Application 2025 & 2033
- Figure 52: Asia Pacific Recombinant DNA Technology Market Volume (K Unit), by Application 2025 & 2033
- Figure 53: Asia Pacific Recombinant DNA Technology Market Revenue Share (%), by Application 2025 & 2033
- Figure 54: Asia Pacific Recombinant DNA Technology Market Volume Share (%), by Application 2025 & 2033
- Figure 55: Asia Pacific Recombinant DNA Technology Market Revenue (billion), by End User 2025 & 2033
- Figure 56: Asia Pacific Recombinant DNA Technology Market Volume (K Unit), by End User 2025 & 2033
- Figure 57: Asia Pacific Recombinant DNA Technology Market Revenue Share (%), by End User 2025 & 2033
- Figure 58: Asia Pacific Recombinant DNA Technology Market Volume Share (%), by End User 2025 & 2033
- Figure 59: Asia Pacific Recombinant DNA Technology Market Revenue (billion), by Country 2025 & 2033
- Figure 60: Asia Pacific Recombinant DNA Technology Market Volume (K Unit), by Country 2025 & 2033
- Figure 61: Asia Pacific Recombinant DNA Technology Market Revenue Share (%), by Country 2025 & 2033
- Figure 62: Asia Pacific Recombinant DNA Technology Market Volume Share (%), by Country 2025 & 2033
- Figure 63: Middle East and Africa Recombinant DNA Technology Market Revenue (billion), by Product 2025 & 2033
- Figure 64: Middle East and Africa Recombinant DNA Technology Market Volume (K Unit), by Product 2025 & 2033
- Figure 65: Middle East and Africa Recombinant DNA Technology Market Revenue Share (%), by Product 2025 & 2033
- Figure 66: Middle East and Africa Recombinant DNA Technology Market Volume Share (%), by Product 2025 & 2033
- Figure 67: Middle East and Africa Recombinant DNA Technology Market Revenue (billion), by Component 2025 & 2033
- Figure 68: Middle East and Africa Recombinant DNA Technology Market Volume (K Unit), by Component 2025 & 2033
- Figure 69: Middle East and Africa Recombinant DNA Technology Market Revenue Share (%), by Component 2025 & 2033
- Figure 70: Middle East and Africa Recombinant DNA Technology Market Volume Share (%), by Component 2025 & 2033
- Figure 71: Middle East and Africa Recombinant DNA Technology Market Revenue (billion), by Application 2025 & 2033
- Figure 72: Middle East and Africa Recombinant DNA Technology Market Volume (K Unit), by Application 2025 & 2033
- Figure 73: Middle East and Africa Recombinant DNA Technology Market Revenue Share (%), by Application 2025 & 2033
- Figure 74: Middle East and Africa Recombinant DNA Technology Market Volume Share (%), by Application 2025 & 2033
- Figure 75: Middle East and Africa Recombinant DNA Technology Market Revenue (billion), by End User 2025 & 2033
- Figure 76: Middle East and Africa Recombinant DNA Technology Market Volume (K Unit), by End User 2025 & 2033
- Figure 77: Middle East and Africa Recombinant DNA Technology Market Revenue Share (%), by End User 2025 & 2033
- Figure 78: Middle East and Africa Recombinant DNA Technology Market Volume Share (%), by End User 2025 & 2033
- Figure 79: Middle East and Africa Recombinant DNA Technology Market Revenue (billion), by Country 2025 & 2033
- Figure 80: Middle East and Africa Recombinant DNA Technology Market Volume (K Unit), by Country 2025 & 2033
- Figure 81: Middle East and Africa Recombinant DNA Technology Market Revenue Share (%), by Country 2025 & 2033
- Figure 82: Middle East and Africa Recombinant DNA Technology Market Volume Share (%), by Country 2025 & 2033
- Figure 83: South America Recombinant DNA Technology Market Revenue (billion), by Product 2025 & 2033
- Figure 84: South America Recombinant DNA Technology Market Volume (K Unit), by Product 2025 & 2033
- Figure 85: South America Recombinant DNA Technology Market Revenue Share (%), by Product 2025 & 2033
- Figure 86: South America Recombinant DNA Technology Market Volume Share (%), by Product 2025 & 2033
- Figure 87: South America Recombinant DNA Technology Market Revenue (billion), by Component 2025 & 2033
- Figure 88: South America Recombinant DNA Technology Market Volume (K Unit), by Component 2025 & 2033
- Figure 89: South America Recombinant DNA Technology Market Revenue Share (%), by Component 2025 & 2033
- Figure 90: South America Recombinant DNA Technology Market Volume Share (%), by Component 2025 & 2033
- Figure 91: South America Recombinant DNA Technology Market Revenue (billion), by Application 2025 & 2033
- Figure 92: South America Recombinant DNA Technology Market Volume (K Unit), by Application 2025 & 2033
- Figure 93: South America Recombinant DNA Technology Market Revenue Share (%), by Application 2025 & 2033
- Figure 94: South America Recombinant DNA Technology Market Volume Share (%), by Application 2025 & 2033
- Figure 95: South America Recombinant DNA Technology Market Revenue (billion), by End User 2025 & 2033
- Figure 96: South America Recombinant DNA Technology Market Volume (K Unit), by End User 2025 & 2033
- Figure 97: South America Recombinant DNA Technology Market Revenue Share (%), by End User 2025 & 2033
- Figure 98: South America Recombinant DNA Technology Market Volume Share (%), by End User 2025 & 2033
- Figure 99: South America Recombinant DNA Technology Market Revenue (billion), by Country 2025 & 2033
- Figure 100: South America Recombinant DNA Technology Market Volume (K Unit), by Country 2025 & 2033
- Figure 101: South America Recombinant DNA Technology Market Revenue Share (%), by Country 2025 & 2033
- Figure 102: South America Recombinant DNA Technology Market Volume Share (%), by Country 2025 & 2033
List of Tables
- Table 1: Global Recombinant DNA Technology Market Revenue billion Forecast, by Product 2020 & 2033
- Table 2: Global Recombinant DNA Technology Market Volume K Unit Forecast, by Product 2020 & 2033
- Table 3: Global Recombinant DNA Technology Market Revenue billion Forecast, by Component 2020 & 2033
- Table 4: Global Recombinant DNA Technology Market Volume K Unit Forecast, by Component 2020 & 2033
- Table 5: Global Recombinant DNA Technology Market Revenue billion Forecast, by Application 2020 & 2033
- Table 6: Global Recombinant DNA Technology Market Volume K Unit Forecast, by Application 2020 & 2033
- Table 7: Global Recombinant DNA Technology Market Revenue billion Forecast, by End User 2020 & 2033
- Table 8: Global Recombinant DNA Technology Market Volume K Unit Forecast, by End User 2020 & 2033
- Table 9: Global Recombinant DNA Technology Market Revenue billion Forecast, by Region 2020 & 2033
- Table 10: Global Recombinant DNA Technology Market Volume K Unit Forecast, by Region 2020 & 2033
- Table 11: Global Recombinant DNA Technology Market Revenue billion Forecast, by Product 2020 & 2033
- Table 12: Global Recombinant DNA Technology Market Volume K Unit Forecast, by Product 2020 & 2033
- Table 13: Global Recombinant DNA Technology Market Revenue billion Forecast, by Component 2020 & 2033
- Table 14: Global Recombinant DNA Technology Market Volume K Unit Forecast, by Component 2020 & 2033
- Table 15: Global Recombinant DNA Technology Market Revenue billion Forecast, by Application 2020 & 2033
- Table 16: Global Recombinant DNA Technology Market Volume K Unit Forecast, by Application 2020 & 2033
- Table 17: Global Recombinant DNA Technology Market Revenue billion Forecast, by End User 2020 & 2033
- Table 18: Global Recombinant DNA Technology Market Volume K Unit Forecast, by End User 2020 & 2033
- Table 19: Global Recombinant DNA Technology Market Revenue billion Forecast, by Country 2020 & 2033
- Table 20: Global Recombinant DNA Technology Market Volume K Unit Forecast, by Country 2020 & 2033
- Table 21: United States Recombinant DNA Technology Market Revenue (billion) Forecast, by Application 2020 & 2033
- Table 22: United States Recombinant DNA Technology Market Volume (K Unit) Forecast, by Application 2020 & 2033
- Table 23: Canada Recombinant DNA Technology Market Revenue (billion) Forecast, by Application 2020 & 2033
- Table 24: Canada Recombinant DNA Technology Market Volume (K Unit) Forecast, by Application 2020 & 2033
- Table 25: Mexico Recombinant DNA Technology Market Revenue (billion) Forecast, by Application 2020 & 2033
- Table 26: Mexico Recombinant DNA Technology Market Volume (K Unit) Forecast, by Application 2020 & 2033
- Table 27: Global Recombinant DNA Technology Market Revenue billion Forecast, by Product 2020 & 2033
- Table 28: Global Recombinant DNA Technology Market Volume K Unit Forecast, by Product 2020 & 2033
- Table 29: Global Recombinant DNA Technology Market Revenue billion Forecast, by Component 2020 & 2033
- Table 30: Global Recombinant DNA Technology Market Volume K Unit Forecast, by Component 2020 & 2033
- Table 31: Global Recombinant DNA Technology Market Revenue billion Forecast, by Application 2020 & 2033
- Table 32: Global Recombinant DNA Technology Market Volume K Unit Forecast, by Application 2020 & 2033
- Table 33: Global Recombinant DNA Technology Market Revenue billion Forecast, by End User 2020 & 2033
- Table 34: Global Recombinant DNA Technology Market Volume K Unit Forecast, by End User 2020 & 2033
- Table 35: Global Recombinant DNA Technology Market Revenue billion Forecast, by Country 2020 & 2033
- Table 36: Global Recombinant DNA Technology Market Volume K Unit Forecast, by Country 2020 & 2033
- Table 37: Germany Recombinant DNA Technology Market Revenue (billion) Forecast, by Application 2020 & 2033
- Table 38: Germany Recombinant DNA Technology Market Volume (K Unit) Forecast, by Application 2020 & 2033
- Table 39: United Kingdom Recombinant DNA Technology Market Revenue (billion) Forecast, by Application 2020 & 2033
- Table 40: United Kingdom Recombinant DNA Technology Market Volume (K Unit) Forecast, by Application 2020 & 2033
- Table 41: France Recombinant DNA Technology Market Revenue (billion) Forecast, by Application 2020 & 2033
- Table 42: France Recombinant DNA Technology Market Volume (K Unit) Forecast, by Application 2020 & 2033
- Table 43: Italy Recombinant DNA Technology Market Revenue (billion) Forecast, by Application 2020 & 2033
- Table 44: Italy Recombinant DNA Technology Market Volume (K Unit) Forecast, by Application 2020 & 2033
- Table 45: Spain Recombinant DNA Technology Market Revenue (billion) Forecast, by Application 2020 & 2033
- Table 46: Spain Recombinant DNA Technology Market Volume (K Unit) Forecast, by Application 2020 & 2033
- Table 47: Rest of Europe Recombinant DNA Technology Market Revenue (billion) Forecast, by Application 2020 & 2033
- Table 48: Rest of Europe Recombinant DNA Technology Market Volume (K Unit) Forecast, by Application 2020 & 2033
- Table 49: Global Recombinant DNA Technology Market Revenue billion Forecast, by Product 2020 & 2033
- Table 50: Global Recombinant DNA Technology Market Volume K Unit Forecast, by Product 2020 & 2033
- Table 51: Global Recombinant DNA Technology Market Revenue billion Forecast, by Component 2020 & 2033
- Table 52: Global Recombinant DNA Technology Market Volume K Unit Forecast, by Component 2020 & 2033
- Table 53: Global Recombinant DNA Technology Market Revenue billion Forecast, by Application 2020 & 2033
- Table 54: Global Recombinant DNA Technology Market Volume K Unit Forecast, by Application 2020 & 2033
- Table 55: Global Recombinant DNA Technology Market Revenue billion Forecast, by End User 2020 & 2033
- Table 56: Global Recombinant DNA Technology Market Volume K Unit Forecast, by End User 2020 & 2033
- Table 57: Global Recombinant DNA Technology Market Revenue billion Forecast, by Country 2020 & 2033
- Table 58: Global Recombinant DNA Technology Market Volume K Unit Forecast, by Country 2020 & 2033
- Table 59: China Recombinant DNA Technology Market Revenue (billion) Forecast, by Application 2020 & 2033
- Table 60: China Recombinant DNA Technology Market Volume (K Unit) Forecast, by Application 2020 & 2033
- Table 61: Japan Recombinant DNA Technology Market Revenue (billion) Forecast, by Application 2020 & 2033
- Table 62: Japan Recombinant DNA Technology Market Volume (K Unit) Forecast, by Application 2020 & 2033
- Table 63: India Recombinant DNA Technology Market Revenue (billion) Forecast, by Application 2020 & 2033
- Table 64: India Recombinant DNA Technology Market Volume (K Unit) Forecast, by Application 2020 & 2033
- Table 65: Australia Recombinant DNA Technology Market Revenue (billion) Forecast, by Application 2020 & 2033
- Table 66: Australia Recombinant DNA Technology Market Volume (K Unit) Forecast, by Application 2020 & 2033
- Table 67: South korea Recombinant DNA Technology Market Revenue (billion) Forecast, by Application 2020 & 2033
- Table 68: South korea Recombinant DNA Technology Market Volume (K Unit) Forecast, by Application 2020 & 2033
- Table 69: Rest of Asia Pacific Recombinant DNA Technology Market Revenue (billion) Forecast, by Application 2020 & 2033
- Table 70: Rest of Asia Pacific Recombinant DNA Technology Market Volume (K Unit) Forecast, by Application 2020 & 2033
- Table 71: Global Recombinant DNA Technology Market Revenue billion Forecast, by Product 2020 & 2033
- Table 72: Global Recombinant DNA Technology Market Volume K Unit Forecast, by Product 2020 & 2033
- Table 73: Global Recombinant DNA Technology Market Revenue billion Forecast, by Component 2020 & 2033
- Table 74: Global Recombinant DNA Technology Market Volume K Unit Forecast, by Component 2020 & 2033
- Table 75: Global Recombinant DNA Technology Market Revenue billion Forecast, by Application 2020 & 2033
- Table 76: Global Recombinant DNA Technology Market Volume K Unit Forecast, by Application 2020 & 2033
- Table 77: Global Recombinant DNA Technology Market Revenue billion Forecast, by End User 2020 & 2033
- Table 78: Global Recombinant DNA Technology Market Volume K Unit Forecast, by End User 2020 & 2033
- Table 79: Global Recombinant DNA Technology Market Revenue billion Forecast, by Country 2020 & 2033
- Table 80: Global Recombinant DNA Technology Market Volume K Unit Forecast, by Country 2020 & 2033
- Table 81: GCC Recombinant DNA Technology Market Revenue (billion) Forecast, by Application 2020 & 2033
- Table 82: GCC Recombinant DNA Technology Market Volume (K Unit) Forecast, by Application 2020 & 2033
- Table 83: South Africa Recombinant DNA Technology Market Revenue (billion) Forecast, by Application 2020 & 2033
- Table 84: South Africa Recombinant DNA Technology Market Volume (K Unit) Forecast, by Application 2020 & 2033
- Table 85: Rest of Middle East and Africa Recombinant DNA Technology Market Revenue (billion) Forecast, by Application 2020 & 2033
- Table 86: Rest of Middle East and Africa Recombinant DNA Technology Market Volume (K Unit) Forecast, by Application 2020 & 2033
- Table 87: Global Recombinant DNA Technology Market Revenue billion Forecast, by Product 2020 & 2033
- Table 88: Global Recombinant DNA Technology Market Volume K Unit Forecast, by Product 2020 & 2033
- Table 89: Global Recombinant DNA Technology Market Revenue billion Forecast, by Component 2020 & 2033
- Table 90: Global Recombinant DNA Technology Market Volume K Unit Forecast, by Component 2020 & 2033
- Table 91: Global Recombinant DNA Technology Market Revenue billion Forecast, by Application 2020 & 2033
- Table 92: Global Recombinant DNA Technology Market Volume K Unit Forecast, by Application 2020 & 2033
- Table 93: Global Recombinant DNA Technology Market Revenue billion Forecast, by End User 2020 & 2033
- Table 94: Global Recombinant DNA Technology Market Volume K Unit Forecast, by End User 2020 & 2033
- Table 95: Global Recombinant DNA Technology Market Revenue billion Forecast, by Country 2020 & 2033
- Table 96: Global Recombinant DNA Technology Market Volume K Unit Forecast, by Country 2020 & 2033
- Table 97: Brazil Recombinant DNA Technology Market Revenue (billion) Forecast, by Application 2020 & 2033
- Table 98: Brazil Recombinant DNA Technology Market Volume (K Unit) Forecast, by Application 2020 & 2033
- Table 99: Argentina Recombinant DNA Technology Market Revenue (billion) Forecast, by Application 2020 & 2033
- Table 100: Argentina Recombinant DNA Technology Market Volume (K Unit) Forecast, by Application 2020 & 2033
- Table 101: Rest of South America Recombinant DNA Technology Market Revenue (billion) Forecast, by Application 2020 & 2033
- Table 102: Rest of South America Recombinant DNA Technology Market Volume (K Unit) Forecast, by Application 2020 & 2033
Frequently Asked Questions
1. What is the projected Compound Annual Growth Rate (CAGR) of the Recombinant DNA Technology Market?
The projected CAGR is approximately 9.8%.
2. Which companies are prominent players in the Recombinant DNA Technology Market?
Key companies in the market include Horizon Discovery, Merck KGaA, Sanofi, Novartis AG, Amgen Inc, Eli Lilly and Company, New England Biolabs, F Hoffmann-La Roche Ltd (Genentech Inc ), GenScript, Novo Nordisk A/S, Syngene International Limited, Pfizer Inc.
3. What are the main segments of the Recombinant DNA Technology Market?
The market segments include Product, Component, Application, End User.
4. Can you provide details about the market size?
The market size is estimated to be USD 189.91 billion as of 2022.
5. What are some drivers contributing to market growth?
Technological Advancements in Genomics; Expansion of Biopharmaceutical Industry; Increasing Demand and Applications of Recombinant/ Genetically Modified Products.
6. What are the notable trends driving market growth?
The Food and Agriculture Segment is Expected to Register the High CAGR Over the Forecast Period.
7. Are there any restraints impacting market growth?
Regulatory. Scientific. and Ethical Challenges Associated with Gene Therapy.
8. Can you provide examples of recent developments in the market?
In March 2022, VBI Vaccines Inc. launched PreHevbrio (Recombinant Hepatitis B Vaccine) in the United States for the prevention of infection caused by all known subtypes of hepatitis B virus (HBV) in adults age 18 years and older.
9. What pricing options are available for accessing the report?
Pricing options include single-user, multi-user, and enterprise licenses priced at USD 4750, USD 5250, and USD 8750 respectively.
10. Is the market size provided in terms of value or volume?
The market size is provided in terms of value, measured in billion and volume, measured in K Unit.
11. Are there any specific market keywords associated with the report?
Yes, the market keyword associated with the report is "Recombinant DNA Technology Market," which aids in identifying and referencing the specific market segment covered.
12. How do I determine which pricing option suits my needs best?
The pricing options vary based on user requirements and access needs. Individual users may opt for single-user licenses, while businesses requiring broader access may choose multi-user or enterprise licenses for cost-effective access to the report.
13. Are there any additional resources or data provided in the Recombinant DNA Technology Market report?
While the report offers comprehensive insights, it's advisable to review the specific contents or supplementary materials provided to ascertain if additional resources or data are available.
14. How can I stay updated on further developments or reports in the Recombinant DNA Technology Market?
To stay informed about further developments, trends, and reports in the Recombinant DNA Technology Market, consider subscribing to industry newsletters, following relevant companies and organizations, or regularly checking reputable industry news sources and publications.
Methodology
Step 1 - Identification of Relevant Samples Size from Population Database


Step 2 - Approaches for Defining Global Market Size (Value, Volume* & Price*)

Note*: In applicable scenarios
Step 3 - Data Sources
Primary Research
- Web Analytics
- Survey Reports
- Research Institute
- Latest Research Reports
- Opinion Leaders
Secondary Research
- Annual Reports
- White Paper
- Latest Press Release
- Industry Association
- Paid Database
- Investor Presentations

Step 4 - Data Triangulation
Involves using different sources of information in order to increase the validity of a study
These sources are likely to be stakeholders in a program - participants, other researchers, program staff, other community members, and so on.
Then we put all data in single framework & apply various statistical tools to find out the dynamic on the market.
During the analysis stage, feedback from the stakeholder groups would be compared to determine areas of agreement as well as areas of divergence