
Key Insights
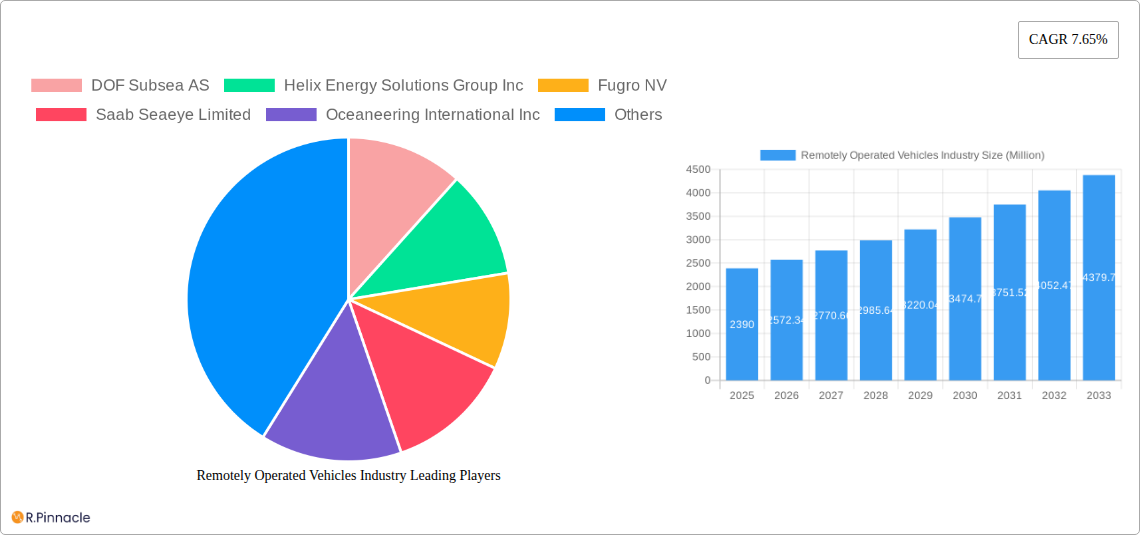
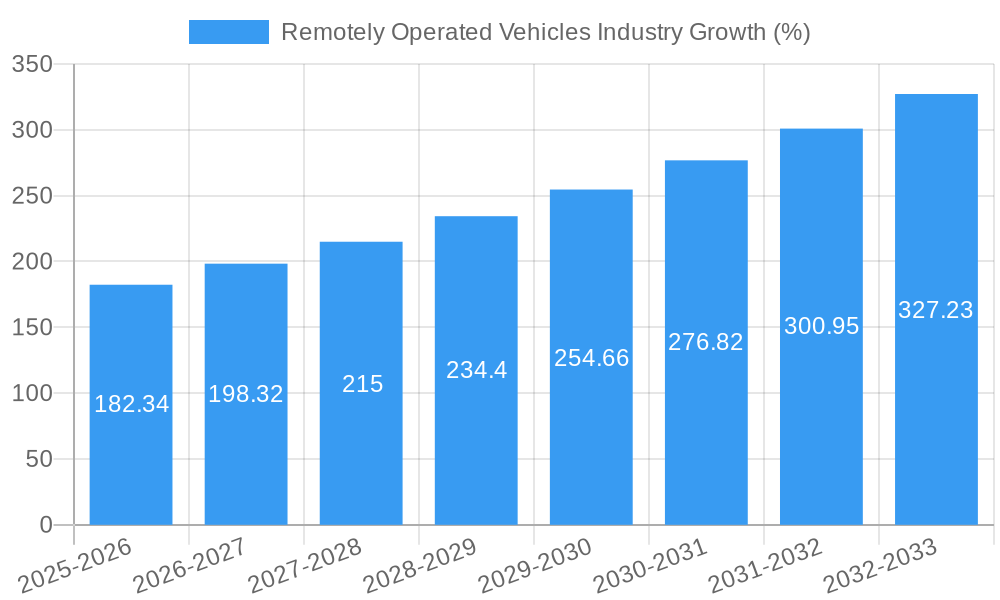
The Remotely Operated Vehicle (ROV) industry is experiencing robust growth, projected to reach a market size of $2.39 billion in 2025 and maintain a Compound Annual Growth Rate (CAGR) of 7.65% from 2025 to 2033. This expansion is driven by several key factors. The increasing demand for subsea infrastructure development in the oil and gas sector fuels significant ROV deployments for inspection, repair, and maintenance (IRM) activities. Furthermore, the rising focus on deep-sea marine exploration, driven by both scientific research and resource extraction, is propelling the adoption of advanced ROV systems capable of operating at extreme depths and in challenging environments. Growth is also fueled by advancements in ROV technology, leading to improved functionalities, enhanced maneuverability, and increased operational efficiency. The defense sector contributes significantly to market growth, utilizing ROVs for underwater surveillance, mine countermeasures, and other critical operations.
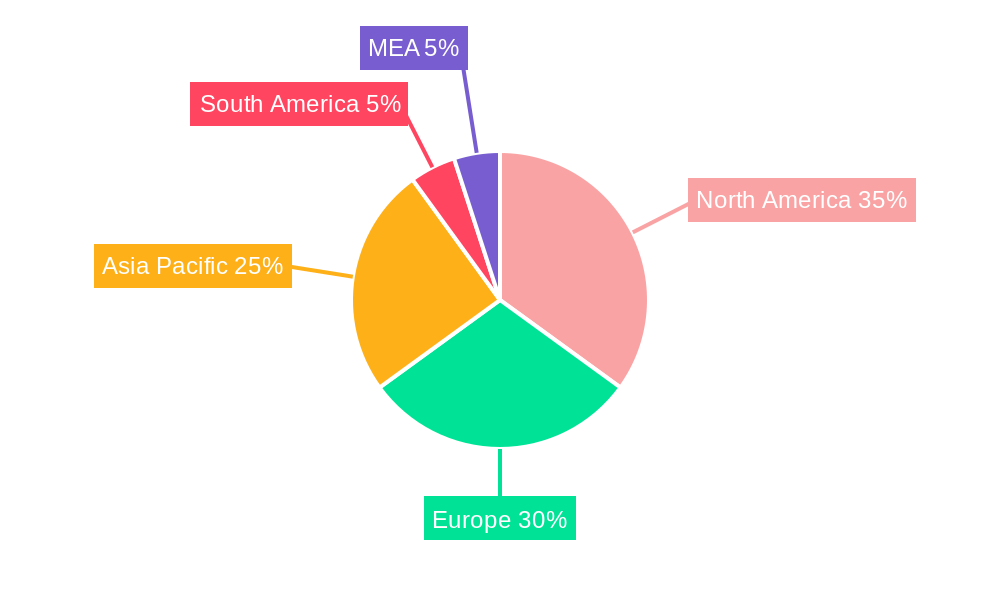
Market segmentation reveals strong growth across various applications. The oil and gas sector continues to dominate, but the defense and deep-sea exploration segments are rapidly expanding, presenting lucrative opportunities for ROV manufacturers. Within ROV types, Work Class ROVs maintain a significant market share due to their versatility and heavy-duty capabilities, while Observatory Class ROVs are witnessing increased demand for specific research and observation tasks. Geographically, North America and Europe currently hold substantial market shares, driven by established offshore oil and gas activities and strong defense budgets. However, the Asia-Pacific region, particularly China and Southeast Asia, exhibits the fastest growth trajectory due to rising investments in offshore infrastructure and increasing marine exploration activities. Major players in the industry include DOF Subsea AS, Helix Energy Solutions Group Inc., Fugro NV, Saab Seaeye Limited, and Oceaneering International Inc., each contributing to innovation and technological advancement within the sector.
Remotely Operated Vehicles (ROV) Industry Report: 2019-2033
This comprehensive report provides an in-depth analysis of the Remotely Operated Vehicles (ROV) industry, offering invaluable insights for industry professionals, investors, and strategic decision-makers. The study period covers 2019-2033, with a focus on the 2025-2033 forecast period. We analyze market trends, competitive dynamics, technological advancements, and future growth opportunities within the ROV market, valued at xx Million in 2025 and projected to reach xx Million by 2033.
Remotely Operated Vehicles Industry Market Structure & Innovation Trends
This section analyzes the competitive landscape, highlighting market concentration, innovation drivers, regulatory influences, and mergers and acquisitions (M&A) activity within the ROV industry. The report examines the market share distribution among key players, including DOF Subsea AS, Helix Energy Solutions Group Inc, Fugro NV, Saab Seaeye Limited, Oceaneering International Inc, Delta SubSea LLC, Saipem SpA, DeepOcean AS, Forum Energy Technologies Inc, ROVOP, TechnipFMC PLC, and Bourbon Corporation SA, amongst others.
- Market Concentration: The ROV market exhibits a moderately concentrated structure, with the top 10 players holding an estimated xx% market share in 2025.
- Innovation Drivers: Key innovation drivers include advancements in sensor technology, AI-powered autonomy, and improved underwater communication systems.
- Regulatory Frameworks: Regulations concerning offshore operations and environmental protection significantly impact ROV deployments and technological development.
- Product Substitutes: While limited, alternative technologies like autonomous underwater vehicles (AUVs) present some competitive pressure.
- M&A Activities: The report analyzes recent M&A activities, quantifying deal values where possible, showing a trend towards consolidation within the industry in the past five years at approximately xx Million.
Remotely Operated Vehicles Industry Market Dynamics & Trends
This section delves into the key market dynamics shaping the ROV industry. We examine market growth drivers, technological disruptions, evolving consumer preferences, and competitive pressures. The report projects a Compound Annual Growth Rate (CAGR) of xx% from 2025 to 2033, driven by factors such as increasing offshore energy exploration and a growing demand for underwater infrastructure inspection and maintenance. Market penetration within specific segments, such as deep-sea exploration and defense applications, is also analyzed. The evolving preferences towards remotely operated systems for increased safety and reduced operational costs also fuels this growth. Competitive dynamics are explored, focusing on strategies employed by leading players to maintain their market positions.
Dominant Regions & Segments in Remotely Operated Vehicles Industry
This section identifies the leading geographical regions and market segments within the ROV industry. The analysis covers key segments based on ROV type (Work Class ROV, Observatory Class ROV), application (Oil and Gas, Defense, Other Applications, Deep Sea Marine Exploration), and activity (Survey, Inspection, Repair, and Maintenance, Burial and Trenching, Other Activities).
Key Drivers:
- Oil and Gas: Increased exploration and production activities in offshore oil and gas fields drive demand for ROVs for inspection, maintenance, and repair.
- Defense: Military applications, including mine countermeasures and underwater surveillance, contribute significantly to ROV demand.
- Deep Sea Exploration: Growing interest in deep-sea mining and scientific research fuels the demand for advanced ROV systems.
Dominance Analysis: The report identifies [Region Name] as the leading region for ROV deployment due to [reasons, e.g., robust offshore energy sector, government initiatives, presence of key players]. The Oil and Gas segment represents the largest application market share, while Work Class ROVs dominate the market in terms of unit volume. Detailed analysis of each region and segment includes market size estimations and growth projections.
Remotely Operated Vehicles Industry Product Innovations
Recent years have witnessed significant advancements in ROV technology, focusing on improved maneuverability, enhanced sensor capabilities, and increased operational autonomy. The integration of artificial intelligence (AI) and machine learning (ML) is revolutionizing ROV operations, enabling more efficient and accurate underwater tasks. New features such as improved imaging systems, enhanced control systems, and increased depth ratings are constantly being introduced, driving improved market fit and competitive advantage. The development of smaller, more compact ROVs is also expanding their applications in various sectors.
Report Scope & Segmentation Analysis
This report provides a comprehensive segmentation of the ROV market based on ROV type (Work Class, Observatory Class), application (Oil & Gas, Defense, Other Applications, Deep Sea Exploration), and activity (Survey, Inspection, Repair & Maintenance, Burial & Trenching, Other Activities). Each segment's market size, growth projections, and competitive landscape are analyzed, providing a granular understanding of the market dynamics within each area. The report forecasts significant growth across all segments, with varying rates based on technological advancements and market demands. Specific figures for growth percentages and market sizes are detailed within the full report.
Key Drivers of Remotely Operated Vehicles Industry Growth
Several factors contribute to the growth of the ROV industry. Technological advancements, such as improved sensor technology and increased autonomy, are key drivers. The expanding offshore energy sector and increasing investments in underwater infrastructure projects further fuel market expansion. Furthermore, stricter environmental regulations encourage the adoption of ROVs for reduced environmental impact during subsea operations.
Challenges in the Remotely Operated Vehicles Industry Sector
Despite significant growth potential, the ROV industry faces certain challenges. High initial investment costs can be a barrier to entry for smaller companies. Supply chain disruptions can impact the availability of crucial components, potentially affecting production timelines and market delivery. Intense competition amongst established players can also limit profit margins and growth opportunities. These challenges, while present, are analyzed in detail to better understand their impact on the market.
Emerging Opportunities in Remotely Operated Vehicles Industry
The ROV market presents several emerging opportunities. The growing adoption of ROVs in new applications, such as aquaculture and underwater archaeology, presents significant untapped potential. Advancements in underwater robotics and the development of more efficient and cost-effective ROVs are expected to drive growth. The increasing demand for subsea infrastructure inspections and maintenance globally creates significant opportunities.
Leading Players in the Remotely Operated Vehicles Industry Market
- DOF Subsea AS
- Helix Energy Solutions Group Inc
- Fugro NV
- Saab Seaeye Limited
- Oceaneering International Inc
- Delta SubSea LLC
- Saipem SpA
- DeepOcean AS
- Forum Energy Technologies Inc
- ROVOP
- TechnipFMC PLC
- Bourbon Corporation SA
Key Developments in Remotely Operated Vehicles Industry
- April 2024: Forssea Robotics launched its ARGOS-X ROV designed for integration with uncrewed surface vessels and shallow water deployments.
- January 2024: Solstad Offshore expanded its fleet by equipping six vessels with ROVs and partnered with Omega Subsea for improved management and personnel.
- May 2023: Blueye Robotics secured contracts from the Norwegian Coast Guard to provide new ROV systems.
Future Outlook for Remotely Operated Vehicles Industry Market
The future of the ROV industry is promising, driven by continuous technological advancements and increasing demand across various sectors. The market is expected to witness significant growth fueled by exploration of new resources in deep waters, the expansion of renewable energy infrastructure, and a growing need for efficient and cost-effective subsea solutions. Strategic partnerships and investments in R&D are expected to further drive the growth and innovation within this dynamic industry.
Remotely Operated Vehicles Industry Segmentation
-
1. Type
- 1.1. Work Class ROV
- 1.2. Observatory Class ROV
-
2. Application
- 2.1. Oil and Gas
- 2.2. Defense
- 2.3. Other Applications
- 2.4. Deep Sea Marine Exploration
-
3. Activity
- 3.1. Survey
- 3.2. Inspection, Repair, and Maintenance
- 3.3. Burial and Trenching
- 3.4. Other Activities
Remotely Operated Vehicles Industry Segmentation By Geography
-
1. North America
- 1.1. United States
- 1.2. Canada
- 1.3. Rest of North America
-
2. Europe
- 2.1. Germany
- 2.2. Denmark
- 2.3. Norway
- 2.4. United Kingdom
- 2.5. Italy
- 2.6. NORDIC
- 2.7. Russia
- 2.8. France
- 2.9. Turkey
- 2.10. Rest of Europe
-
3. Asia Pacific
- 3.1. China
- 3.2. India
- 3.3. Japan
- 3.4. Australia
- 3.5. Thailand
- 3.6. Malaysia
- 3.7. Indonesia
- 3.8. Vietnam
- 3.9. Rest of Asia Pacific
-
4. South America
- 4.1. Brazil
- 4.2. Argentina
- 4.3. Colombia
- 4.4. Rest of South America
-
5. Middle East and Africa
- 5.1. Saudi Arabia
- 5.2. United Arab Emirates
- 5.3. Nigeria
- 5.4. South Africa
- 5.5. Qatar
- 5.6. Egypt
- 5.7. Rest of Middle East and Africa
Remotely Operated Vehicles Industry REPORT HIGHLIGHTS
| Aspects | Details |
|---|---|
| Study Period | 2019-2033 |
| Base Year | 2024 |
| Estimated Year | 2025 |
| Forecast Period | 2025-2033 |
| Historical Period | 2019-2024 |
| Growth Rate | CAGR of 7.65% from 2019-2033 |
| Segmentation |
|
Table of Contents
- 1. Introduction
- 1.1. Research Scope
- 1.2. Market Segmentation
- 1.3. Research Methodology
- 1.4. Definitions and Assumptions
- 2. Executive Summary
- 2.1. Introduction
- 3. Market Dynamics
- 3.1. Introduction
- 3.2. Market Drivers
- 3.2.1 4.; Increasing Offshore Oil & Gas Exploration Activities in the Americas
- 3.2.2 Asia-Pacific
- 3.2.3 and Middle East and Africa 4.; Growing Offshore Renewable Technologies
- 3.3. Market Restrains
- 3.3.1. 4.; Ban on Offshore Exploration and Production Activities in Multiple Regions
- 3.4. Market Trends
- 3.4.1. The Oil & Gas Application Segment is Expected to Dominate the Market
- 4. Market Factor Analysis
- 4.1. Porters Five Forces
- 4.2. Supply/Value Chain
- 4.3. PESTEL analysis
- 4.4. Market Entropy
- 4.5. Patent/Trademark Analysis
- 5. Global Remotely Operated Vehicles Industry Analysis, Insights and Forecast, 2019-2031
- 5.1. Market Analysis, Insights and Forecast - by Type
- 5.1.1. Work Class ROV
- 5.1.2. Observatory Class ROV
- 5.2. Market Analysis, Insights and Forecast - by Application
- 5.2.1. Oil and Gas
- 5.2.2. Defense
- 5.2.3. Other Applications
- 5.2.4. Deep Sea Marine Exploration
- 5.3. Market Analysis, Insights and Forecast - by Activity
- 5.3.1. Survey
- 5.3.2. Inspection, Repair, and Maintenance
- 5.3.3. Burial and Trenching
- 5.3.4. Other Activities
- 5.4. Market Analysis, Insights and Forecast - by Region
- 5.4.1. North America
- 5.4.2. Europe
- 5.4.3. Asia Pacific
- 5.4.4. South America
- 5.4.5. Middle East and Africa
- 5.1. Market Analysis, Insights and Forecast - by Type
- 6. North America Remotely Operated Vehicles Industry Analysis, Insights and Forecast, 2019-2031
- 6.1. Market Analysis, Insights and Forecast - by Type
- 6.1.1. Work Class ROV
- 6.1.2. Observatory Class ROV
- 6.2. Market Analysis, Insights and Forecast - by Application
- 6.2.1. Oil and Gas
- 6.2.2. Defense
- 6.2.3. Other Applications
- 6.2.4. Deep Sea Marine Exploration
- 6.3. Market Analysis, Insights and Forecast - by Activity
- 6.3.1. Survey
- 6.3.2. Inspection, Repair, and Maintenance
- 6.3.3. Burial and Trenching
- 6.3.4. Other Activities
- 6.1. Market Analysis, Insights and Forecast - by Type
- 7. Europe Remotely Operated Vehicles Industry Analysis, Insights and Forecast, 2019-2031
- 7.1. Market Analysis, Insights and Forecast - by Type
- 7.1.1. Work Class ROV
- 7.1.2. Observatory Class ROV
- 7.2. Market Analysis, Insights and Forecast - by Application
- 7.2.1. Oil and Gas
- 7.2.2. Defense
- 7.2.3. Other Applications
- 7.2.4. Deep Sea Marine Exploration
- 7.3. Market Analysis, Insights and Forecast - by Activity
- 7.3.1. Survey
- 7.3.2. Inspection, Repair, and Maintenance
- 7.3.3. Burial and Trenching
- 7.3.4. Other Activities
- 7.1. Market Analysis, Insights and Forecast - by Type
- 8. Asia Pacific Remotely Operated Vehicles Industry Analysis, Insights and Forecast, 2019-2031
- 8.1. Market Analysis, Insights and Forecast - by Type
- 8.1.1. Work Class ROV
- 8.1.2. Observatory Class ROV
- 8.2. Market Analysis, Insights and Forecast - by Application
- 8.2.1. Oil and Gas
- 8.2.2. Defense
- 8.2.3. Other Applications
- 8.2.4. Deep Sea Marine Exploration
- 8.3. Market Analysis, Insights and Forecast - by Activity
- 8.3.1. Survey
- 8.3.2. Inspection, Repair, and Maintenance
- 8.3.3. Burial and Trenching
- 8.3.4. Other Activities
- 8.1. Market Analysis, Insights and Forecast - by Type
- 9. South America Remotely Operated Vehicles Industry Analysis, Insights and Forecast, 2019-2031
- 9.1. Market Analysis, Insights and Forecast - by Type
- 9.1.1. Work Class ROV
- 9.1.2. Observatory Class ROV
- 9.2. Market Analysis, Insights and Forecast - by Application
- 9.2.1. Oil and Gas
- 9.2.2. Defense
- 9.2.3. Other Applications
- 9.2.4. Deep Sea Marine Exploration
- 9.3. Market Analysis, Insights and Forecast - by Activity
- 9.3.1. Survey
- 9.3.2. Inspection, Repair, and Maintenance
- 9.3.3. Burial and Trenching
- 9.3.4. Other Activities
- 9.1. Market Analysis, Insights and Forecast - by Type
- 10. Middle East and Africa Remotely Operated Vehicles Industry Analysis, Insights and Forecast, 2019-2031
- 10.1. Market Analysis, Insights and Forecast - by Type
- 10.1.1. Work Class ROV
- 10.1.2. Observatory Class ROV
- 10.2. Market Analysis, Insights and Forecast - by Application
- 10.2.1. Oil and Gas
- 10.2.2. Defense
- 10.2.3. Other Applications
- 10.2.4. Deep Sea Marine Exploration
- 10.3. Market Analysis, Insights and Forecast - by Activity
- 10.3.1. Survey
- 10.3.2. Inspection, Repair, and Maintenance
- 10.3.3. Burial and Trenching
- 10.3.4. Other Activities
- 10.1. Market Analysis, Insights and Forecast - by Type
- 11. North America Remotely Operated Vehicles Industry Analysis, Insights and Forecast, 2019-2031
- 11.1. Market Analysis, Insights and Forecast - By Country/Sub-region
- 11.1.1 United States
- 11.1.2 Canada
- 11.1.3 Mexico
- 12. Europe Remotely Operated Vehicles Industry Analysis, Insights and Forecast, 2019-2031
- 12.1. Market Analysis, Insights and Forecast - By Country/Sub-region
- 12.1.1 Germany
- 12.1.2 United Kingdom
- 12.1.3 France
- 12.1.4 Spain
- 12.1.5 Italy
- 12.1.6 Spain
- 12.1.7 Belgium
- 12.1.8 Netherland
- 12.1.9 Nordics
- 12.1.10 Rest of Europe
- 13. Asia Pacific Remotely Operated Vehicles Industry Analysis, Insights and Forecast, 2019-2031
- 13.1. Market Analysis, Insights and Forecast - By Country/Sub-region
- 13.1.1 China
- 13.1.2 Japan
- 13.1.3 India
- 13.1.4 South Korea
- 13.1.5 Southeast Asia
- 13.1.6 Australia
- 13.1.7 Indonesia
- 13.1.8 Phillipes
- 13.1.9 Singapore
- 13.1.10 Thailandc
- 13.1.11 Rest of Asia Pacific
- 14. South America Remotely Operated Vehicles Industry Analysis, Insights and Forecast, 2019-2031
- 14.1. Market Analysis, Insights and Forecast - By Country/Sub-region
- 14.1.1 Brazil
- 14.1.2 Argentina
- 14.1.3 Peru
- 14.1.4 Chile
- 14.1.5 Colombia
- 14.1.6 Ecuador
- 14.1.7 Venezuela
- 14.1.8 Rest of South America
- 15. North America Remotely Operated Vehicles Industry Analysis, Insights and Forecast, 2019-2031
- 15.1. Market Analysis, Insights and Forecast - By Country/Sub-region
- 15.1.1 United States
- 15.1.2 Canada
- 15.1.3 Mexico
- 16. MEA Remotely Operated Vehicles Industry Analysis, Insights and Forecast, 2019-2031
- 16.1. Market Analysis, Insights and Forecast - By Country/Sub-region
- 16.1.1 United Arab Emirates
- 16.1.2 Saudi Arabia
- 16.1.3 South Africa
- 16.1.4 Rest of Middle East and Africa
- 17. Competitive Analysis
- 17.1. Global Market Share Analysis 2024
- 17.2. Company Profiles
- 17.2.1 DOF Subsea AS
- 17.2.1.1. Overview
- 17.2.1.2. Products
- 17.2.1.3. SWOT Analysis
- 17.2.1.4. Recent Developments
- 17.2.1.5. Financials (Based on Availability)
- 17.2.2 Helix Energy Solutions Group Inc
- 17.2.2.1. Overview
- 17.2.2.2. Products
- 17.2.2.3. SWOT Analysis
- 17.2.2.4. Recent Developments
- 17.2.2.5. Financials (Based on Availability)
- 17.2.3 Fugro NV
- 17.2.3.1. Overview
- 17.2.3.2. Products
- 17.2.3.3. SWOT Analysis
- 17.2.3.4. Recent Developments
- 17.2.3.5. Financials (Based on Availability)
- 17.2.4 Saab Seaeye Limited
- 17.2.4.1. Overview
- 17.2.4.2. Products
- 17.2.4.3. SWOT Analysis
- 17.2.4.4. Recent Developments
- 17.2.4.5. Financials (Based on Availability)
- 17.2.5 Oceaneering International Inc
- 17.2.5.1. Overview
- 17.2.5.2. Products
- 17.2.5.3. SWOT Analysis
- 17.2.5.4. Recent Developments
- 17.2.5.5. Financials (Based on Availability)
- 17.2.6 Delta SubSea LLC
- 17.2.6.1. Overview
- 17.2.6.2. Products
- 17.2.6.3. SWOT Analysis
- 17.2.6.4. Recent Developments
- 17.2.6.5. Financials (Based on Availability)
- 17.2.7 Saipem SpA
- 17.2.7.1. Overview
- 17.2.7.2. Products
- 17.2.7.3. SWOT Analysis
- 17.2.7.4. Recent Developments
- 17.2.7.5. Financials (Based on Availability)
- 17.2.8 DeepOcean AS
- 17.2.8.1. Overview
- 17.2.8.2. Products
- 17.2.8.3. SWOT Analysis
- 17.2.8.4. Recent Developments
- 17.2.8.5. Financials (Based on Availability)
- 17.2.9 Forum Energy Technologies Inc
- 17.2.9.1. Overview
- 17.2.9.2. Products
- 17.2.9.3. SWOT Analysis
- 17.2.9.4. Recent Developments
- 17.2.9.5. Financials (Based on Availability)
- 17.2.10 ROVOP*List Not Exhaustive 6 4 List of Other Prominent Players6 5 Market Ranking/Share (%) Analysi
- 17.2.10.1. Overview
- 17.2.10.2. Products
- 17.2.10.3. SWOT Analysis
- 17.2.10.4. Recent Developments
- 17.2.10.5. Financials (Based on Availability)
- 17.2.11 TechnipFMC PLC
- 17.2.11.1. Overview
- 17.2.11.2. Products
- 17.2.11.3. SWOT Analysis
- 17.2.11.4. Recent Developments
- 17.2.11.5. Financials (Based on Availability)
- 17.2.12 Bourbon Corporation SA
- 17.2.12.1. Overview
- 17.2.12.2. Products
- 17.2.12.3. SWOT Analysis
- 17.2.12.4. Recent Developments
- 17.2.12.5. Financials (Based on Availability)
- 17.2.1 DOF Subsea AS
List of Figures
- Figure 1: Global Remotely Operated Vehicles Industry Revenue Breakdown (Million, %) by Region 2024 & 2032
- Figure 2: North America Remotely Operated Vehicles Industry Revenue (Million), by Country 2024 & 2032
- Figure 3: North America Remotely Operated Vehicles Industry Revenue Share (%), by Country 2024 & 2032
- Figure 4: Europe Remotely Operated Vehicles Industry Revenue (Million), by Country 2024 & 2032
- Figure 5: Europe Remotely Operated Vehicles Industry Revenue Share (%), by Country 2024 & 2032
- Figure 6: Asia Pacific Remotely Operated Vehicles Industry Revenue (Million), by Country 2024 & 2032
- Figure 7: Asia Pacific Remotely Operated Vehicles Industry Revenue Share (%), by Country 2024 & 2032
- Figure 8: South America Remotely Operated Vehicles Industry Revenue (Million), by Country 2024 & 2032
- Figure 9: South America Remotely Operated Vehicles Industry Revenue Share (%), by Country 2024 & 2032
- Figure 10: North America Remotely Operated Vehicles Industry Revenue (Million), by Country 2024 & 2032
- Figure 11: North America Remotely Operated Vehicles Industry Revenue Share (%), by Country 2024 & 2032
- Figure 12: MEA Remotely Operated Vehicles Industry Revenue (Million), by Country 2024 & 2032
- Figure 13: MEA Remotely Operated Vehicles Industry Revenue Share (%), by Country 2024 & 2032
- Figure 14: North America Remotely Operated Vehicles Industry Revenue (Million), by Type 2024 & 2032
- Figure 15: North America Remotely Operated Vehicles Industry Revenue Share (%), by Type 2024 & 2032
- Figure 16: North America Remotely Operated Vehicles Industry Revenue (Million), by Application 2024 & 2032
- Figure 17: North America Remotely Operated Vehicles Industry Revenue Share (%), by Application 2024 & 2032
- Figure 18: North America Remotely Operated Vehicles Industry Revenue (Million), by Activity 2024 & 2032
- Figure 19: North America Remotely Operated Vehicles Industry Revenue Share (%), by Activity 2024 & 2032
- Figure 20: North America Remotely Operated Vehicles Industry Revenue (Million), by Country 2024 & 2032
- Figure 21: North America Remotely Operated Vehicles Industry Revenue Share (%), by Country 2024 & 2032
- Figure 22: Europe Remotely Operated Vehicles Industry Revenue (Million), by Type 2024 & 2032
- Figure 23: Europe Remotely Operated Vehicles Industry Revenue Share (%), by Type 2024 & 2032
- Figure 24: Europe Remotely Operated Vehicles Industry Revenue (Million), by Application 2024 & 2032
- Figure 25: Europe Remotely Operated Vehicles Industry Revenue Share (%), by Application 2024 & 2032
- Figure 26: Europe Remotely Operated Vehicles Industry Revenue (Million), by Activity 2024 & 2032
- Figure 27: Europe Remotely Operated Vehicles Industry Revenue Share (%), by Activity 2024 & 2032
- Figure 28: Europe Remotely Operated Vehicles Industry Revenue (Million), by Country 2024 & 2032
- Figure 29: Europe Remotely Operated Vehicles Industry Revenue Share (%), by Country 2024 & 2032
- Figure 30: Asia Pacific Remotely Operated Vehicles Industry Revenue (Million), by Type 2024 & 2032
- Figure 31: Asia Pacific Remotely Operated Vehicles Industry Revenue Share (%), by Type 2024 & 2032
- Figure 32: Asia Pacific Remotely Operated Vehicles Industry Revenue (Million), by Application 2024 & 2032
- Figure 33: Asia Pacific Remotely Operated Vehicles Industry Revenue Share (%), by Application 2024 & 2032
- Figure 34: Asia Pacific Remotely Operated Vehicles Industry Revenue (Million), by Activity 2024 & 2032
- Figure 35: Asia Pacific Remotely Operated Vehicles Industry Revenue Share (%), by Activity 2024 & 2032
- Figure 36: Asia Pacific Remotely Operated Vehicles Industry Revenue (Million), by Country 2024 & 2032
- Figure 37: Asia Pacific Remotely Operated Vehicles Industry Revenue Share (%), by Country 2024 & 2032
- Figure 38: South America Remotely Operated Vehicles Industry Revenue (Million), by Type 2024 & 2032
- Figure 39: South America Remotely Operated Vehicles Industry Revenue Share (%), by Type 2024 & 2032
- Figure 40: South America Remotely Operated Vehicles Industry Revenue (Million), by Application 2024 & 2032
- Figure 41: South America Remotely Operated Vehicles Industry Revenue Share (%), by Application 2024 & 2032
- Figure 42: South America Remotely Operated Vehicles Industry Revenue (Million), by Activity 2024 & 2032
- Figure 43: South America Remotely Operated Vehicles Industry Revenue Share (%), by Activity 2024 & 2032
- Figure 44: South America Remotely Operated Vehicles Industry Revenue (Million), by Country 2024 & 2032
- Figure 45: South America Remotely Operated Vehicles Industry Revenue Share (%), by Country 2024 & 2032
- Figure 46: Middle East and Africa Remotely Operated Vehicles Industry Revenue (Million), by Type 2024 & 2032
- Figure 47: Middle East and Africa Remotely Operated Vehicles Industry Revenue Share (%), by Type 2024 & 2032
- Figure 48: Middle East and Africa Remotely Operated Vehicles Industry Revenue (Million), by Application 2024 & 2032
- Figure 49: Middle East and Africa Remotely Operated Vehicles Industry Revenue Share (%), by Application 2024 & 2032
- Figure 50: Middle East and Africa Remotely Operated Vehicles Industry Revenue (Million), by Activity 2024 & 2032
- Figure 51: Middle East and Africa Remotely Operated Vehicles Industry Revenue Share (%), by Activity 2024 & 2032
- Figure 52: Middle East and Africa Remotely Operated Vehicles Industry Revenue (Million), by Country 2024 & 2032
- Figure 53: Middle East and Africa Remotely Operated Vehicles Industry Revenue Share (%), by Country 2024 & 2032
List of Tables
- Table 1: Global Remotely Operated Vehicles Industry Revenue Million Forecast, by Region 2019 & 2032
- Table 2: Global Remotely Operated Vehicles Industry Revenue Million Forecast, by Type 2019 & 2032
- Table 3: Global Remotely Operated Vehicles Industry Revenue Million Forecast, by Application 2019 & 2032
- Table 4: Global Remotely Operated Vehicles Industry Revenue Million Forecast, by Activity 2019 & 2032
- Table 5: Global Remotely Operated Vehicles Industry Revenue Million Forecast, by Region 2019 & 2032
- Table 6: Global Remotely Operated Vehicles Industry Revenue Million Forecast, by Country 2019 & 2032
- Table 7: United States Remotely Operated Vehicles Industry Revenue (Million) Forecast, by Application 2019 & 2032
- Table 8: Canada Remotely Operated Vehicles Industry Revenue (Million) Forecast, by Application 2019 & 2032
- Table 9: Mexico Remotely Operated Vehicles Industry Revenue (Million) Forecast, by Application 2019 & 2032
- Table 10: Global Remotely Operated Vehicles Industry Revenue Million Forecast, by Country 2019 & 2032
- Table 11: Germany Remotely Operated Vehicles Industry Revenue (Million) Forecast, by Application 2019 & 2032
- Table 12: United Kingdom Remotely Operated Vehicles Industry Revenue (Million) Forecast, by Application 2019 & 2032
- Table 13: France Remotely Operated Vehicles Industry Revenue (Million) Forecast, by Application 2019 & 2032
- Table 14: Spain Remotely Operated Vehicles Industry Revenue (Million) Forecast, by Application 2019 & 2032
- Table 15: Italy Remotely Operated Vehicles Industry Revenue (Million) Forecast, by Application 2019 & 2032
- Table 16: Spain Remotely Operated Vehicles Industry Revenue (Million) Forecast, by Application 2019 & 2032
- Table 17: Belgium Remotely Operated Vehicles Industry Revenue (Million) Forecast, by Application 2019 & 2032
- Table 18: Netherland Remotely Operated Vehicles Industry Revenue (Million) Forecast, by Application 2019 & 2032
- Table 19: Nordics Remotely Operated Vehicles Industry Revenue (Million) Forecast, by Application 2019 & 2032
- Table 20: Rest of Europe Remotely Operated Vehicles Industry Revenue (Million) Forecast, by Application 2019 & 2032
- Table 21: Global Remotely Operated Vehicles Industry Revenue Million Forecast, by Country 2019 & 2032
- Table 22: China Remotely Operated Vehicles Industry Revenue (Million) Forecast, by Application 2019 & 2032
- Table 23: Japan Remotely Operated Vehicles Industry Revenue (Million) Forecast, by Application 2019 & 2032
- Table 24: India Remotely Operated Vehicles Industry Revenue (Million) Forecast, by Application 2019 & 2032
- Table 25: South Korea Remotely Operated Vehicles Industry Revenue (Million) Forecast, by Application 2019 & 2032
- Table 26: Southeast Asia Remotely Operated Vehicles Industry Revenue (Million) Forecast, by Application 2019 & 2032
- Table 27: Australia Remotely Operated Vehicles Industry Revenue (Million) Forecast, by Application 2019 & 2032
- Table 28: Indonesia Remotely Operated Vehicles Industry Revenue (Million) Forecast, by Application 2019 & 2032
- Table 29: Phillipes Remotely Operated Vehicles Industry Revenue (Million) Forecast, by Application 2019 & 2032
- Table 30: Singapore Remotely Operated Vehicles Industry Revenue (Million) Forecast, by Application 2019 & 2032
- Table 31: Thailandc Remotely Operated Vehicles Industry Revenue (Million) Forecast, by Application 2019 & 2032
- Table 32: Rest of Asia Pacific Remotely Operated Vehicles Industry Revenue (Million) Forecast, by Application 2019 & 2032
- Table 33: Global Remotely Operated Vehicles Industry Revenue Million Forecast, by Country 2019 & 2032
- Table 34: Brazil Remotely Operated Vehicles Industry Revenue (Million) Forecast, by Application 2019 & 2032
- Table 35: Argentina Remotely Operated Vehicles Industry Revenue (Million) Forecast, by Application 2019 & 2032
- Table 36: Peru Remotely Operated Vehicles Industry Revenue (Million) Forecast, by Application 2019 & 2032
- Table 37: Chile Remotely Operated Vehicles Industry Revenue (Million) Forecast, by Application 2019 & 2032
- Table 38: Colombia Remotely Operated Vehicles Industry Revenue (Million) Forecast, by Application 2019 & 2032
- Table 39: Ecuador Remotely Operated Vehicles Industry Revenue (Million) Forecast, by Application 2019 & 2032
- Table 40: Venezuela Remotely Operated Vehicles Industry Revenue (Million) Forecast, by Application 2019 & 2032
- Table 41: Rest of South America Remotely Operated Vehicles Industry Revenue (Million) Forecast, by Application 2019 & 2032
- Table 42: Global Remotely Operated Vehicles Industry Revenue Million Forecast, by Country 2019 & 2032
- Table 43: United States Remotely Operated Vehicles Industry Revenue (Million) Forecast, by Application 2019 & 2032
- Table 44: Canada Remotely Operated Vehicles Industry Revenue (Million) Forecast, by Application 2019 & 2032
- Table 45: Mexico Remotely Operated Vehicles Industry Revenue (Million) Forecast, by Application 2019 & 2032
- Table 46: Global Remotely Operated Vehicles Industry Revenue Million Forecast, by Country 2019 & 2032
- Table 47: United Arab Emirates Remotely Operated Vehicles Industry Revenue (Million) Forecast, by Application 2019 & 2032
- Table 48: Saudi Arabia Remotely Operated Vehicles Industry Revenue (Million) Forecast, by Application 2019 & 2032
- Table 49: South Africa Remotely Operated Vehicles Industry Revenue (Million) Forecast, by Application 2019 & 2032
- Table 50: Rest of Middle East and Africa Remotely Operated Vehicles Industry Revenue (Million) Forecast, by Application 2019 & 2032
- Table 51: Global Remotely Operated Vehicles Industry Revenue Million Forecast, by Type 2019 & 2032
- Table 52: Global Remotely Operated Vehicles Industry Revenue Million Forecast, by Application 2019 & 2032
- Table 53: Global Remotely Operated Vehicles Industry Revenue Million Forecast, by Activity 2019 & 2032
- Table 54: Global Remotely Operated Vehicles Industry Revenue Million Forecast, by Country 2019 & 2032
- Table 55: United States Remotely Operated Vehicles Industry Revenue (Million) Forecast, by Application 2019 & 2032
- Table 56: Canada Remotely Operated Vehicles Industry Revenue (Million) Forecast, by Application 2019 & 2032
- Table 57: Rest of North America Remotely Operated Vehicles Industry Revenue (Million) Forecast, by Application 2019 & 2032
- Table 58: Global Remotely Operated Vehicles Industry Revenue Million Forecast, by Type 2019 & 2032
- Table 59: Global Remotely Operated Vehicles Industry Revenue Million Forecast, by Application 2019 & 2032
- Table 60: Global Remotely Operated Vehicles Industry Revenue Million Forecast, by Activity 2019 & 2032
- Table 61: Global Remotely Operated Vehicles Industry Revenue Million Forecast, by Country 2019 & 2032
- Table 62: Germany Remotely Operated Vehicles Industry Revenue (Million) Forecast, by Application 2019 & 2032
- Table 63: Denmark Remotely Operated Vehicles Industry Revenue (Million) Forecast, by Application 2019 & 2032
- Table 64: Norway Remotely Operated Vehicles Industry Revenue (Million) Forecast, by Application 2019 & 2032
- Table 65: United Kingdom Remotely Operated Vehicles Industry Revenue (Million) Forecast, by Application 2019 & 2032
- Table 66: Italy Remotely Operated Vehicles Industry Revenue (Million) Forecast, by Application 2019 & 2032
- Table 67: NORDIC Remotely Operated Vehicles Industry Revenue (Million) Forecast, by Application 2019 & 2032
- Table 68: Russia Remotely Operated Vehicles Industry Revenue (Million) Forecast, by Application 2019 & 2032
- Table 69: France Remotely Operated Vehicles Industry Revenue (Million) Forecast, by Application 2019 & 2032
- Table 70: Turkey Remotely Operated Vehicles Industry Revenue (Million) Forecast, by Application 2019 & 2032
- Table 71: Rest of Europe Remotely Operated Vehicles Industry Revenue (Million) Forecast, by Application 2019 & 2032
- Table 72: Global Remotely Operated Vehicles Industry Revenue Million Forecast, by Type 2019 & 2032
- Table 73: Global Remotely Operated Vehicles Industry Revenue Million Forecast, by Application 2019 & 2032
- Table 74: Global Remotely Operated Vehicles Industry Revenue Million Forecast, by Activity 2019 & 2032
- Table 75: Global Remotely Operated Vehicles Industry Revenue Million Forecast, by Country 2019 & 2032
- Table 76: China Remotely Operated Vehicles Industry Revenue (Million) Forecast, by Application 2019 & 2032
- Table 77: India Remotely Operated Vehicles Industry Revenue (Million) Forecast, by Application 2019 & 2032
- Table 78: Japan Remotely Operated Vehicles Industry Revenue (Million) Forecast, by Application 2019 & 2032
- Table 79: Australia Remotely Operated Vehicles Industry Revenue (Million) Forecast, by Application 2019 & 2032
- Table 80: Thailand Remotely Operated Vehicles Industry Revenue (Million) Forecast, by Application 2019 & 2032
- Table 81: Malaysia Remotely Operated Vehicles Industry Revenue (Million) Forecast, by Application 2019 & 2032
- Table 82: Indonesia Remotely Operated Vehicles Industry Revenue (Million) Forecast, by Application 2019 & 2032
- Table 83: Vietnam Remotely Operated Vehicles Industry Revenue (Million) Forecast, by Application 2019 & 2032
- Table 84: Rest of Asia Pacific Remotely Operated Vehicles Industry Revenue (Million) Forecast, by Application 2019 & 2032
- Table 85: Global Remotely Operated Vehicles Industry Revenue Million Forecast, by Type 2019 & 2032
- Table 86: Global Remotely Operated Vehicles Industry Revenue Million Forecast, by Application 2019 & 2032
- Table 87: Global Remotely Operated Vehicles Industry Revenue Million Forecast, by Activity 2019 & 2032
- Table 88: Global Remotely Operated Vehicles Industry Revenue Million Forecast, by Country 2019 & 2032
- Table 89: Brazil Remotely Operated Vehicles Industry Revenue (Million) Forecast, by Application 2019 & 2032
- Table 90: Argentina Remotely Operated Vehicles Industry Revenue (Million) Forecast, by Application 2019 & 2032
- Table 91: Colombia Remotely Operated Vehicles Industry Revenue (Million) Forecast, by Application 2019 & 2032
- Table 92: Rest of South America Remotely Operated Vehicles Industry Revenue (Million) Forecast, by Application 2019 & 2032
- Table 93: Global Remotely Operated Vehicles Industry Revenue Million Forecast, by Type 2019 & 2032
- Table 94: Global Remotely Operated Vehicles Industry Revenue Million Forecast, by Application 2019 & 2032
- Table 95: Global Remotely Operated Vehicles Industry Revenue Million Forecast, by Activity 2019 & 2032
- Table 96: Global Remotely Operated Vehicles Industry Revenue Million Forecast, by Country 2019 & 2032
- Table 97: Saudi Arabia Remotely Operated Vehicles Industry Revenue (Million) Forecast, by Application 2019 & 2032
- Table 98: United Arab Emirates Remotely Operated Vehicles Industry Revenue (Million) Forecast, by Application 2019 & 2032
- Table 99: Nigeria Remotely Operated Vehicles Industry Revenue (Million) Forecast, by Application 2019 & 2032
- Table 100: South Africa Remotely Operated Vehicles Industry Revenue (Million) Forecast, by Application 2019 & 2032
- Table 101: Qatar Remotely Operated Vehicles Industry Revenue (Million) Forecast, by Application 2019 & 2032
- Table 102: Egypt Remotely Operated Vehicles Industry Revenue (Million) Forecast, by Application 2019 & 2032
- Table 103: Rest of Middle East and Africa Remotely Operated Vehicles Industry Revenue (Million) Forecast, by Application 2019 & 2032
Frequently Asked Questions
1. What is the projected Compound Annual Growth Rate (CAGR) of the Remotely Operated Vehicles Industry?
The projected CAGR is approximately 7.65%.
2. Which companies are prominent players in the Remotely Operated Vehicles Industry?
Key companies in the market include DOF Subsea AS, Helix Energy Solutions Group Inc, Fugro NV, Saab Seaeye Limited, Oceaneering International Inc, Delta SubSea LLC, Saipem SpA, DeepOcean AS, Forum Energy Technologies Inc, ROVOP*List Not Exhaustive 6 4 List of Other Prominent Players6 5 Market Ranking/Share (%) Analysi, TechnipFMC PLC, Bourbon Corporation SA.
3. What are the main segments of the Remotely Operated Vehicles Industry?
The market segments include Type, Application, Activity.
4. Can you provide details about the market size?
The market size is estimated to be USD 2.39 Million as of 2022.
5. What are some drivers contributing to market growth?
4.; Increasing Offshore Oil & Gas Exploration Activities in the Americas. Asia-Pacific. and Middle East and Africa 4.; Growing Offshore Renewable Technologies.
6. What are the notable trends driving market growth?
The Oil & Gas Application Segment is Expected to Dominate the Market.
7. Are there any restraints impacting market growth?
4.; Ban on Offshore Exploration and Production Activities in Multiple Regions.
8. Can you provide examples of recent developments in the market?
April 2024: Forssea Robotics, a French company, introduced its remotely operated vehicle (ROV) ARGOS-X. The vehicle is developed for integration with uncrewed surface vessels and shallow water deployments.
9. What pricing options are available for accessing the report?
Pricing options include single-user, multi-user, and enterprise licenses priced at USD 4750, USD 5250, and USD 8750 respectively.
10. Is the market size provided in terms of value or volume?
The market size is provided in terms of value, measured in Million.
11. Are there any specific market keywords associated with the report?
Yes, the market keyword associated with the report is "Remotely Operated Vehicles Industry," which aids in identifying and referencing the specific market segment covered.
12. How do I determine which pricing option suits my needs best?
The pricing options vary based on user requirements and access needs. Individual users may opt for single-user licenses, while businesses requiring broader access may choose multi-user or enterprise licenses for cost-effective access to the report.
13. Are there any additional resources or data provided in the Remotely Operated Vehicles Industry report?
While the report offers comprehensive insights, it's advisable to review the specific contents or supplementary materials provided to ascertain if additional resources or data are available.
14. How can I stay updated on further developments or reports in the Remotely Operated Vehicles Industry?
To stay informed about further developments, trends, and reports in the Remotely Operated Vehicles Industry, consider subscribing to industry newsletters, following relevant companies and organizations, or regularly checking reputable industry news sources and publications.
Methodology
Step 1 - Identification of Relevant Samples Size from Population Database


Step 2 - Approaches for Defining Global Market Size (Value, Volume* & Price*)

Note*: In applicable scenarios
Step 3 - Data Sources
Primary Research
- Web Analytics
- Survey Reports
- Research Institute
- Latest Research Reports
- Opinion Leaders
Secondary Research
- Annual Reports
- White Paper
- Latest Press Release
- Industry Association
- Paid Database
- Investor Presentations

Step 4 - Data Triangulation
Involves using different sources of information in order to increase the validity of a study
These sources are likely to be stakeholders in a program - participants, other researchers, program staff, other community members, and so on.
Then we put all data in single framework & apply various statistical tools to find out the dynamic on the market.
During the analysis stage, feedback from the stakeholder groups would be compared to determine areas of agreement as well as areas of divergence


