

Key Insights
The renewable energy inverter market is poised for significant expansion, propelled by the global shift to sustainable energy solutions. With an estimated market size of $11.8 billion in the base year of 2024, and a projected Compound Annual Growth Rate (CAGR) of 14.2%, the market is set to reach substantial future valuations. Key growth drivers include the accelerating deployment of renewable energy sources like solar and wind power, favorable government policies championing clean energy, decreasing inverter manufacturing costs, and escalating global energy demand. Market trends highlight a move towards higher-capacity inverters to support large-scale renewable projects and address grid integration complexities. The three-phase inverter segment is anticipated to lead, driven by commercial and industrial sector applications. Technological advancements, such as enhanced efficiency, superior grid integration features, and intelligent energy management systems, are further fueling market growth. Geographic expansion, particularly in the Asia-Pacific region with China and India leading the charge, is a critical factor. Nevertheless, the market faces hurdles including supply chain volatility, fluctuating raw material prices, and the need for harmonized regulatory frameworks.
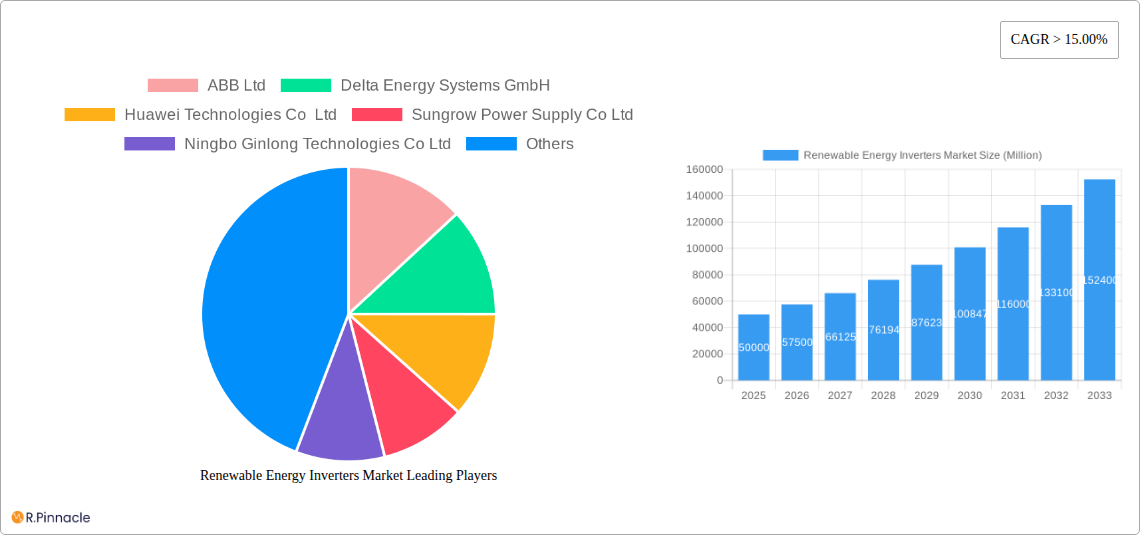
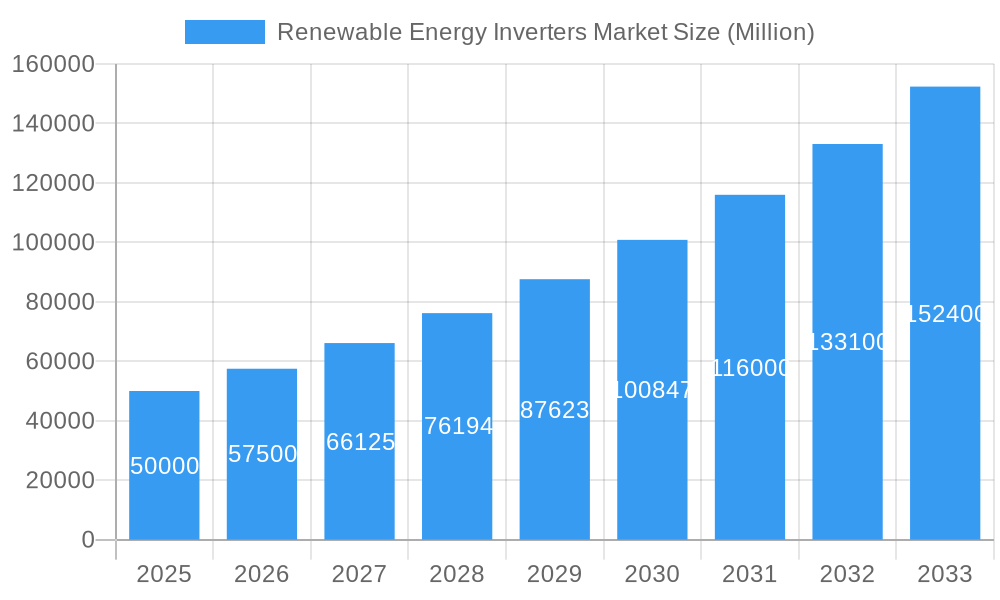
Renewable Energy Inverters Market Market Size (In Billion)
Despite these challenges, the long-term trajectory for the renewable energy inverter market remains exceptionally strong. Continued expansion of global renewable energy capacity, combined with relentless technological innovation and escalating government support, will ensure sustained market growth across the forecast horizon. Intensified competition among leading manufacturers, including ABB, Delta Energy Systems, Huawei, and Sungrow, is stimulating innovation and driving cost efficiencies. Market segmentation reveals distinct opportunities within various power ratings and end-user categories. The residential sector demonstrates consistent growth, while commercial and industrial segments benefit from large-scale implementations. Future growth will also be significantly influenced by the increasing integration of energy storage systems, microgrids, and smart grids, all of which rely on highly efficient and dependable inverters.
Renewable Energy Inverters Market Company Market Share
Renewable Energy Inverters Market: A Comprehensive Report (2019-2033)
This in-depth report provides a comprehensive analysis of the Renewable Energy Inverters Market, covering the period 2019-2033. With a focus on actionable insights and key market trends, this report is essential for industry professionals, investors, and anyone seeking a thorough understanding of this dynamic sector. The market is valued at xx Million in 2025 and is projected to reach xx Million by 2033, exhibiting a robust CAGR of xx%.
Renewable Energy Inverters Market Structure & Innovation Trends
This section analyzes the competitive landscape, innovation drivers, and regulatory influences shaping the Renewable Energy Inverters Market. We delve into market concentration, examining the market share held by key players such as ABB Ltd, Delta Energy Systems GmbH, Huawei Technologies Co Ltd, Sungrow Power Supply Co Ltd, Ningbo Ginlong Technologies Co Ltd, Chint Power Systems Co Ltd, Eaton Corporation Plc, Fronius International GmbH, KACO New Energy GmbH, and SMA Solar Technology AG (list not exhaustive). The analysis includes an assessment of mergers and acquisitions (M&A) activity within the sector, including deal values and their impact on market dynamics. We examine the influence of regulatory frameworks on product development and market access, analyze the prevalence of product substitutes, and profile end-user demographics across residential, commercial & industrial, and utility sectors.
- Market Concentration: The market exhibits [describe level of concentration - e.g., moderate concentration, high fragmentation]. Top 5 players account for approximately xx% of the market share.
- Innovation Drivers: Key drivers include advancements in power electronics, increasing demand for grid stability solutions, and the integration of smart grid technologies.
- M&A Activity: Significant M&A deals in the past five years have totaled approximately xx Million, driven by [mention reasons for M&A e.g., expansion into new markets, technological synergy].
- Regulatory Frameworks: Government incentives and policies promoting renewable energy adoption significantly influence market growth.
Renewable Energy Inverters Market Dynamics & Trends
This section explores the key factors driving market growth, technological advancements, evolving consumer preferences, and the competitive landscape. We analyze the impact of technological disruptions, such as the rise of power electronics, on market dynamics and assess consumer preferences concerning efficiency, reliability, and cost-effectiveness. The competitive dynamics are examined through detailed analysis of product differentiation, pricing strategies, and market penetration rates.
[Insert 600 words of analysis focusing on market growth drivers, technological disruptions, consumer preferences, and competitive dynamics. Include specific metrics like CAGR and market penetration.]
Dominant Regions & Segments in Renewable Energy Inverters Market
This section identifies the leading regions and segments within the Renewable Energy Inverters Market. We analyze market performance across different geographical regions and examine the dominance of specific segments based on phase (single-phase, three-phase), power rating (up to 10kW, 11kW to 40kW, 41kW to 80kW, above 80kW), and end-user (residential, commercial & industrial, utility).
- Key Drivers by Segment:
- Single-Phase: Driven by residential solar installations and favorable government incentives.
- Three-Phase: Dominated by commercial and industrial applications due to higher power requirements.
- Up to 10kW: High growth due to the residential sector's expansion.
- 11kW to 40kW: Significant demand from small and medium-sized commercial businesses.
- 41kW to 80kW: Strong growth potential in commercial and industrial applications.
- Above 80kW: Utilized mainly in large-scale utility projects.
- Residential: Growth driven by decreasing solar panel costs and increasing consumer awareness.
- Commercial & Industrial: Driven by corporate sustainability initiatives and energy cost savings.
- Utility: Fueled by government policies promoting renewable energy integration.
[Insert paragraphs for detailed dominance analysis of the leading regions and segments.]
Renewable Energy Inverters Market Product Innovations
The Renewable Energy Inverters Market is characterized by continuous innovation, with new products designed to enhance efficiency, improve grid integration, and reduce costs. Recent developments include advancements in power electronics, the integration of smart grid technologies, and the emergence of energy storage solutions. These innovations address growing market demands for reliable, efficient, and cost-effective renewable energy systems.
Report Scope & Segmentation Analysis
This report comprehensively segments the Renewable Energy Inverters Market based on phase (Single Phase, Three Phase), power rating (Up to 10kW, 11kW to 40kW, 41kW to 80kW, Above 80kW), and end-user (Residential, Commercial & Industrial, Utility). Each segment's growth projections, market size, and competitive dynamics are analyzed.
[Insert paragraph per segment detailing growth projections, market sizes, and competitive dynamics.]
Key Drivers of Renewable Energy Inverters Market Growth
Growth in the Renewable Energy Inverters Market is propelled by several factors. Government policies promoting renewable energy adoption, declining costs of solar photovoltaic (PV) systems, and technological advancements in inverter technology drive market expansion. Furthermore, increasing concerns about climate change and the need for sustainable energy sources fuel demand for renewable energy solutions.
Challenges in the Renewable Energy Inverters Market Sector
Despite strong growth potential, the Renewable Energy Inverters Market faces challenges including regulatory hurdles in certain markets, supply chain disruptions affecting component availability, and intense competition from established and emerging players. These challenges impact production costs, market access, and overall profitability.
Emerging Opportunities in Renewable Energy Inverters Market
The Renewable Energy Inverters Market presents promising opportunities. The increasing adoption of hybrid energy systems, integration of energy storage, and expansion into developing markets offer significant growth potential. Further technological advancements, such as advancements in AI-powered optimization, create new avenues for innovation and market expansion.
Leading Players in the Renewable Energy Inverters Market Market
- ABB Ltd
- Delta Energy Systems GmbH
- Huawei Technologies Co Ltd
- Sungrow Power Supply Co Ltd
- Ningbo Ginlong Technologies Co Ltd
- Chint Power Systems Co Ltd
- Eaton Corporation Plc
- Fronius International GmbH
- KACO New Energy GmbH
- SMA Solar Technology AG
Key Developments in Renewable Energy Inverters Market Industry
- September 2022: Sineng Electric partners with Power n Sun to distribute its string PV inverters in South Africa. Sineng launches a new generation of three-phase string inverters (50kW, 120kW, 250kW, and 275kW) targeting the commercial and industrial sector in South Africa. This expansion signifies a significant move into a rapidly growing market.
Future Outlook for Renewable Energy Inverters Market Market
The Renewable Energy Inverters Market is poised for continued strong growth, driven by increasing renewable energy capacity additions globally, declining costs, and technological advancements. The integration of smart grid technologies, the rise of energy storage solutions, and the expansion into emerging markets will continue to shape the market's trajectory, presenting lucrative opportunities for industry players.
Renewable Energy Inverters Market Segmentation
-
1. Phase
- 1.1. Single Phase
- 1.2. Three Phase
-
2. Power Rating
- 2.1. Up to 10kW
- 2.2. 11kW to 40kW
- 2.3. 41kW to 80kW
- 2.4. Above 80kW
-
3. End-User
- 3.1. Residential
- 3.2. Commercial & Industrial
- 3.3. Utility
Renewable Energy Inverters Market Segmentation By Geography
- 1. North America
- 2. Asia Pacific
- 3. Europe
- 4. South America
- 5. Middle East and Africa
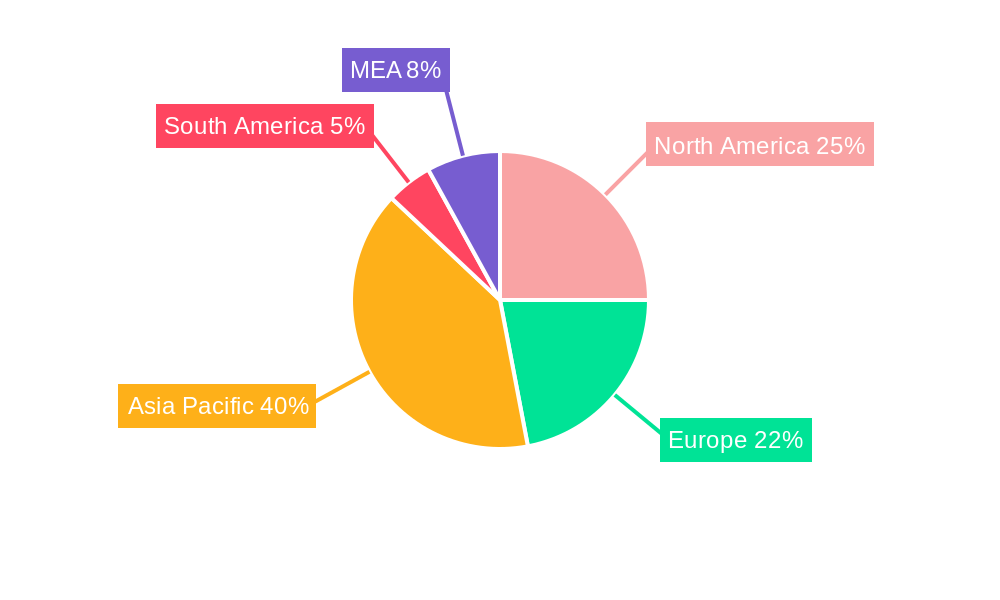
Renewable Energy Inverters Market Regional Market Share
Geographic Coverage of Renewable Energy Inverters Market
Renewable Energy Inverters Market REPORT HIGHLIGHTS
| Aspects | Details |
|---|---|
| Study Period | 2020-2034 |
| Base Year | 2025 |
| Estimated Year | 2026 |
| Forecast Period | 2026-2034 |
| Historical Period | 2020-2025 |
| Growth Rate | CAGR of 14.2% from 2020-2034 |
| Segmentation |
|
Table of Contents
- 1. Introduction
- 1.1. Research Scope
- 1.2. Market Segmentation
- 1.3. Research Objective
- 1.4. Definitions and Assumptions
- 2. Executive Summary
- 2.1. Market Snapshot
- 3. Market Dynamics
- 3.1. Market Drivers
- 3.2. Market Restrains
- 3.3. Market Trends
- 3.4. Market Opportunities
- 4. Market Factor Analysis
- 4.1. Porters Five Forces
- 4.1.1. Bargaining Power of Suppliers
- 4.1.2. Bargaining Power of Buyers
- 4.1.3. Threat of New Entrants
- 4.1.4. Threat of Substitutes
- 4.1.5. Competitive Rivalry
- 4.2. PESTEL analysis
- 4.3. BCG Analysis
- 4.3.1. Stars (High Growth, High Market Share)
- 4.3.2. Cash Cows (Low Growth, High Market Share)
- 4.3.3. Question Mark (High Growth, Low Market Share)
- 4.3.4. Dogs (Low Growth, Low Market Share)
- 4.4. Ansoff Matrix Analysis
- 4.5. Supply Chain Analysis
- 4.6. Regulatory Landscape
- 4.7. Current Market Potential and Opportunity Assessment (TAM–SAM–SOM Framework)
- 4.8. PRI Analyst Note
- 4.1. Porters Five Forces
- 5. Market Analysis, Insights and Forecast 2021-2033
- 5.1. Market Analysis, Insights and Forecast - by Phase
- 5.1.1. Single Phase
- 5.1.2. Three Phase
- 5.2. Market Analysis, Insights and Forecast - by Power Rating
- 5.2.1. Up to 10kW
- 5.2.2. 11kW to 40kW
- 5.2.3. 41kW to 80kW
- 5.2.4. Above 80kW
- 5.3. Market Analysis, Insights and Forecast - by End-User
- 5.3.1. Residential
- 5.3.2. Commercial & Industrial
- 5.3.3. Utility
- 5.4. Market Analysis, Insights and Forecast - by Region
- 5.4.1. North America
- 5.4.2. Asia Pacific
- 5.4.3. Europe
- 5.4.4. South America
- 5.4.5. Middle East and Africa
- 5.1. Market Analysis, Insights and Forecast - by Phase
- 6. Global Renewable Energy Inverters Market Analysis, Insights and Forecast, 2021-2033
- 6.1. Market Analysis, Insights and Forecast - by Phase
- 6.1.1. Single Phase
- 6.1.2. Three Phase
- 6.2. Market Analysis, Insights and Forecast - by Power Rating
- 6.2.1. Up to 10kW
- 6.2.2. 11kW to 40kW
- 6.2.3. 41kW to 80kW
- 6.2.4. Above 80kW
- 6.3. Market Analysis, Insights and Forecast - by End-User
- 6.3.1. Residential
- 6.3.2. Commercial & Industrial
- 6.3.3. Utility
- 6.1. Market Analysis, Insights and Forecast - by Phase
- 7. North America Renewable Energy Inverters Market Analysis, Insights and Forecast, 2020-2032
- 7.1. Market Analysis, Insights and Forecast - by Phase
- 7.1.1. Single Phase
- 7.1.2. Three Phase
- 7.2. Market Analysis, Insights and Forecast - by Power Rating
- 7.2.1. Up to 10kW
- 7.2.2. 11kW to 40kW
- 7.2.3. 41kW to 80kW
- 7.2.4. Above 80kW
- 7.3. Market Analysis, Insights and Forecast - by End-User
- 7.3.1. Residential
- 7.3.2. Commercial & Industrial
- 7.3.3. Utility
- 7.1. Market Analysis, Insights and Forecast - by Phase
- 8. Asia Pacific Renewable Energy Inverters Market Analysis, Insights and Forecast, 2020-2032
- 8.1. Market Analysis, Insights and Forecast - by Phase
- 8.1.1. Single Phase
- 8.1.2. Three Phase
- 8.2. Market Analysis, Insights and Forecast - by Power Rating
- 8.2.1. Up to 10kW
- 8.2.2. 11kW to 40kW
- 8.2.3. 41kW to 80kW
- 8.2.4. Above 80kW
- 8.3. Market Analysis, Insights and Forecast - by End-User
- 8.3.1. Residential
- 8.3.2. Commercial & Industrial
- 8.3.3. Utility
- 8.1. Market Analysis, Insights and Forecast - by Phase
- 9. Europe Renewable Energy Inverters Market Analysis, Insights and Forecast, 2020-2032
- 9.1. Market Analysis, Insights and Forecast - by Phase
- 9.1.1. Single Phase
- 9.1.2. Three Phase
- 9.2. Market Analysis, Insights and Forecast - by Power Rating
- 9.2.1. Up to 10kW
- 9.2.2. 11kW to 40kW
- 9.2.3. 41kW to 80kW
- 9.2.4. Above 80kW
- 9.3. Market Analysis, Insights and Forecast - by End-User
- 9.3.1. Residential
- 9.3.2. Commercial & Industrial
- 9.3.3. Utility
- 9.1. Market Analysis, Insights and Forecast - by Phase
- 10. South America Renewable Energy Inverters Market Analysis, Insights and Forecast, 2020-2032
- 10.1. Market Analysis, Insights and Forecast - by Phase
- 10.1.1. Single Phase
- 10.1.2. Three Phase
- 10.2. Market Analysis, Insights and Forecast - by Power Rating
- 10.2.1. Up to 10kW
- 10.2.2. 11kW to 40kW
- 10.2.3. 41kW to 80kW
- 10.2.4. Above 80kW
- 10.3. Market Analysis, Insights and Forecast - by End-User
- 10.3.1. Residential
- 10.3.2. Commercial & Industrial
- 10.3.3. Utility
- 10.1. Market Analysis, Insights and Forecast - by Phase
- 11. Middle East and Africa Renewable Energy Inverters Market Analysis, Insights and Forecast, 2020-2032
- 11.1. Market Analysis, Insights and Forecast - by Phase
- 11.1.1. Single Phase
- 11.1.2. Three Phase
- 11.2. Market Analysis, Insights and Forecast - by Power Rating
- 11.2.1. Up to 10kW
- 11.2.2. 11kW to 40kW
- 11.2.3. 41kW to 80kW
- 11.2.4. Above 80kW
- 11.3. Market Analysis, Insights and Forecast - by End-User
- 11.3.1. Residential
- 11.3.2. Commercial & Industrial
- 11.3.3. Utility
- 11.1. Market Analysis, Insights and Forecast - by Phase
- 12. Competitive Analysis
- 12.1. Company Profiles
- 12.1.1 ABB Ltd
- 12.1.1.1. Company Overview
- 12.1.1.2. Products
- 12.1.1.3. Company Financials
- 12.1.1.4. SWOT Analysis
- 12.1.2 Delta Energy Systems GmbH
- 12.1.2.1. Company Overview
- 12.1.2.2. Products
- 12.1.2.3. Company Financials
- 12.1.2.4. SWOT Analysis
- 12.1.3 Huawei Technologies Co Ltd
- 12.1.3.1. Company Overview
- 12.1.3.2. Products
- 12.1.3.3. Company Financials
- 12.1.3.4. SWOT Analysis
- 12.1.4 Sungrow Power Supply Co Ltd
- 12.1.4.1. Company Overview
- 12.1.4.2. Products
- 12.1.4.3. Company Financials
- 12.1.4.4. SWOT Analysis
- 12.1.5 Ningbo Ginlong Technologies Co Ltd
- 12.1.5.1. Company Overview
- 12.1.5.2. Products
- 12.1.5.3. Company Financials
- 12.1.5.4. SWOT Analysis
- 12.1.6 Chint Power Systems Co Ltd
- 12.1.6.1. Company Overview
- 12.1.6.2. Products
- 12.1.6.3. Company Financials
- 12.1.6.4. SWOT Analysis
- 12.1.7 Eaton Corporation Plc *List Not Exhaustive
- 12.1.7.1. Company Overview
- 12.1.7.2. Products
- 12.1.7.3. Company Financials
- 12.1.7.4. SWOT Analysis
- 12.1.8 Fronius International GmbH
- 12.1.8.1. Company Overview
- 12.1.8.2. Products
- 12.1.8.3. Company Financials
- 12.1.8.4. SWOT Analysis
- 12.1.9 KACO New Energy GmbH
- 12.1.9.1. Company Overview
- 12.1.9.2. Products
- 12.1.9.3. Company Financials
- 12.1.9.4. SWOT Analysis
- 12.1.10 SMA Solar Technology AG
- 12.1.10.1. Company Overview
- 12.1.10.2. Products
- 12.1.10.3. Company Financials
- 12.1.10.4. SWOT Analysis
- 12.1.1 ABB Ltd
- 12.2. Market Entropy
- 12.2.1 Company's Key Areas Served
- 12.2.2 Recent Developments
- 12.3. Company Market Share Analysis 2025
- 12.3.1 Top 5 Companies Market Share Analysis
- 12.3.2 Top 3 Companies Market Share Analysis
- 12.4. List of Potential Customers
- 13. Research Methodology
List of Figures
- Figure 1: Global Renewable Energy Inverters Market Revenue Breakdown (billion, %) by Region 2025 & 2033
- Figure 2: Global Renewable Energy Inverters Market Volume Breakdown (K Unit, %) by Region 2025 & 2033
- Figure 3: North America Renewable Energy Inverters Market Revenue (billion), by Phase 2025 & 2033
- Figure 4: North America Renewable Energy Inverters Market Volume (K Unit), by Phase 2025 & 2033
- Figure 5: North America Renewable Energy Inverters Market Revenue Share (%), by Phase 2025 & 2033
- Figure 6: North America Renewable Energy Inverters Market Volume Share (%), by Phase 2025 & 2033
- Figure 7: North America Renewable Energy Inverters Market Revenue (billion), by Power Rating 2025 & 2033
- Figure 8: North America Renewable Energy Inverters Market Volume (K Unit), by Power Rating 2025 & 2033
- Figure 9: North America Renewable Energy Inverters Market Revenue Share (%), by Power Rating 2025 & 2033
- Figure 10: North America Renewable Energy Inverters Market Volume Share (%), by Power Rating 2025 & 2033
- Figure 11: North America Renewable Energy Inverters Market Revenue (billion), by End-User 2025 & 2033
- Figure 12: North America Renewable Energy Inverters Market Volume (K Unit), by End-User 2025 & 2033
- Figure 13: North America Renewable Energy Inverters Market Revenue Share (%), by End-User 2025 & 2033
- Figure 14: North America Renewable Energy Inverters Market Volume Share (%), by End-User 2025 & 2033
- Figure 15: North America Renewable Energy Inverters Market Revenue (billion), by Country 2025 & 2033
- Figure 16: North America Renewable Energy Inverters Market Volume (K Unit), by Country 2025 & 2033
- Figure 17: North America Renewable Energy Inverters Market Revenue Share (%), by Country 2025 & 2033
- Figure 18: North America Renewable Energy Inverters Market Volume Share (%), by Country 2025 & 2033
- Figure 19: Asia Pacific Renewable Energy Inverters Market Revenue (billion), by Phase 2025 & 2033
- Figure 20: Asia Pacific Renewable Energy Inverters Market Volume (K Unit), by Phase 2025 & 2033
- Figure 21: Asia Pacific Renewable Energy Inverters Market Revenue Share (%), by Phase 2025 & 2033
- Figure 22: Asia Pacific Renewable Energy Inverters Market Volume Share (%), by Phase 2025 & 2033
- Figure 23: Asia Pacific Renewable Energy Inverters Market Revenue (billion), by Power Rating 2025 & 2033
- Figure 24: Asia Pacific Renewable Energy Inverters Market Volume (K Unit), by Power Rating 2025 & 2033
- Figure 25: Asia Pacific Renewable Energy Inverters Market Revenue Share (%), by Power Rating 2025 & 2033
- Figure 26: Asia Pacific Renewable Energy Inverters Market Volume Share (%), by Power Rating 2025 & 2033
- Figure 27: Asia Pacific Renewable Energy Inverters Market Revenue (billion), by End-User 2025 & 2033
- Figure 28: Asia Pacific Renewable Energy Inverters Market Volume (K Unit), by End-User 2025 & 2033
- Figure 29: Asia Pacific Renewable Energy Inverters Market Revenue Share (%), by End-User 2025 & 2033
- Figure 30: Asia Pacific Renewable Energy Inverters Market Volume Share (%), by End-User 2025 & 2033
- Figure 31: Asia Pacific Renewable Energy Inverters Market Revenue (billion), by Country 2025 & 2033
- Figure 32: Asia Pacific Renewable Energy Inverters Market Volume (K Unit), by Country 2025 & 2033
- Figure 33: Asia Pacific Renewable Energy Inverters Market Revenue Share (%), by Country 2025 & 2033
- Figure 34: Asia Pacific Renewable Energy Inverters Market Volume Share (%), by Country 2025 & 2033
- Figure 35: Europe Renewable Energy Inverters Market Revenue (billion), by Phase 2025 & 2033
- Figure 36: Europe Renewable Energy Inverters Market Volume (K Unit), by Phase 2025 & 2033
- Figure 37: Europe Renewable Energy Inverters Market Revenue Share (%), by Phase 2025 & 2033
- Figure 38: Europe Renewable Energy Inverters Market Volume Share (%), by Phase 2025 & 2033
- Figure 39: Europe Renewable Energy Inverters Market Revenue (billion), by Power Rating 2025 & 2033
- Figure 40: Europe Renewable Energy Inverters Market Volume (K Unit), by Power Rating 2025 & 2033
- Figure 41: Europe Renewable Energy Inverters Market Revenue Share (%), by Power Rating 2025 & 2033
- Figure 42: Europe Renewable Energy Inverters Market Volume Share (%), by Power Rating 2025 & 2033
- Figure 43: Europe Renewable Energy Inverters Market Revenue (billion), by End-User 2025 & 2033
- Figure 44: Europe Renewable Energy Inverters Market Volume (K Unit), by End-User 2025 & 2033
- Figure 45: Europe Renewable Energy Inverters Market Revenue Share (%), by End-User 2025 & 2033
- Figure 46: Europe Renewable Energy Inverters Market Volume Share (%), by End-User 2025 & 2033
- Figure 47: Europe Renewable Energy Inverters Market Revenue (billion), by Country 2025 & 2033
- Figure 48: Europe Renewable Energy Inverters Market Volume (K Unit), by Country 2025 & 2033
- Figure 49: Europe Renewable Energy Inverters Market Revenue Share (%), by Country 2025 & 2033
- Figure 50: Europe Renewable Energy Inverters Market Volume Share (%), by Country 2025 & 2033
- Figure 51: South America Renewable Energy Inverters Market Revenue (billion), by Phase 2025 & 2033
- Figure 52: South America Renewable Energy Inverters Market Volume (K Unit), by Phase 2025 & 2033
- Figure 53: South America Renewable Energy Inverters Market Revenue Share (%), by Phase 2025 & 2033
- Figure 54: South America Renewable Energy Inverters Market Volume Share (%), by Phase 2025 & 2033
- Figure 55: South America Renewable Energy Inverters Market Revenue (billion), by Power Rating 2025 & 2033
- Figure 56: South America Renewable Energy Inverters Market Volume (K Unit), by Power Rating 2025 & 2033
- Figure 57: South America Renewable Energy Inverters Market Revenue Share (%), by Power Rating 2025 & 2033
- Figure 58: South America Renewable Energy Inverters Market Volume Share (%), by Power Rating 2025 & 2033
- Figure 59: South America Renewable Energy Inverters Market Revenue (billion), by End-User 2025 & 2033
- Figure 60: South America Renewable Energy Inverters Market Volume (K Unit), by End-User 2025 & 2033
- Figure 61: South America Renewable Energy Inverters Market Revenue Share (%), by End-User 2025 & 2033
- Figure 62: South America Renewable Energy Inverters Market Volume Share (%), by End-User 2025 & 2033
- Figure 63: South America Renewable Energy Inverters Market Revenue (billion), by Country 2025 & 2033
- Figure 64: South America Renewable Energy Inverters Market Volume (K Unit), by Country 2025 & 2033
- Figure 65: South America Renewable Energy Inverters Market Revenue Share (%), by Country 2025 & 2033
- Figure 66: South America Renewable Energy Inverters Market Volume Share (%), by Country 2025 & 2033
- Figure 67: Middle East and Africa Renewable Energy Inverters Market Revenue (billion), by Phase 2025 & 2033
- Figure 68: Middle East and Africa Renewable Energy Inverters Market Volume (K Unit), by Phase 2025 & 2033
- Figure 69: Middle East and Africa Renewable Energy Inverters Market Revenue Share (%), by Phase 2025 & 2033
- Figure 70: Middle East and Africa Renewable Energy Inverters Market Volume Share (%), by Phase 2025 & 2033
- Figure 71: Middle East and Africa Renewable Energy Inverters Market Revenue (billion), by Power Rating 2025 & 2033
- Figure 72: Middle East and Africa Renewable Energy Inverters Market Volume (K Unit), by Power Rating 2025 & 2033
- Figure 73: Middle East and Africa Renewable Energy Inverters Market Revenue Share (%), by Power Rating 2025 & 2033
- Figure 74: Middle East and Africa Renewable Energy Inverters Market Volume Share (%), by Power Rating 2025 & 2033
- Figure 75: Middle East and Africa Renewable Energy Inverters Market Revenue (billion), by End-User 2025 & 2033
- Figure 76: Middle East and Africa Renewable Energy Inverters Market Volume (K Unit), by End-User 2025 & 2033
- Figure 77: Middle East and Africa Renewable Energy Inverters Market Revenue Share (%), by End-User 2025 & 2033
- Figure 78: Middle East and Africa Renewable Energy Inverters Market Volume Share (%), by End-User 2025 & 2033
- Figure 79: Middle East and Africa Renewable Energy Inverters Market Revenue (billion), by Country 2025 & 2033
- Figure 80: Middle East and Africa Renewable Energy Inverters Market Volume (K Unit), by Country 2025 & 2033
- Figure 81: Middle East and Africa Renewable Energy Inverters Market Revenue Share (%), by Country 2025 & 2033
- Figure 82: Middle East and Africa Renewable Energy Inverters Market Volume Share (%), by Country 2025 & 2033
List of Tables
- Table 1: Global Renewable Energy Inverters Market Revenue billion Forecast, by Phase 2020 & 2033
- Table 2: Global Renewable Energy Inverters Market Volume K Unit Forecast, by Phase 2020 & 2033
- Table 3: Global Renewable Energy Inverters Market Revenue billion Forecast, by Power Rating 2020 & 2033
- Table 4: Global Renewable Energy Inverters Market Volume K Unit Forecast, by Power Rating 2020 & 2033
- Table 5: Global Renewable Energy Inverters Market Revenue billion Forecast, by End-User 2020 & 2033
- Table 6: Global Renewable Energy Inverters Market Volume K Unit Forecast, by End-User 2020 & 2033
- Table 7: Global Renewable Energy Inverters Market Revenue billion Forecast, by Region 2020 & 2033
- Table 8: Global Renewable Energy Inverters Market Volume K Unit Forecast, by Region 2020 & 2033
- Table 9: Global Renewable Energy Inverters Market Revenue billion Forecast, by Phase 2020 & 2033
- Table 10: Global Renewable Energy Inverters Market Volume K Unit Forecast, by Phase 2020 & 2033
- Table 11: Global Renewable Energy Inverters Market Revenue billion Forecast, by Power Rating 2020 & 2033
- Table 12: Global Renewable Energy Inverters Market Volume K Unit Forecast, by Power Rating 2020 & 2033
- Table 13: Global Renewable Energy Inverters Market Revenue billion Forecast, by End-User 2020 & 2033
- Table 14: Global Renewable Energy Inverters Market Volume K Unit Forecast, by End-User 2020 & 2033
- Table 15: Global Renewable Energy Inverters Market Revenue billion Forecast, by Country 2020 & 2033
- Table 16: Global Renewable Energy Inverters Market Volume K Unit Forecast, by Country 2020 & 2033
- Table 17: Global Renewable Energy Inverters Market Revenue billion Forecast, by Phase 2020 & 2033
- Table 18: Global Renewable Energy Inverters Market Volume K Unit Forecast, by Phase 2020 & 2033
- Table 19: Global Renewable Energy Inverters Market Revenue billion Forecast, by Power Rating 2020 & 2033
- Table 20: Global Renewable Energy Inverters Market Volume K Unit Forecast, by Power Rating 2020 & 2033
- Table 21: Global Renewable Energy Inverters Market Revenue billion Forecast, by End-User 2020 & 2033
- Table 22: Global Renewable Energy Inverters Market Volume K Unit Forecast, by End-User 2020 & 2033
- Table 23: Global Renewable Energy Inverters Market Revenue billion Forecast, by Country 2020 & 2033
- Table 24: Global Renewable Energy Inverters Market Volume K Unit Forecast, by Country 2020 & 2033
- Table 25: Global Renewable Energy Inverters Market Revenue billion Forecast, by Phase 2020 & 2033
- Table 26: Global Renewable Energy Inverters Market Volume K Unit Forecast, by Phase 2020 & 2033
- Table 27: Global Renewable Energy Inverters Market Revenue billion Forecast, by Power Rating 2020 & 2033
- Table 28: Global Renewable Energy Inverters Market Volume K Unit Forecast, by Power Rating 2020 & 2033
- Table 29: Global Renewable Energy Inverters Market Revenue billion Forecast, by End-User 2020 & 2033
- Table 30: Global Renewable Energy Inverters Market Volume K Unit Forecast, by End-User 2020 & 2033
- Table 31: Global Renewable Energy Inverters Market Revenue billion Forecast, by Country 2020 & 2033
- Table 32: Global Renewable Energy Inverters Market Volume K Unit Forecast, by Country 2020 & 2033
- Table 33: Global Renewable Energy Inverters Market Revenue billion Forecast, by Phase 2020 & 2033
- Table 34: Global Renewable Energy Inverters Market Volume K Unit Forecast, by Phase 2020 & 2033
- Table 35: Global Renewable Energy Inverters Market Revenue billion Forecast, by Power Rating 2020 & 2033
- Table 36: Global Renewable Energy Inverters Market Volume K Unit Forecast, by Power Rating 2020 & 2033
- Table 37: Global Renewable Energy Inverters Market Revenue billion Forecast, by End-User 2020 & 2033
- Table 38: Global Renewable Energy Inverters Market Volume K Unit Forecast, by End-User 2020 & 2033
- Table 39: Global Renewable Energy Inverters Market Revenue billion Forecast, by Country 2020 & 2033
- Table 40: Global Renewable Energy Inverters Market Volume K Unit Forecast, by Country 2020 & 2033
- Table 41: Global Renewable Energy Inverters Market Revenue billion Forecast, by Phase 2020 & 2033
- Table 42: Global Renewable Energy Inverters Market Volume K Unit Forecast, by Phase 2020 & 2033
- Table 43: Global Renewable Energy Inverters Market Revenue billion Forecast, by Power Rating 2020 & 2033
- Table 44: Global Renewable Energy Inverters Market Volume K Unit Forecast, by Power Rating 2020 & 2033
- Table 45: Global Renewable Energy Inverters Market Revenue billion Forecast, by End-User 2020 & 2033
- Table 46: Global Renewable Energy Inverters Market Volume K Unit Forecast, by End-User 2020 & 2033
- Table 47: Global Renewable Energy Inverters Market Revenue billion Forecast, by Country 2020 & 2033
- Table 48: Global Renewable Energy Inverters Market Volume K Unit Forecast, by Country 2020 & 2033
Frequently Asked Questions
1. What is the projected Compound Annual Growth Rate (CAGR) of the Renewable Energy Inverters Market?
The projected CAGR is approximately 14.2%.
2. Which companies are prominent players in the Renewable Energy Inverters Market?
Key companies in the market include ABB Ltd, Delta Energy Systems GmbH, Huawei Technologies Co Ltd, Sungrow Power Supply Co Ltd, Ningbo Ginlong Technologies Co Ltd, Chint Power Systems Co Ltd, Eaton Corporation Plc *List Not Exhaustive, Fronius International GmbH, KACO New Energy GmbH, SMA Solar Technology AG.
3. What are the main segments of the Renewable Energy Inverters Market?
The market segments include Phase, Power Rating, End-User.
4. Can you provide details about the market size?
The market size is estimated to be USD 11.8 billion as of 2022.
5. What are some drivers contributing to market growth?
4.; Increasing Sales of Automobiles4.; Growing Adoption of Battery Energy Storage Systems (BESS).
6. What are the notable trends driving market growth?
Utility Segment Likely to Witness Significant Growth.
7. Are there any restraints impacting market growth?
4.; Rising Emphasis on Lithium-Ion Batteries.
8. Can you provide examples of recent developments in the market?
September 2022: Sineng Electric has announced that it is partnering with Power n Sun for its portfolio of string PV inverters in the South Africa Market. Sineng launched their new generation series of three-phase string inverters of varying focused on the commercial and industrial segment of the South Africa Market. The string inverters' capacities are 50kW, 120kW, 250kW, and 275kW, respectively.
9. What pricing options are available for accessing the report?
Pricing options include single-user, multi-user, and enterprise licenses priced at USD 4750, USD 5250, and USD 8750 respectively.
10. Is the market size provided in terms of value or volume?
The market size is provided in terms of value, measured in billion and volume, measured in K Unit.
11. Are there any specific market keywords associated with the report?
Yes, the market keyword associated with the report is "Renewable Energy Inverters Market," which aids in identifying and referencing the specific market segment covered.
12. How do I determine which pricing option suits my needs best?
The pricing options vary based on user requirements and access needs. Individual users may opt for single-user licenses, while businesses requiring broader access may choose multi-user or enterprise licenses for cost-effective access to the report.
13. Are there any additional resources or data provided in the Renewable Energy Inverters Market report?
While the report offers comprehensive insights, it's advisable to review the specific contents or supplementary materials provided to ascertain if additional resources or data are available.
14. How can I stay updated on further developments or reports in the Renewable Energy Inverters Market?
To stay informed about further developments, trends, and reports in the Renewable Energy Inverters Market, consider subscribing to industry newsletters, following relevant companies and organizations, or regularly checking reputable industry news sources and publications.
Methodology
Step 1 - Identification of Relevant Samples Size from Population Database


Step 2 - Approaches for Defining Global Market Size (Value, Volume* & Price*)

Note*: In applicable scenarios
Step 3 - Data Sources
Primary Research
- Web Analytics
- Survey Reports
- Research Institute
- Latest Research Reports
- Opinion Leaders
Secondary Research
- Annual Reports
- White Paper
- Latest Press Release
- Industry Association
- Paid Database
- Investor Presentations

Step 4 - Data Triangulation
Involves using different sources of information in order to increase the validity of a study
These sources are likely to be stakeholders in a program - participants, other researchers, program staff, other community members, and so on.
Then we put all data in single framework & apply various statistical tools to find out the dynamic on the market.
During the analysis stage, feedback from the stakeholder groups would be compared to determine areas of agreement as well as areas of divergence