
Key Insights
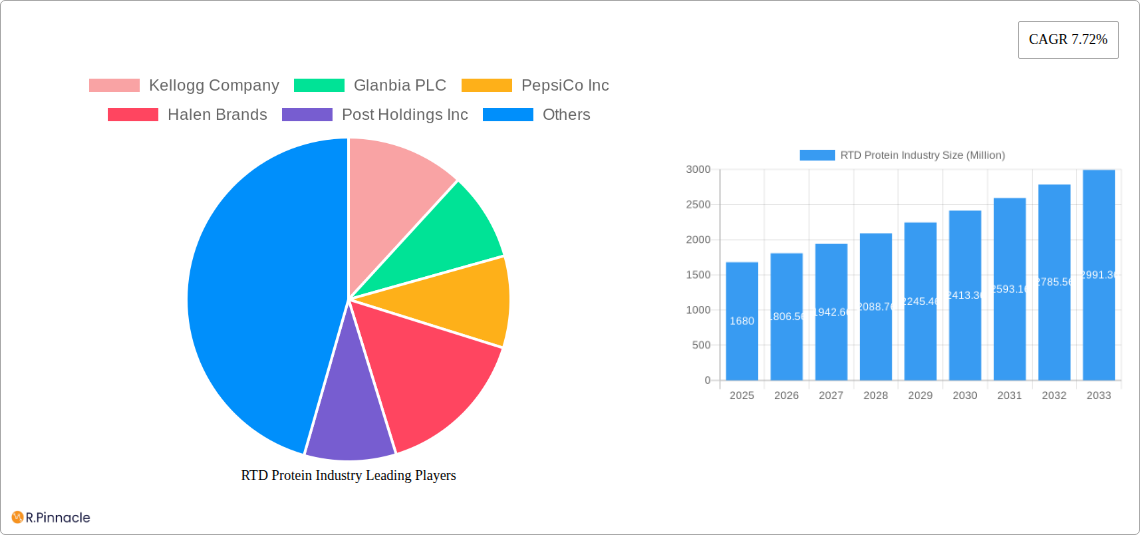
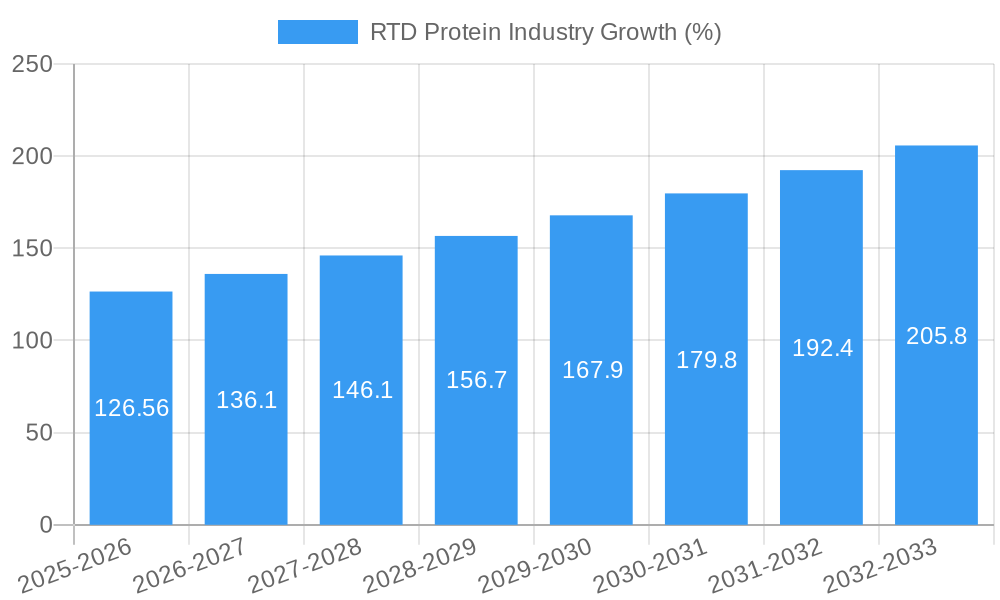
The Ready-to-Drink (RTD) protein market is experiencing robust growth, projected to reach $1.68 billion in 2025 and maintain a Compound Annual Growth Rate (CAGR) of 7.72% from 2025 to 2033. This expansion is driven by several key factors. The increasing consumer awareness of the importance of protein intake for muscle building, weight management, and overall health fuels demand. The convenience offered by RTD protein drinks, particularly for busy individuals with active lifestyles, is a significant driver. Furthermore, ongoing product innovation, including the introduction of new flavors, functional ingredients (like added vitamins and minerals), and sustainable packaging options, caters to evolving consumer preferences and enhances market appeal. The competitive landscape is characterized by a mix of established players like Kellogg's, PepsiCo, and Glanbia, alongside emerging brands focusing on niche segments like plant-based or organic protein sources. This competition fosters innovation and drives down prices, further boosting market accessibility.
The market's sustained growth is expected to continue through strategic partnerships, acquisitions, and expanding distribution channels, particularly into emerging markets. However, potential restraints include fluctuating raw material costs, stringent regulatory requirements regarding labeling and ingredients, and the potential for consumer health concerns regarding artificial sweeteners or high sugar content in some products. Therefore, manufacturers are focusing on clean-label initiatives and utilizing natural sweeteners to address these concerns. The segmentation of the RTD protein market is likely diverse, encompassing product types (shakes, juices, waters), protein sources (whey, casein, soy, plant-based blends), and consumer demographics (athletes, health-conscious individuals, elderly). Future growth will likely be shaped by the success of companies in effectively addressing these consumer segments and adapting to evolving dietary trends.
Ready-to-Drink (RTD) Protein Industry Report: 2019-2033
This comprehensive report provides a detailed analysis of the global Ready-to-Drink (RTD) Protein industry, offering invaluable insights for industry professionals, investors, and stakeholders. The report covers the period 2019-2033, with a focus on the forecast period 2025-2033 and a base year of 2025. The market size is estimated to reach xx Million by 2025 and is projected to witness significant growth throughout the forecast period.
RTD Protein Industry Market Structure & Innovation Trends
This section analyzes the competitive landscape, innovation drivers, and regulatory aspects of the RTD protein market. The market is moderately concentrated, with key players like Kellogg Company, Glanbia PLC, PepsiCo Inc, and others holding significant market share. However, the emergence of smaller, innovative brands presents a dynamic competitive environment.
- Market Concentration: The top 5 players hold an estimated xx% market share in 2025, leaving room for smaller players and new entrants.
- Innovation Drivers: Consumer demand for convenient, high-protein options fuels innovation in flavor profiles, functional ingredients (e.g., added vitamins, probiotics), and sustainable packaging.
- Regulatory Frameworks: Food safety regulations and labeling requirements vary across regions, influencing product development and market access.
- Product Substitutes: Other convenient protein sources, such as protein bars and powders, pose competition.
- End-User Demographics: The primary consumer base includes health-conscious individuals, athletes, and busy professionals seeking convenient protein intake.
- M&A Activities: The industry has witnessed several significant mergers and acquisitions, with deal values reaching xx Million in the past five years. These activities often involve larger companies acquiring smaller, innovative brands to expand their product portfolios and market reach.
RTD Protein Industry Market Dynamics & Trends
This section dives deep into the market's growth trajectory, analyzing factors influencing its expansion. The RTD protein market is experiencing robust growth, driven by several key factors. The compound annual growth rate (CAGR) during the forecast period is projected to be xx%. Market penetration is currently at xx% and is expected to reach xx% by 2033.
The increasing health consciousness among consumers, coupled with the growing demand for convenient and on-the-go nutrition solutions, are the primary drivers behind this expansion. Technological advancements in protein extraction and processing further contribute to the market’s progress. Consumer preferences towards natural, plant-based, and organic RTD protein products are also shaping the market landscape. The competitive dynamics are marked by both established players and emerging startups, resulting in increased product diversification and innovation.
Dominant Regions & Segments in RTD Protein Industry
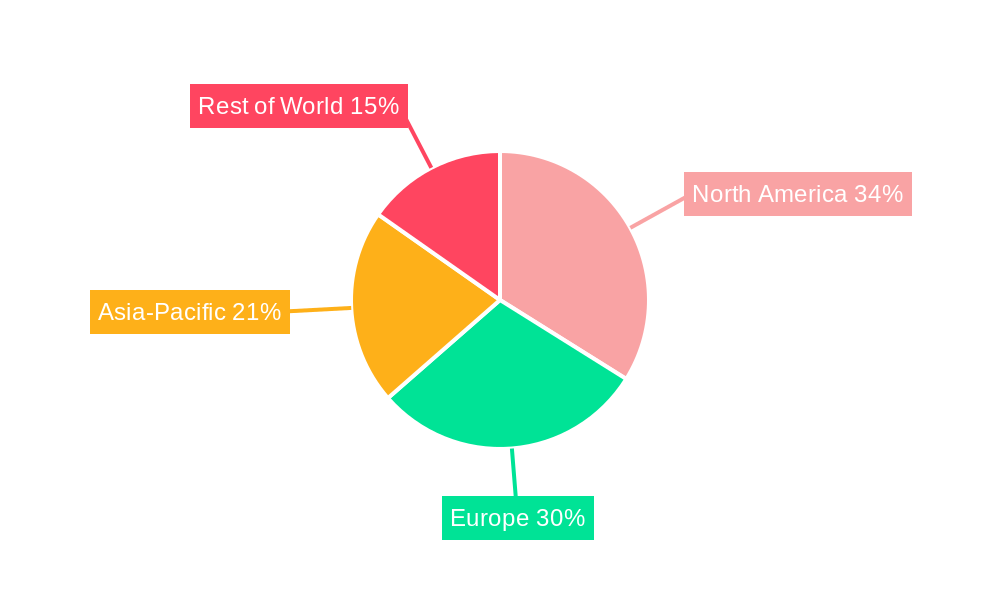
This section identifies the leading geographic regions and market segments within the RTD protein industry. North America currently dominates the market, followed by Europe and Asia-Pacific.
- Key Drivers for North American Dominance:
- Strong consumer demand for convenient protein sources.
- Well-established distribution networks.
- High disposable incomes.
- Extensive marketing and brand awareness campaigns.
- Detailed Dominance Analysis: The robust growth of the fitness and wellness industry in North America is a key factor in the region’s market leadership. High levels of consumer spending on health and wellness products, coupled with a preference for convenient and ready-to-consume solutions, have propelled the RTD protein market in this region. The established presence of major players and a strong retail infrastructure also contribute to North America's dominance.
RTD Protein Industry Product Innovations
Recent product innovations in the RTD protein industry focus on enhanced flavors, functional ingredients, and sustainable packaging. Technological advancements in protein extraction and formulation are leading to improved taste and texture, while the use of eco-friendly materials addresses growing environmental concerns. The development of plant-based and low-sugar options caters to evolving consumer preferences. These innovations enhance the products' competitive advantages, driving greater market penetration and appeal.
Report Scope & Segmentation Analysis
The report segments the RTD protein market based on several factors, including protein source (whey, casein, soy, plant-based blends), flavor, packaging type, distribution channel (retail, online), and geography. Each segment presents unique growth opportunities and competitive dynamics, with detailed analyses included in the full report. For example, the plant-based segment shows a significant growth projection of xx% due to increasing consumer demand for vegan and vegetarian options.
Key Drivers of RTD Protein Industry Growth
Several factors are driving the growth of the RTD protein industry. These include:
- Growing health consciousness: Consumers increasingly prioritize protein intake for overall wellness.
- Convenience factor: RTD products offer a hassle-free way to consume protein.
- Technological advancements: Improved protein extraction and formulation enhance product quality.
- Favorable government regulations: Supportive policies promoting healthy food choices boost market growth.
Challenges in the RTD Protein Industry Sector
The RTD protein industry faces several challenges:
- Stringent regulatory environment: Compliance with food safety and labeling regulations poses significant costs.
- Supply chain complexities: Fluctuations in raw material prices and supply chain disruptions affect profitability.
- Intense competition: The market's competitive nature necessitates continuous innovation and differentiation.
Emerging Opportunities in RTD Protein Industry
Emerging opportunities exist in:
- Expansion into new markets: Developing countries offer significant untapped potential for RTD protein products.
- Innovation in product formulations: Development of new flavors, functional ingredients, and sustainable packaging creates further growth opportunities.
- Focus on niche segments: Targeting specific demographics (e.g., athletes, elderly) with tailored products expands market reach.
Leading Players in the RTD Protein Industry Market
- Kellogg Company
- Glanbia PLC
- PepsiCo Inc
- Halen Brands
- Post Holdings Inc
- Koia
- Abbott Nutrition
- Labrada Nutrition
- The Coca Cola Company
- Pure Protein
Key Developments in RTD Protein Industry
- May 2021: PepsiCo's Naked brand launched Indulgent Protein smoothies.
- February 2021: Koia secured national distribution in 7-Eleven stores.
- February 2022: Optimum Nutrition introduced a new RTD protein supplement in the UK.
- March 2022: QNT SA partnered with Qimia Makmal Arad Company for distribution in Iran.
Future Outlook for RTD Protein Industry Market
The future of the RTD protein market appears bright. Continued growth is expected, driven by factors such as increasing health consciousness, rising demand for convenience, and further product innovation. Strategic partnerships, acquisitions, and expansion into new geographical markets are likely to shape the industry's landscape in the coming years, presenting significant opportunities for growth and profitability.
RTD Protein Industry Segmentation
-
1. Source
- 1.1. Whey
- 1.2. Casein
- 1.3. Soy
- 1.4. Other Sources
-
2. Type of Packaging
- 2.1. Bottles
- 2.2. Cans
- 2.3. Others
-
3. Distribution Channel
- 3.1. Supermarkets/Hypermarkets
- 3.2. Pharmacies/Drugstores
- 3.3. Specialist Retailers
- 3.4. Online Retail
- 3.5. Other Channels
RTD Protein Industry Segmentation By Geography
-
1. North America
- 1.1. United States
- 1.2. Canada
- 1.3. Mexico
- 1.4. Rest of North America
-
2. Europe
- 2.1. Germany
- 2.2. United Kingdom
- 2.3. France
- 2.4. Spain
- 2.5. Italy
- 2.6. Russia
- 2.7. Rest of Europe
-
3. Asia Pacific
- 3.1. China
- 3.2. Japan
- 3.3. India
- 3.4. Australia
- 3.5. Rest of Asia Pacific
-
4. South America
- 4.1. Brazil
- 4.2. Argentina
- 4.3. Rest of South America
-
5. Middle East and Africa
- 5.1. South Africa
- 5.2. United Arab Emirates
- 5.3. Rest of Middle East and Africa
RTD Protein Industry REPORT HIGHLIGHTS
| Aspects | Details |
|---|---|
| Study Period | 2019-2033 |
| Base Year | 2024 |
| Estimated Year | 2025 |
| Forecast Period | 2025-2033 |
| Historical Period | 2019-2024 |
| Growth Rate | CAGR of 7.72% from 2019-2033 |
| Segmentation |
|
Table of Contents
- 1. Introduction
- 1.1. Research Scope
- 1.2. Market Segmentation
- 1.3. Research Methodology
- 1.4. Definitions and Assumptions
- 2. Executive Summary
- 2.1. Introduction
- 3. Market Dynamics
- 3.1. Introduction
- 3.2. Market Drivers
- 3.3. Market Restrains
- 3.4. Market Trends
- 3.4.1. Strong Demand from Health Conscious Consumers
- 4. Market Factor Analysis
- 4.1. Porters Five Forces
- 4.2. Supply/Value Chain
- 4.3. PESTEL analysis
- 4.4. Market Entropy
- 4.5. Patent/Trademark Analysis
- 5. Global RTD Protein Industry Analysis, Insights and Forecast, 2019-2031
- 5.1. Market Analysis, Insights and Forecast - by Source
- 5.1.1. Whey
- 5.1.2. Casein
- 5.1.3. Soy
- 5.1.4. Other Sources
- 5.2. Market Analysis, Insights and Forecast - by Type of Packaging
- 5.2.1. Bottles
- 5.2.2. Cans
- 5.2.3. Others
- 5.3. Market Analysis, Insights and Forecast - by Distribution Channel
- 5.3.1. Supermarkets/Hypermarkets
- 5.3.2. Pharmacies/Drugstores
- 5.3.3. Specialist Retailers
- 5.3.4. Online Retail
- 5.3.5. Other Channels
- 5.4. Market Analysis, Insights and Forecast - by Region
- 5.4.1. North America
- 5.4.2. Europe
- 5.4.3. Asia Pacific
- 5.4.4. South America
- 5.4.5. Middle East and Africa
- 5.1. Market Analysis, Insights and Forecast - by Source
- 6. North America RTD Protein Industry Analysis, Insights and Forecast, 2019-2031
- 6.1. Market Analysis, Insights and Forecast - by Source
- 6.1.1. Whey
- 6.1.2. Casein
- 6.1.3. Soy
- 6.1.4. Other Sources
- 6.2. Market Analysis, Insights and Forecast - by Type of Packaging
- 6.2.1. Bottles
- 6.2.2. Cans
- 6.2.3. Others
- 6.3. Market Analysis, Insights and Forecast - by Distribution Channel
- 6.3.1. Supermarkets/Hypermarkets
- 6.3.2. Pharmacies/Drugstores
- 6.3.3. Specialist Retailers
- 6.3.4. Online Retail
- 6.3.5. Other Channels
- 6.1. Market Analysis, Insights and Forecast - by Source
- 7. Europe RTD Protein Industry Analysis, Insights and Forecast, 2019-2031
- 7.1. Market Analysis, Insights and Forecast - by Source
- 7.1.1. Whey
- 7.1.2. Casein
- 7.1.3. Soy
- 7.1.4. Other Sources
- 7.2. Market Analysis, Insights and Forecast - by Type of Packaging
- 7.2.1. Bottles
- 7.2.2. Cans
- 7.2.3. Others
- 7.3. Market Analysis, Insights and Forecast - by Distribution Channel
- 7.3.1. Supermarkets/Hypermarkets
- 7.3.2. Pharmacies/Drugstores
- 7.3.3. Specialist Retailers
- 7.3.4. Online Retail
- 7.3.5. Other Channels
- 7.1. Market Analysis, Insights and Forecast - by Source
- 8. Asia Pacific RTD Protein Industry Analysis, Insights and Forecast, 2019-2031
- 8.1. Market Analysis, Insights and Forecast - by Source
- 8.1.1. Whey
- 8.1.2. Casein
- 8.1.3. Soy
- 8.1.4. Other Sources
- 8.2. Market Analysis, Insights and Forecast - by Type of Packaging
- 8.2.1. Bottles
- 8.2.2. Cans
- 8.2.3. Others
- 8.3. Market Analysis, Insights and Forecast - by Distribution Channel
- 8.3.1. Supermarkets/Hypermarkets
- 8.3.2. Pharmacies/Drugstores
- 8.3.3. Specialist Retailers
- 8.3.4. Online Retail
- 8.3.5. Other Channels
- 8.1. Market Analysis, Insights and Forecast - by Source
- 9. South America RTD Protein Industry Analysis, Insights and Forecast, 2019-2031
- 9.1. Market Analysis, Insights and Forecast - by Source
- 9.1.1. Whey
- 9.1.2. Casein
- 9.1.3. Soy
- 9.1.4. Other Sources
- 9.2. Market Analysis, Insights and Forecast - by Type of Packaging
- 9.2.1. Bottles
- 9.2.2. Cans
- 9.2.3. Others
- 9.3. Market Analysis, Insights and Forecast - by Distribution Channel
- 9.3.1. Supermarkets/Hypermarkets
- 9.3.2. Pharmacies/Drugstores
- 9.3.3. Specialist Retailers
- 9.3.4. Online Retail
- 9.3.5. Other Channels
- 9.1. Market Analysis, Insights and Forecast - by Source
- 10. Middle East and Africa RTD Protein Industry Analysis, Insights and Forecast, 2019-2031
- 10.1. Market Analysis, Insights and Forecast - by Source
- 10.1.1. Whey
- 10.1.2. Casein
- 10.1.3. Soy
- 10.1.4. Other Sources
- 10.2. Market Analysis, Insights and Forecast - by Type of Packaging
- 10.2.1. Bottles
- 10.2.2. Cans
- 10.2.3. Others
- 10.3. Market Analysis, Insights and Forecast - by Distribution Channel
- 10.3.1. Supermarkets/Hypermarkets
- 10.3.2. Pharmacies/Drugstores
- 10.3.3. Specialist Retailers
- 10.3.4. Online Retail
- 10.3.5. Other Channels
- 10.1. Market Analysis, Insights and Forecast - by Source
- 11. Competitive Analysis
- 11.1. Global Market Share Analysis 2024
- 11.2. Company Profiles
- 11.2.1 Kellogg Company
- 11.2.1.1. Overview
- 11.2.1.2. Products
- 11.2.1.3. SWOT Analysis
- 11.2.1.4. Recent Developments
- 11.2.1.5. Financials (Based on Availability)
- 11.2.2 Glanbia PLC
- 11.2.2.1. Overview
- 11.2.2.2. Products
- 11.2.2.3. SWOT Analysis
- 11.2.2.4. Recent Developments
- 11.2.2.5. Financials (Based on Availability)
- 11.2.3 PepsiCo Inc
- 11.2.3.1. Overview
- 11.2.3.2. Products
- 11.2.3.3. SWOT Analysis
- 11.2.3.4. Recent Developments
- 11.2.3.5. Financials (Based on Availability)
- 11.2.4 Halen Brands
- 11.2.4.1. Overview
- 11.2.4.2. Products
- 11.2.4.3. SWOT Analysis
- 11.2.4.4. Recent Developments
- 11.2.4.5. Financials (Based on Availability)
- 11.2.5 Post Holdings Inc
- 11.2.5.1. Overview
- 11.2.5.2. Products
- 11.2.5.3. SWOT Analysis
- 11.2.5.4. Recent Developments
- 11.2.5.5. Financials (Based on Availability)
- 11.2.6 Koia
- 11.2.6.1. Overview
- 11.2.6.2. Products
- 11.2.6.3. SWOT Analysis
- 11.2.6.4. Recent Developments
- 11.2.6.5. Financials (Based on Availability)
- 11.2.7 Abbott Nutrition
- 11.2.7.1. Overview
- 11.2.7.2. Products
- 11.2.7.3. SWOT Analysis
- 11.2.7.4. Recent Developments
- 11.2.7.5. Financials (Based on Availability)
- 11.2.8 Labrada Nutrition
- 11.2.8.1. Overview
- 11.2.8.2. Products
- 11.2.8.3. SWOT Analysis
- 11.2.8.4. Recent Developments
- 11.2.8.5. Financials (Based on Availability)
- 11.2.9 The Coca Cola Company
- 11.2.9.1. Overview
- 11.2.9.2. Products
- 11.2.9.3. SWOT Analysis
- 11.2.9.4. Recent Developments
- 11.2.9.5. Financials (Based on Availability)
- 11.2.10 Pure Protein*List Not Exhaustive
- 11.2.10.1. Overview
- 11.2.10.2. Products
- 11.2.10.3. SWOT Analysis
- 11.2.10.4. Recent Developments
- 11.2.10.5. Financials (Based on Availability)
- 11.2.1 Kellogg Company
List of Figures
- Figure 1: Global RTD Protein Industry Revenue Breakdown (Million, %) by Region 2024 & 2032
- Figure 2: Global RTD Protein Industry Volume Breakdown (Billion, %) by Region 2024 & 2032
- Figure 3: North America RTD Protein Industry Revenue (Million), by Source 2024 & 2032
- Figure 4: North America RTD Protein Industry Volume (Billion), by Source 2024 & 2032
- Figure 5: North America RTD Protein Industry Revenue Share (%), by Source 2024 & 2032
- Figure 6: North America RTD Protein Industry Volume Share (%), by Source 2024 & 2032
- Figure 7: North America RTD Protein Industry Revenue (Million), by Type of Packaging 2024 & 2032
- Figure 8: North America RTD Protein Industry Volume (Billion), by Type of Packaging 2024 & 2032
- Figure 9: North America RTD Protein Industry Revenue Share (%), by Type of Packaging 2024 & 2032
- Figure 10: North America RTD Protein Industry Volume Share (%), by Type of Packaging 2024 & 2032
- Figure 11: North America RTD Protein Industry Revenue (Million), by Distribution Channel 2024 & 2032
- Figure 12: North America RTD Protein Industry Volume (Billion), by Distribution Channel 2024 & 2032
- Figure 13: North America RTD Protein Industry Revenue Share (%), by Distribution Channel 2024 & 2032
- Figure 14: North America RTD Protein Industry Volume Share (%), by Distribution Channel 2024 & 2032
- Figure 15: North America RTD Protein Industry Revenue (Million), by Country 2024 & 2032
- Figure 16: North America RTD Protein Industry Volume (Billion), by Country 2024 & 2032
- Figure 17: North America RTD Protein Industry Revenue Share (%), by Country 2024 & 2032
- Figure 18: North America RTD Protein Industry Volume Share (%), by Country 2024 & 2032
- Figure 19: Europe RTD Protein Industry Revenue (Million), by Source 2024 & 2032
- Figure 20: Europe RTD Protein Industry Volume (Billion), by Source 2024 & 2032
- Figure 21: Europe RTD Protein Industry Revenue Share (%), by Source 2024 & 2032
- Figure 22: Europe RTD Protein Industry Volume Share (%), by Source 2024 & 2032
- Figure 23: Europe RTD Protein Industry Revenue (Million), by Type of Packaging 2024 & 2032
- Figure 24: Europe RTD Protein Industry Volume (Billion), by Type of Packaging 2024 & 2032
- Figure 25: Europe RTD Protein Industry Revenue Share (%), by Type of Packaging 2024 & 2032
- Figure 26: Europe RTD Protein Industry Volume Share (%), by Type of Packaging 2024 & 2032
- Figure 27: Europe RTD Protein Industry Revenue (Million), by Distribution Channel 2024 & 2032
- Figure 28: Europe RTD Protein Industry Volume (Billion), by Distribution Channel 2024 & 2032
- Figure 29: Europe RTD Protein Industry Revenue Share (%), by Distribution Channel 2024 & 2032
- Figure 30: Europe RTD Protein Industry Volume Share (%), by Distribution Channel 2024 & 2032
- Figure 31: Europe RTD Protein Industry Revenue (Million), by Country 2024 & 2032
- Figure 32: Europe RTD Protein Industry Volume (Billion), by Country 2024 & 2032
- Figure 33: Europe RTD Protein Industry Revenue Share (%), by Country 2024 & 2032
- Figure 34: Europe RTD Protein Industry Volume Share (%), by Country 2024 & 2032
- Figure 35: Asia Pacific RTD Protein Industry Revenue (Million), by Source 2024 & 2032
- Figure 36: Asia Pacific RTD Protein Industry Volume (Billion), by Source 2024 & 2032
- Figure 37: Asia Pacific RTD Protein Industry Revenue Share (%), by Source 2024 & 2032
- Figure 38: Asia Pacific RTD Protein Industry Volume Share (%), by Source 2024 & 2032
- Figure 39: Asia Pacific RTD Protein Industry Revenue (Million), by Type of Packaging 2024 & 2032
- Figure 40: Asia Pacific RTD Protein Industry Volume (Billion), by Type of Packaging 2024 & 2032
- Figure 41: Asia Pacific RTD Protein Industry Revenue Share (%), by Type of Packaging 2024 & 2032
- Figure 42: Asia Pacific RTD Protein Industry Volume Share (%), by Type of Packaging 2024 & 2032
- Figure 43: Asia Pacific RTD Protein Industry Revenue (Million), by Distribution Channel 2024 & 2032
- Figure 44: Asia Pacific RTD Protein Industry Volume (Billion), by Distribution Channel 2024 & 2032
- Figure 45: Asia Pacific RTD Protein Industry Revenue Share (%), by Distribution Channel 2024 & 2032
- Figure 46: Asia Pacific RTD Protein Industry Volume Share (%), by Distribution Channel 2024 & 2032
- Figure 47: Asia Pacific RTD Protein Industry Revenue (Million), by Country 2024 & 2032
- Figure 48: Asia Pacific RTD Protein Industry Volume (Billion), by Country 2024 & 2032
- Figure 49: Asia Pacific RTD Protein Industry Revenue Share (%), by Country 2024 & 2032
- Figure 50: Asia Pacific RTD Protein Industry Volume Share (%), by Country 2024 & 2032
- Figure 51: South America RTD Protein Industry Revenue (Million), by Source 2024 & 2032
- Figure 52: South America RTD Protein Industry Volume (Billion), by Source 2024 & 2032
- Figure 53: South America RTD Protein Industry Revenue Share (%), by Source 2024 & 2032
- Figure 54: South America RTD Protein Industry Volume Share (%), by Source 2024 & 2032
- Figure 55: South America RTD Protein Industry Revenue (Million), by Type of Packaging 2024 & 2032
- Figure 56: South America RTD Protein Industry Volume (Billion), by Type of Packaging 2024 & 2032
- Figure 57: South America RTD Protein Industry Revenue Share (%), by Type of Packaging 2024 & 2032
- Figure 58: South America RTD Protein Industry Volume Share (%), by Type of Packaging 2024 & 2032
- Figure 59: South America RTD Protein Industry Revenue (Million), by Distribution Channel 2024 & 2032
- Figure 60: South America RTD Protein Industry Volume (Billion), by Distribution Channel 2024 & 2032
- Figure 61: South America RTD Protein Industry Revenue Share (%), by Distribution Channel 2024 & 2032
- Figure 62: South America RTD Protein Industry Volume Share (%), by Distribution Channel 2024 & 2032
- Figure 63: South America RTD Protein Industry Revenue (Million), by Country 2024 & 2032
- Figure 64: South America RTD Protein Industry Volume (Billion), by Country 2024 & 2032
- Figure 65: South America RTD Protein Industry Revenue Share (%), by Country 2024 & 2032
- Figure 66: South America RTD Protein Industry Volume Share (%), by Country 2024 & 2032
- Figure 67: Middle East and Africa RTD Protein Industry Revenue (Million), by Source 2024 & 2032
- Figure 68: Middle East and Africa RTD Protein Industry Volume (Billion), by Source 2024 & 2032
- Figure 69: Middle East and Africa RTD Protein Industry Revenue Share (%), by Source 2024 & 2032
- Figure 70: Middle East and Africa RTD Protein Industry Volume Share (%), by Source 2024 & 2032
- Figure 71: Middle East and Africa RTD Protein Industry Revenue (Million), by Type of Packaging 2024 & 2032
- Figure 72: Middle East and Africa RTD Protein Industry Volume (Billion), by Type of Packaging 2024 & 2032
- Figure 73: Middle East and Africa RTD Protein Industry Revenue Share (%), by Type of Packaging 2024 & 2032
- Figure 74: Middle East and Africa RTD Protein Industry Volume Share (%), by Type of Packaging 2024 & 2032
- Figure 75: Middle East and Africa RTD Protein Industry Revenue (Million), by Distribution Channel 2024 & 2032
- Figure 76: Middle East and Africa RTD Protein Industry Volume (Billion), by Distribution Channel 2024 & 2032
- Figure 77: Middle East and Africa RTD Protein Industry Revenue Share (%), by Distribution Channel 2024 & 2032
- Figure 78: Middle East and Africa RTD Protein Industry Volume Share (%), by Distribution Channel 2024 & 2032
- Figure 79: Middle East and Africa RTD Protein Industry Revenue (Million), by Country 2024 & 2032
- Figure 80: Middle East and Africa RTD Protein Industry Volume (Billion), by Country 2024 & 2032
- Figure 81: Middle East and Africa RTD Protein Industry Revenue Share (%), by Country 2024 & 2032
- Figure 82: Middle East and Africa RTD Protein Industry Volume Share (%), by Country 2024 & 2032
List of Tables
- Table 1: Global RTD Protein Industry Revenue Million Forecast, by Region 2019 & 2032
- Table 2: Global RTD Protein Industry Volume Billion Forecast, by Region 2019 & 2032
- Table 3: Global RTD Protein Industry Revenue Million Forecast, by Source 2019 & 2032
- Table 4: Global RTD Protein Industry Volume Billion Forecast, by Source 2019 & 2032
- Table 5: Global RTD Protein Industry Revenue Million Forecast, by Type of Packaging 2019 & 2032
- Table 6: Global RTD Protein Industry Volume Billion Forecast, by Type of Packaging 2019 & 2032
- Table 7: Global RTD Protein Industry Revenue Million Forecast, by Distribution Channel 2019 & 2032
- Table 8: Global RTD Protein Industry Volume Billion Forecast, by Distribution Channel 2019 & 2032
- Table 9: Global RTD Protein Industry Revenue Million Forecast, by Region 2019 & 2032
- Table 10: Global RTD Protein Industry Volume Billion Forecast, by Region 2019 & 2032
- Table 11: Global RTD Protein Industry Revenue Million Forecast, by Source 2019 & 2032
- Table 12: Global RTD Protein Industry Volume Billion Forecast, by Source 2019 & 2032
- Table 13: Global RTD Protein Industry Revenue Million Forecast, by Type of Packaging 2019 & 2032
- Table 14: Global RTD Protein Industry Volume Billion Forecast, by Type of Packaging 2019 & 2032
- Table 15: Global RTD Protein Industry Revenue Million Forecast, by Distribution Channel 2019 & 2032
- Table 16: Global RTD Protein Industry Volume Billion Forecast, by Distribution Channel 2019 & 2032
- Table 17: Global RTD Protein Industry Revenue Million Forecast, by Country 2019 & 2032
- Table 18: Global RTD Protein Industry Volume Billion Forecast, by Country 2019 & 2032
- Table 19: United States RTD Protein Industry Revenue (Million) Forecast, by Application 2019 & 2032
- Table 20: United States RTD Protein Industry Volume (Billion) Forecast, by Application 2019 & 2032
- Table 21: Canada RTD Protein Industry Revenue (Million) Forecast, by Application 2019 & 2032
- Table 22: Canada RTD Protein Industry Volume (Billion) Forecast, by Application 2019 & 2032
- Table 23: Mexico RTD Protein Industry Revenue (Million) Forecast, by Application 2019 & 2032
- Table 24: Mexico RTD Protein Industry Volume (Billion) Forecast, by Application 2019 & 2032
- Table 25: Rest of North America RTD Protein Industry Revenue (Million) Forecast, by Application 2019 & 2032
- Table 26: Rest of North America RTD Protein Industry Volume (Billion) Forecast, by Application 2019 & 2032
- Table 27: Global RTD Protein Industry Revenue Million Forecast, by Source 2019 & 2032
- Table 28: Global RTD Protein Industry Volume Billion Forecast, by Source 2019 & 2032
- Table 29: Global RTD Protein Industry Revenue Million Forecast, by Type of Packaging 2019 & 2032
- Table 30: Global RTD Protein Industry Volume Billion Forecast, by Type of Packaging 2019 & 2032
- Table 31: Global RTD Protein Industry Revenue Million Forecast, by Distribution Channel 2019 & 2032
- Table 32: Global RTD Protein Industry Volume Billion Forecast, by Distribution Channel 2019 & 2032
- Table 33: Global RTD Protein Industry Revenue Million Forecast, by Country 2019 & 2032
- Table 34: Global RTD Protein Industry Volume Billion Forecast, by Country 2019 & 2032
- Table 35: Germany RTD Protein Industry Revenue (Million) Forecast, by Application 2019 & 2032
- Table 36: Germany RTD Protein Industry Volume (Billion) Forecast, by Application 2019 & 2032
- Table 37: United Kingdom RTD Protein Industry Revenue (Million) Forecast, by Application 2019 & 2032
- Table 38: United Kingdom RTD Protein Industry Volume (Billion) Forecast, by Application 2019 & 2032
- Table 39: France RTD Protein Industry Revenue (Million) Forecast, by Application 2019 & 2032
- Table 40: France RTD Protein Industry Volume (Billion) Forecast, by Application 2019 & 2032
- Table 41: Spain RTD Protein Industry Revenue (Million) Forecast, by Application 2019 & 2032
- Table 42: Spain RTD Protein Industry Volume (Billion) Forecast, by Application 2019 & 2032
- Table 43: Italy RTD Protein Industry Revenue (Million) Forecast, by Application 2019 & 2032
- Table 44: Italy RTD Protein Industry Volume (Billion) Forecast, by Application 2019 & 2032
- Table 45: Russia RTD Protein Industry Revenue (Million) Forecast, by Application 2019 & 2032
- Table 46: Russia RTD Protein Industry Volume (Billion) Forecast, by Application 2019 & 2032
- Table 47: Rest of Europe RTD Protein Industry Revenue (Million) Forecast, by Application 2019 & 2032
- Table 48: Rest of Europe RTD Protein Industry Volume (Billion) Forecast, by Application 2019 & 2032
- Table 49: Global RTD Protein Industry Revenue Million Forecast, by Source 2019 & 2032
- Table 50: Global RTD Protein Industry Volume Billion Forecast, by Source 2019 & 2032
- Table 51: Global RTD Protein Industry Revenue Million Forecast, by Type of Packaging 2019 & 2032
- Table 52: Global RTD Protein Industry Volume Billion Forecast, by Type of Packaging 2019 & 2032
- Table 53: Global RTD Protein Industry Revenue Million Forecast, by Distribution Channel 2019 & 2032
- Table 54: Global RTD Protein Industry Volume Billion Forecast, by Distribution Channel 2019 & 2032
- Table 55: Global RTD Protein Industry Revenue Million Forecast, by Country 2019 & 2032
- Table 56: Global RTD Protein Industry Volume Billion Forecast, by Country 2019 & 2032
- Table 57: China RTD Protein Industry Revenue (Million) Forecast, by Application 2019 & 2032
- Table 58: China RTD Protein Industry Volume (Billion) Forecast, by Application 2019 & 2032
- Table 59: Japan RTD Protein Industry Revenue (Million) Forecast, by Application 2019 & 2032
- Table 60: Japan RTD Protein Industry Volume (Billion) Forecast, by Application 2019 & 2032
- Table 61: India RTD Protein Industry Revenue (Million) Forecast, by Application 2019 & 2032
- Table 62: India RTD Protein Industry Volume (Billion) Forecast, by Application 2019 & 2032
- Table 63: Australia RTD Protein Industry Revenue (Million) Forecast, by Application 2019 & 2032
- Table 64: Australia RTD Protein Industry Volume (Billion) Forecast, by Application 2019 & 2032
- Table 65: Rest of Asia Pacific RTD Protein Industry Revenue (Million) Forecast, by Application 2019 & 2032
- Table 66: Rest of Asia Pacific RTD Protein Industry Volume (Billion) Forecast, by Application 2019 & 2032
- Table 67: Global RTD Protein Industry Revenue Million Forecast, by Source 2019 & 2032
- Table 68: Global RTD Protein Industry Volume Billion Forecast, by Source 2019 & 2032
- Table 69: Global RTD Protein Industry Revenue Million Forecast, by Type of Packaging 2019 & 2032
- Table 70: Global RTD Protein Industry Volume Billion Forecast, by Type of Packaging 2019 & 2032
- Table 71: Global RTD Protein Industry Revenue Million Forecast, by Distribution Channel 2019 & 2032
- Table 72: Global RTD Protein Industry Volume Billion Forecast, by Distribution Channel 2019 & 2032
- Table 73: Global RTD Protein Industry Revenue Million Forecast, by Country 2019 & 2032
- Table 74: Global RTD Protein Industry Volume Billion Forecast, by Country 2019 & 2032
- Table 75: Brazil RTD Protein Industry Revenue (Million) Forecast, by Application 2019 & 2032
- Table 76: Brazil RTD Protein Industry Volume (Billion) Forecast, by Application 2019 & 2032
- Table 77: Argentina RTD Protein Industry Revenue (Million) Forecast, by Application 2019 & 2032
- Table 78: Argentina RTD Protein Industry Volume (Billion) Forecast, by Application 2019 & 2032
- Table 79: Rest of South America RTD Protein Industry Revenue (Million) Forecast, by Application 2019 & 2032
- Table 80: Rest of South America RTD Protein Industry Volume (Billion) Forecast, by Application 2019 & 2032
- Table 81: Global RTD Protein Industry Revenue Million Forecast, by Source 2019 & 2032
- Table 82: Global RTD Protein Industry Volume Billion Forecast, by Source 2019 & 2032
- Table 83: Global RTD Protein Industry Revenue Million Forecast, by Type of Packaging 2019 & 2032
- Table 84: Global RTD Protein Industry Volume Billion Forecast, by Type of Packaging 2019 & 2032
- Table 85: Global RTD Protein Industry Revenue Million Forecast, by Distribution Channel 2019 & 2032
- Table 86: Global RTD Protein Industry Volume Billion Forecast, by Distribution Channel 2019 & 2032
- Table 87: Global RTD Protein Industry Revenue Million Forecast, by Country 2019 & 2032
- Table 88: Global RTD Protein Industry Volume Billion Forecast, by Country 2019 & 2032
- Table 89: South Africa RTD Protein Industry Revenue (Million) Forecast, by Application 2019 & 2032
- Table 90: South Africa RTD Protein Industry Volume (Billion) Forecast, by Application 2019 & 2032
- Table 91: United Arab Emirates RTD Protein Industry Revenue (Million) Forecast, by Application 2019 & 2032
- Table 92: United Arab Emirates RTD Protein Industry Volume (Billion) Forecast, by Application 2019 & 2032
- Table 93: Rest of Middle East and Africa RTD Protein Industry Revenue (Million) Forecast, by Application 2019 & 2032
- Table 94: Rest of Middle East and Africa RTD Protein Industry Volume (Billion) Forecast, by Application 2019 & 2032
Frequently Asked Questions
1. What is the projected Compound Annual Growth Rate (CAGR) of the RTD Protein Industry?
The projected CAGR is approximately 7.72%.
2. Which companies are prominent players in the RTD Protein Industry?
Key companies in the market include Kellogg Company, Glanbia PLC, PepsiCo Inc, Halen Brands, Post Holdings Inc, Koia, Abbott Nutrition, Labrada Nutrition, The Coca Cola Company, Pure Protein*List Not Exhaustive.
3. What are the main segments of the RTD Protein Industry?
The market segments include Source, Type of Packaging, Distribution Channel.
4. Can you provide details about the market size?
The market size is estimated to be USD 1.68 Million as of 2022.
5. What are some drivers contributing to market growth?
N/A
6. What are the notable trends driving market growth?
Strong Demand from Health Conscious Consumers.
7. Are there any restraints impacting market growth?
N/A
8. Can you provide examples of recent developments in the market?
March 2022: QNT SA and Qimia Makmal Arad Company entered a partnership. Qimia is authorized in Iran to distribute QNT's functional foods, supplements, and sports nutrition products.
9. What pricing options are available for accessing the report?
Pricing options include single-user, multi-user, and enterprise licenses priced at USD 4750, USD 5250, and USD 8750 respectively.
10. Is the market size provided in terms of value or volume?
The market size is provided in terms of value, measured in Million and volume, measured in Billion.
11. Are there any specific market keywords associated with the report?
Yes, the market keyword associated with the report is "RTD Protein Industry," which aids in identifying and referencing the specific market segment covered.
12. How do I determine which pricing option suits my needs best?
The pricing options vary based on user requirements and access needs. Individual users may opt for single-user licenses, while businesses requiring broader access may choose multi-user or enterprise licenses for cost-effective access to the report.
13. Are there any additional resources or data provided in the RTD Protein Industry report?
While the report offers comprehensive insights, it's advisable to review the specific contents or supplementary materials provided to ascertain if additional resources or data are available.
14. How can I stay updated on further developments or reports in the RTD Protein Industry?
To stay informed about further developments, trends, and reports in the RTD Protein Industry, consider subscribing to industry newsletters, following relevant companies and organizations, or regularly checking reputable industry news sources and publications.
Methodology
Step 1 - Identification of Relevant Samples Size from Population Database


Step 2 - Approaches for Defining Global Market Size (Value, Volume* & Price*)

Note*: In applicable scenarios
Step 3 - Data Sources
Primary Research
- Web Analytics
- Survey Reports
- Research Institute
- Latest Research Reports
- Opinion Leaders
Secondary Research
- Annual Reports
- White Paper
- Latest Press Release
- Industry Association
- Paid Database
- Investor Presentations

Step 4 - Data Triangulation
Involves using different sources of information in order to increase the validity of a study
These sources are likely to be stakeholders in a program - participants, other researchers, program staff, other community members, and so on.
Then we put all data in single framework & apply various statistical tools to find out the dynamic on the market.
During the analysis stage, feedback from the stakeholder groups would be compared to determine areas of agreement as well as areas of divergence


