Key Insights
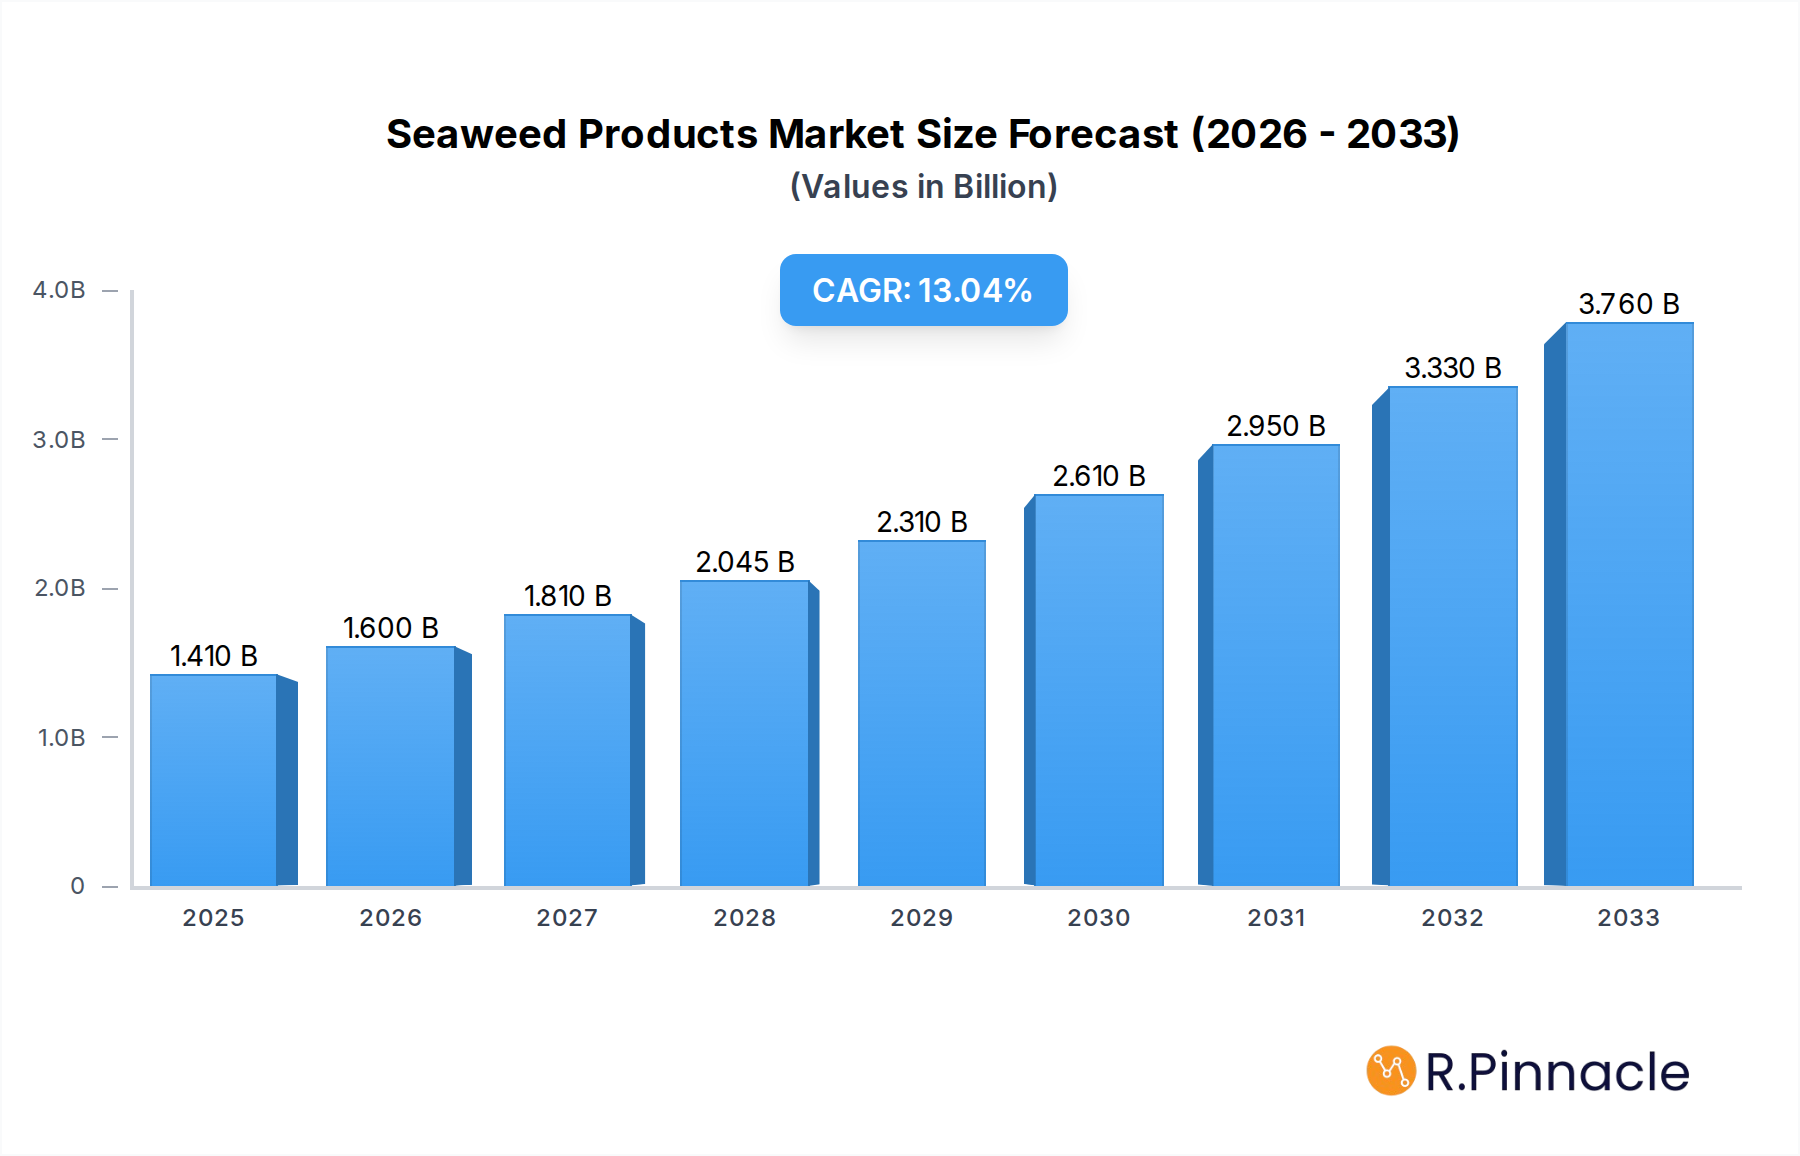
The global seaweed products market is poised for substantial expansion, projected to reach USD 1.41 billion in 2025. This growth is fueled by a robust Compound Annual Growth Rate (CAGR) of 13.6% during the forecast period of 2025-2033. A significant driver for this surge is the increasing consumer demand for natural and sustainable ingredients across various industries. The food sector, with its growing interest in functional foods and healthier alternatives, represents a primary application area. Similarly, the animal feed industry is recognizing the nutritional benefits of seaweed, incorporating it to enhance livestock health and productivity. The cosmetic industry is also leveraging seaweed's unique properties for skincare and beauty products, driven by the "clean beauty" movement. Furthermore, industrial applications, including the extraction of alginates for manufacturing and agriculture as a natural fertilizer, contribute significantly to market demand. The diversification of applications, from high-value nutraceuticals to essential industrial inputs, underpins the market's upward trajectory.

Seaweed Products Market Size (In Billion)
Emerging trends such as the development of novel extraction techniques for higher yields and purity, coupled with the exploration of lesser-utilized seaweed species, are expected to further propel market growth. Innovations in processing technologies are making seaweed products more accessible and versatile. However, certain restraints, including seasonal availability, the environmental impact of large-scale harvesting, and regulatory hurdles in some regions, could pose challenges. Despite these, the inherent sustainability of seaweed cultivation and its wide array of beneficial compounds present a compelling case for continued investment and innovation. Key market players are actively engaged in research and development, strategic partnerships, and capacity expansion to capitalize on the burgeoning opportunities presented by this dynamic market. The dominant presence of Asia Pacific, particularly China, in production and consumption, alongside growing demand in North America and Europe, highlights the global appeal of seaweed-derived products.
Seaweed Products Company Market Share
Unlocking the Billion-Dollar Seaweed Products Market: A Comprehensive Industry Analysis (2019–2033)
This in-depth report provides a critical analysis of the global Seaweed Products market, projecting it to reach over a billion dollars in value. Spanning from 2019 to 2033, with a base year of 2025 and a forecast period of 2025–2033, this research delves into market structure, dynamics, regional dominance, product innovations, and future outlook. We meticulously examine the evolving landscape, driven by surging demand for sustainable ingredients and functional benefits across food, feed, cosmetic, medicine, and industrial sectors. This report is your essential guide to understanding market concentration, innovation trends, regulatory frameworks, and the key players shaping the future of the seaweed industry.
Seaweed Products Market Structure & Innovation Trends
The global Seaweed Products market exhibits a moderate to highly concentrated structure, with a few dominant players accounting for a significant portion of the market share, estimated at over 60% in 2025. Innovation remains a critical differentiator, fueled by increasing research and development in extraction technologies, novel product formulations, and the discovery of new bioactive compounds. Regulatory frameworks, particularly concerning food safety, ingredient sourcing, and sustainability certifications, are becoming increasingly stringent, influencing market entry and product development strategies. Product substitutes, while present in some application areas like thickeners and fertilizers, are increasingly being overshadowed by the superior functional properties and sustainability credentials of seaweed-derived alternatives. End-user demographics are expanding, with a growing consumer preference for natural, organic, and ethically sourced products driving demand across all segments. Mergers and acquisitions (M&A) are a significant market trend, with estimated deal values exceeding hundreds of millions of dollars annually, aimed at consolidating market share, acquiring advanced technologies, and expanding geographical reach.
- Market Concentration: Dominated by key players with substantial market share.
- Innovation Drivers: Advanced extraction techniques, novel bioactive compounds, sustainable processing.
- Regulatory Landscape: Increasing focus on safety, sustainability, and traceability.
- Product Substitutes: Declining relevance due to superior seaweed attributes.
- End-User Demographics: Growing demand from health-conscious and environmentally aware consumers.
- M&A Activities: Strategic consolidation and technology acquisition driving growth.
Seaweed Products Market Dynamics & Trends
The Seaweed Products market is poised for substantial growth, driven by a confluence of powerful factors. The Compound Annual Growth Rate (CAGR) is projected to be robust, estimated at over 8% during the forecast period. A primary growth driver is the escalating global demand for sustainable and functional ingredients. Consumers are increasingly seeking natural alternatives in their diets, cosmetics, and even industrial applications, positioning seaweed as an ideal solution due to its rich nutritional profile and environmentally friendly cultivation. Technological advancements in seaweed processing and extraction are unlocking new applications and improving product efficacy. These innovations allow for the isolation of high-value compounds like alginates, carrageenan, and fucoidan, which are finding widespread use in the food industry as emulsifiers and thickeners, in animal feed for enhanced nutrition, in cosmetics for moisturizing and anti-aging properties, and in the pharmaceutical sector for their medicinal benefits. Furthermore, the burgeoning aquaculture industry, focusing on sustainable and eco-friendly practices, is significantly boosting seaweed cultivation, thereby ensuring a stable and scalable supply. Consumer preferences are shifting towards plant-based and natural ingredients, further accelerating the adoption of seaweed products. The competitive dynamics within the market are intensifying, with established players investing heavily in research and development and emerging companies focusing on niche applications and sustainable sourcing. Market penetration is expected to rise across all key segments, with the food and beverage sector leading in terms of volume and value, followed closely by animal feed and cosmetics. The growing awareness of seaweed's health benefits, including its antioxidant, anti-inflammatory, and immune-boosting properties, is also a significant contributor to market expansion. The expanding applications in industrial sectors, such as biodegradable plastics and biofuels, present additional avenues for market growth. The global market size for seaweed products is estimated to reach over 20 billion dollars by 2025.
Dominant Regions & Segments in Seaweed Products
The global Seaweed Products market is characterized by distinct regional strengths and segment dominance. Asia-Pacific, particularly countries like China, Japan, and South Korea, currently holds the largest market share, estimated at over 60% of the global market value in 2025. This dominance is attributed to the region's long-standing culinary traditions deeply intertwined with seaweed consumption, well-established aquaculture infrastructure, and significant production capabilities. Within this region, China is the leading country, accounting for a substantial portion of global seaweed production and exports.
The Application: Food segment represents the largest and fastest-growing segment, with an estimated market size of over 8 billion dollars in 2025. This dominance is driven by the widespread use of seaweed as a natural thickener, stabilizer, and nutritional enhancer in a myriad of food products, including soups, sauces, snacks, and processed foods. Increasing consumer demand for healthy and natural food ingredients further bolsters this segment.
The Types: Brown Algae (e.g., kelp, wakame) dominates the market, contributing over 50% of the total market revenue in 2025. Brown algae are rich in alginates, which are widely utilized in the food and pharmaceutical industries, and also offer significant benefits in animal feed and agricultural fertilizers.
- Leading Region: Asia-Pacific, with China as the primary contributor.
- Key Drivers: Strong traditional consumption, extensive aquaculture, robust production.
- Economic Policies: Government support for aquaculture and marine biotechnology.
- Infrastructure: Well-developed harvesting and processing facilities.
- Dominant Application Segment: Food.
- Key Drivers: Consumer demand for natural, healthy, and functional ingredients; wide use as thickeners and stabilizers.
- Growth Projections: Expected CAGR of over 9% for the Food segment.
- Market Size (2025): Estimated at over 8 billion dollars.
- Dominant Type: Brown Algae.
- Key Drivers: High yield, rich alginate content, versatile applications across industries.
- Market Size (2025): Estimated at over 11 billion dollars.
- Competitive Advantages: Cost-effectiveness and established supply chains.
Seaweed Products Product Innovations
Product innovation in the seaweed sector is rapidly expanding its utility. Companies are focusing on developing high-purity extracts with specific functional properties, such as enhanced gelling agents, bioactive compounds for nutraceuticals, and sustainable bioplastics. Innovations in extraction technologies are yielding superior yields and higher concentrations of valuable components like fucoidan and omega-3 fatty acids. These advancements translate into competitive advantages, enabling the creation of novel food ingredients, advanced cosmetic formulations with potent anti-aging and moisturizing effects, and specialized pharmaceutical applications targeting chronic diseases. The market fit for these innovations is strong, aligning with the global trend towards natural, sustainable, and health-promoting products.
Report Scope & Segmentation Analysis
This report provides a comprehensive segmentation of the Seaweed Products market, encompassing key application and type categories. The Application segments analyzed include: Food, Feed, Cosmetic and Medicine, Industrial, and Others (Agricultural Fertilizer etc.). The Food segment is projected to maintain its leadership, driven by increasing adoption in processed foods and plant-based alternatives, with an estimated market size of over 8 billion dollars in 2025 and a projected CAGR of over 9%. The Feed segment is also experiencing robust growth due to its nutritional benefits for livestock and aquaculture, with an estimated market of over 3 billion dollars in 2025.
The Types segments include: Red Algae, Brown Algae, Green Algae, and Others. Brown Algae are anticipated to hold the largest market share, valued at over 11 billion dollars in 2025, owing to their widespread use in food and industrial applications. Red Algae, particularly for carrageenan production, will also exhibit steady growth, with an estimated market of over 5 billion dollars in 2025.
Key Drivers of Seaweed Products Growth
The growth of the Seaweed Products market is propelled by several key factors. Technologically, advancements in cultivation techniques, harvesting efficiency, and extraction processes are unlocking greater potential and reducing production costs. Economically, the rising global disposable income and increasing consumer willingness to spend on premium, natural, and sustainable products are significant drivers. Regulatory support for sustainable aquaculture and the growing recognition of seaweed's environmental benefits, such as carbon sequestration, are also fostering market expansion. The increasing awareness of seaweed's inherent health benefits, including its rich mineral content and antioxidant properties, is fueling demand in the food and pharmaceutical sectors. Furthermore, the development of novel applications in bioplastics and biofuels presents substantial future growth opportunities.
Challenges in the Seaweed Products Sector
Despite its promising growth, the Seaweed Products sector faces several challenges. Regulatory hurdles, particularly regarding food safety standards, import/export regulations, and inconsistent labeling requirements across different regions, can impede market access and product commercialization. Supply chain complexities, including the seasonality of harvesting, potential for contamination, and the need for specialized logistics, can impact product availability and cost. Competitive pressures from established food ingredients and alternative raw materials also pose a challenge, necessitating continuous innovation and cost optimization. Furthermore, scaling up sustainable cultivation practices to meet rising demand without impacting marine ecosystems requires significant investment and research.
Emerging Opportunities in Seaweed Products
Emerging opportunities in the Seaweed Products market are diverse and promising. The burgeoning demand for plant-based and vegan food products presents a significant avenue for seaweed-based ingredients. Advances in biotechnology are enabling the development of high-value compounds from seaweed for pharmaceutical and nutraceutical applications, targeting areas like anti-cancer and anti-viral treatments. The growing emphasis on sustainable packaging is creating opportunities for seaweed-derived bioplastics and biodegradable materials. Furthermore, exploring new geographical markets with untapped potential for seaweed consumption and cultivation, coupled with the development of novel consumer products, will drive future growth. The expansion of seaweed-based animal feed as a sustainable alternative to traditional feed sources also represents a significant opportunity.
Leading Players in the Seaweed Products Market
- Seakura
- Kelpak
- Seagate Products
- Cargill
- Irish Seaweeds
- AlgAran
- Dakini Tidal Wilds
- Wild Irish Sea Veg
- Weihai Shidai Marine Biotechnology
- Shandong Lidao Oceanic Technology
- Fujian Lianjiang Tianyuan Aquatic
- Xunshan Group
- Qingdao Gather Great Ocean Algae
- Fujian Yiyuan Sea Food Company
- Fujian Huangqiwan Sea Food Biotechnology
- Rongcheng Lidao Chenfenzhuang Hongqiang Kelp Factory
- Rongcheng Lidao Chenfenzhuang Weijian Kelp Factory
- Rongcheng Yandunjiao Aquatic Company
- Shandong Gaolv Aquatic Company
- Shandong Haizhibao Technology
- Matsumaeya
Key Developments in Seaweed Products Industry
- 2024: Increased investment in research for novel bioactive compounds with pharmaceutical applications.
- 2023: Launch of advanced extraction technologies improving yield and purity of functional ingredients.
- 2023: Several companies reported significant M&A activities to consolidate market position and expand product portfolios.
- 2022: Growing adoption of seaweed-based ingredients in plant-based meat alternatives and dairy-free products.
- 2021: Expansion of seaweed cultivation in new regions driven by demand for sustainable aquaculture.
- 2020: Introduction of seaweed-derived biodegradable packaging solutions gaining traction.
- 2019: Enhanced focus on traceability and sustainability certifications for seaweed products.
Future Outlook for Seaweed Products Market
The future outlook for the Seaweed Products market is exceptionally bright, with sustained growth projected over the forecast period. Accelerating factors include the continued global shift towards sustainable and natural products, increasing consumer awareness of health and wellness benefits associated with seaweed consumption, and ongoing technological advancements that enhance production efficiency and product diversification. Strategic opportunities lie in further exploring high-value applications in the pharmaceutical and cosmetic industries, developing innovative functional food ingredients, and expanding the use of seaweed in industrial sectors like bioplastics and biofuels. Investments in sustainable aquaculture and research into novel seaweed species will be crucial for meeting future demand and unlocking new market potentials, solidifying seaweed's position as a critical and versatile resource in the global bioeconomy.
Seaweed Products Segmentation
-
1. Application
- 1.1. Food
- 1.2. Feed
- 1.3. Cosmetic and Medicine
- 1.4. Industrial
- 1.5. Others(Agricultural Fertilizer etc.)
-
2. Types
- 2.1. Red Algae
- 2.2. Brown Algae
- 2.3. Green Algae
- 2.4. Others
Seaweed Products Segmentation By Geography
-
1. North America
- 1.1. United States
- 1.2. Canada
- 1.3. Mexico
-
2. South America
- 2.1. Brazil
- 2.2. Argentina
- 2.3. Rest of South America
-
3. Europe
- 3.1. United Kingdom
- 3.2. Germany
- 3.3. France
- 3.4. Italy
- 3.5. Spain
- 3.6. Russia
- 3.7. Benelux
- 3.8. Nordics
- 3.9. Rest of Europe
-
4. Middle East & Africa
- 4.1. Turkey
- 4.2. Israel
- 4.3. GCC
- 4.4. North Africa
- 4.5. South Africa
- 4.6. Rest of Middle East & Africa
-
5. Asia Pacific
- 5.1. China
- 5.2. India
- 5.3. Japan
- 5.4. South Korea
- 5.5. ASEAN
- 5.6. Oceania
- 5.7. Rest of Asia Pacific
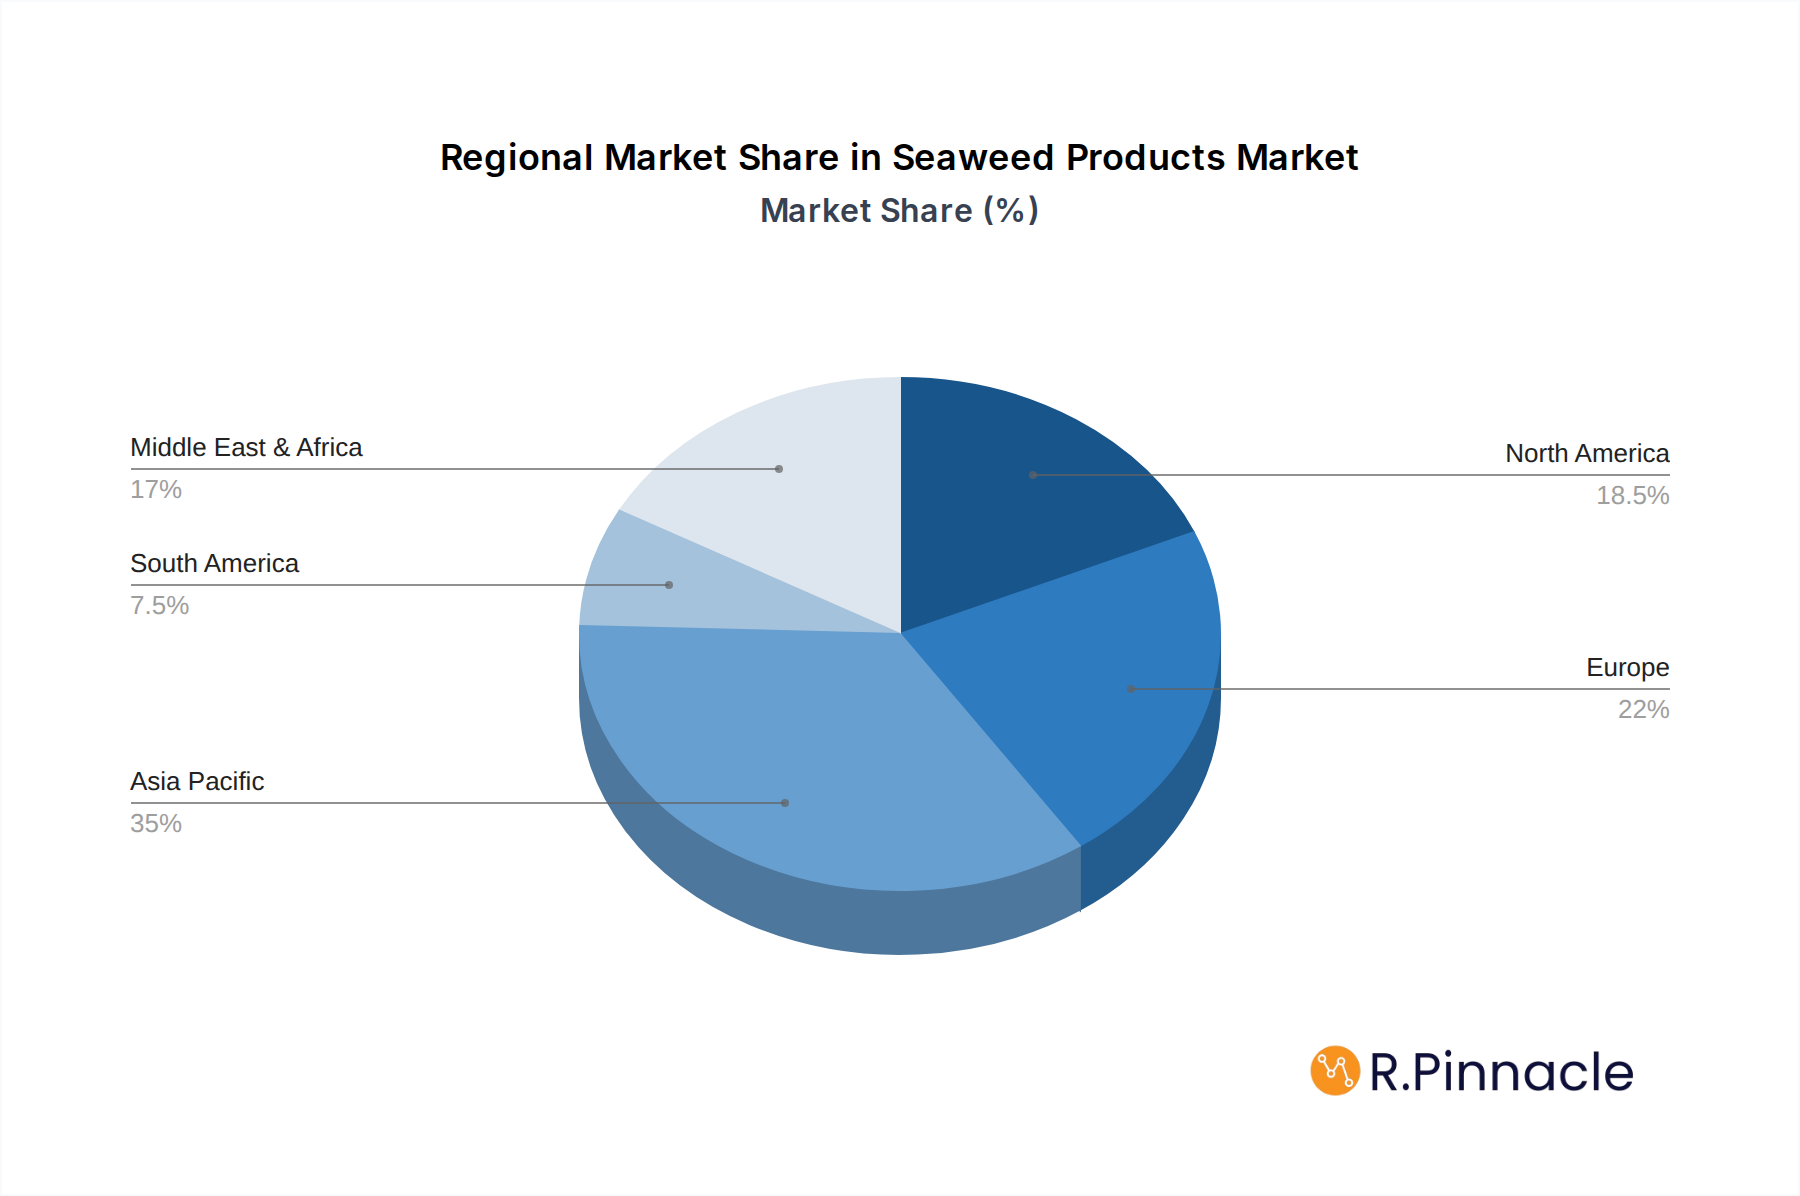
Seaweed Products Regional Market Share
Geographic Coverage of Seaweed Products
Seaweed Products REPORT HIGHLIGHTS
| Aspects | Details |
|---|---|
| Study Period | 2020-2034 |
| Base Year | 2025 |
| Estimated Year | 2026 |
| Forecast Period | 2026-2034 |
| Historical Period | 2020-2025 |
| Growth Rate | CAGR of 13.6% from 2020-2034 |
| Segmentation |
|
Table of Contents
- 1. Introduction
- 1.1. Research Scope
- 1.2. Market Segmentation
- 1.3. Research Methodology
- 1.4. Definitions and Assumptions
- 2. Executive Summary
- 2.1. Introduction
- 3. Market Dynamics
- 3.1. Introduction
- 3.2. Market Drivers
- 3.3. Market Restrains
- 3.4. Market Trends
- 4. Market Factor Analysis
- 4.1. Porters Five Forces
- 4.2. Supply/Value Chain
- 4.3. PESTEL analysis
- 4.4. Market Entropy
- 4.5. Patent/Trademark Analysis
- 5. Global Seaweed Products Analysis, Insights and Forecast, 2020-2032
- 5.1. Market Analysis, Insights and Forecast - by Application
- 5.1.1. Food
- 5.1.2. Feed
- 5.1.3. Cosmetic and Medicine
- 5.1.4. Industrial
- 5.1.5. Others(Agricultural Fertilizer etc.)
- 5.2. Market Analysis, Insights and Forecast - by Types
- 5.2.1. Red Algae
- 5.2.2. Brown Algae
- 5.2.3. Green Algae
- 5.2.4. Others
- 5.3. Market Analysis, Insights and Forecast - by Region
- 5.3.1. North America
- 5.3.2. South America
- 5.3.3. Europe
- 5.3.4. Middle East & Africa
- 5.3.5. Asia Pacific
- 5.1. Market Analysis, Insights and Forecast - by Application
- 6. North America Seaweed Products Analysis, Insights and Forecast, 2020-2032
- 6.1. Market Analysis, Insights and Forecast - by Application
- 6.1.1. Food
- 6.1.2. Feed
- 6.1.3. Cosmetic and Medicine
- 6.1.4. Industrial
- 6.1.5. Others(Agricultural Fertilizer etc.)
- 6.2. Market Analysis, Insights and Forecast - by Types
- 6.2.1. Red Algae
- 6.2.2. Brown Algae
- 6.2.3. Green Algae
- 6.2.4. Others
- 6.1. Market Analysis, Insights and Forecast - by Application
- 7. South America Seaweed Products Analysis, Insights and Forecast, 2020-2032
- 7.1. Market Analysis, Insights and Forecast - by Application
- 7.1.1. Food
- 7.1.2. Feed
- 7.1.3. Cosmetic and Medicine
- 7.1.4. Industrial
- 7.1.5. Others(Agricultural Fertilizer etc.)
- 7.2. Market Analysis, Insights and Forecast - by Types
- 7.2.1. Red Algae
- 7.2.2. Brown Algae
- 7.2.3. Green Algae
- 7.2.4. Others
- 7.1. Market Analysis, Insights and Forecast - by Application
- 8. Europe Seaweed Products Analysis, Insights and Forecast, 2020-2032
- 8.1. Market Analysis, Insights and Forecast - by Application
- 8.1.1. Food
- 8.1.2. Feed
- 8.1.3. Cosmetic and Medicine
- 8.1.4. Industrial
- 8.1.5. Others(Agricultural Fertilizer etc.)
- 8.2. Market Analysis, Insights and Forecast - by Types
- 8.2.1. Red Algae
- 8.2.2. Brown Algae
- 8.2.3. Green Algae
- 8.2.4. Others
- 8.1. Market Analysis, Insights and Forecast - by Application
- 9. Middle East & Africa Seaweed Products Analysis, Insights and Forecast, 2020-2032
- 9.1. Market Analysis, Insights and Forecast - by Application
- 9.1.1. Food
- 9.1.2. Feed
- 9.1.3. Cosmetic and Medicine
- 9.1.4. Industrial
- 9.1.5. Others(Agricultural Fertilizer etc.)
- 9.2. Market Analysis, Insights and Forecast - by Types
- 9.2.1. Red Algae
- 9.2.2. Brown Algae
- 9.2.3. Green Algae
- 9.2.4. Others
- 9.1. Market Analysis, Insights and Forecast - by Application
- 10. Asia Pacific Seaweed Products Analysis, Insights and Forecast, 2020-2032
- 10.1. Market Analysis, Insights and Forecast - by Application
- 10.1.1. Food
- 10.1.2. Feed
- 10.1.3. Cosmetic and Medicine
- 10.1.4. Industrial
- 10.1.5. Others(Agricultural Fertilizer etc.)
- 10.2. Market Analysis, Insights and Forecast - by Types
- 10.2.1. Red Algae
- 10.2.2. Brown Algae
- 10.2.3. Green Algae
- 10.2.4. Others
- 10.1. Market Analysis, Insights and Forecast - by Application
- 11. Competitive Analysis
- 11.1. Global Market Share Analysis 2025
- 11.2. Company Profiles
- 11.2.1 Seakura
- 11.2.1.1. Overview
- 11.2.1.2. Products
- 11.2.1.3. SWOT Analysis
- 11.2.1.4. Recent Developments
- 11.2.1.5. Financials (Based on Availability)
- 11.2.2 Kelpak
- 11.2.2.1. Overview
- 11.2.2.2. Products
- 11.2.2.3. SWOT Analysis
- 11.2.2.4. Recent Developments
- 11.2.2.5. Financials (Based on Availability)
- 11.2.3 Seagate Products
- 11.2.3.1. Overview
- 11.2.3.2. Products
- 11.2.3.3. SWOT Analysis
- 11.2.3.4. Recent Developments
- 11.2.3.5. Financials (Based on Availability)
- 11.2.4 Cargill
- 11.2.4.1. Overview
- 11.2.4.2. Products
- 11.2.4.3. SWOT Analysis
- 11.2.4.4. Recent Developments
- 11.2.4.5. Financials (Based on Availability)
- 11.2.5 Irish Seaweeds
- 11.2.5.1. Overview
- 11.2.5.2. Products
- 11.2.5.3. SWOT Analysis
- 11.2.5.4. Recent Developments
- 11.2.5.5. Financials (Based on Availability)
- 11.2.6 AlgAran
- 11.2.6.1. Overview
- 11.2.6.2. Products
- 11.2.6.3. SWOT Analysis
- 11.2.6.4. Recent Developments
- 11.2.6.5. Financials (Based on Availability)
- 11.2.7 Dakini Tidal Wilds
- 11.2.7.1. Overview
- 11.2.7.2. Products
- 11.2.7.3. SWOT Analysis
- 11.2.7.4. Recent Developments
- 11.2.7.5. Financials (Based on Availability)
- 11.2.8 Wild Irish Sea Veg
- 11.2.8.1. Overview
- 11.2.8.2. Products
- 11.2.8.3. SWOT Analysis
- 11.2.8.4. Recent Developments
- 11.2.8.5. Financials (Based on Availability)
- 11.2.9 Weihai Shidai Marine Biotechnology
- 11.2.9.1. Overview
- 11.2.9.2. Products
- 11.2.9.3. SWOT Analysis
- 11.2.9.4. Recent Developments
- 11.2.9.5. Financials (Based on Availability)
- 11.2.10 Shandong Lidao Oceanic Technology
- 11.2.10.1. Overview
- 11.2.10.2. Products
- 11.2.10.3. SWOT Analysis
- 11.2.10.4. Recent Developments
- 11.2.10.5. Financials (Based on Availability)
- 11.2.11 Fujian Lianjiang Tianyuan Aquatic
- 11.2.11.1. Overview
- 11.2.11.2. Products
- 11.2.11.3. SWOT Analysis
- 11.2.11.4. Recent Developments
- 11.2.11.5. Financials (Based on Availability)
- 11.2.12 Xunshan Group
- 11.2.12.1. Overview
- 11.2.12.2. Products
- 11.2.12.3. SWOT Analysis
- 11.2.12.4. Recent Developments
- 11.2.12.5. Financials (Based on Availability)
- 11.2.13 Qingdao Gather Great Ocean Algae
- 11.2.13.1. Overview
- 11.2.13.2. Products
- 11.2.13.3. SWOT Analysis
- 11.2.13.4. Recent Developments
- 11.2.13.5. Financials (Based on Availability)
- 11.2.14 Fujian Yiyuan Sea Food Company
- 11.2.14.1. Overview
- 11.2.14.2. Products
- 11.2.14.3. SWOT Analysis
- 11.2.14.4. Recent Developments
- 11.2.14.5. Financials (Based on Availability)
- 11.2.15 Fujian Huangqiwan Sea Food Biotechnology
- 11.2.15.1. Overview
- 11.2.15.2. Products
- 11.2.15.3. SWOT Analysis
- 11.2.15.4. Recent Developments
- 11.2.15.5. Financials (Based on Availability)
- 11.2.16 Rongcheng Lidao Chenfenzhuang Hongqiang Kelp Factory
- 11.2.16.1. Overview
- 11.2.16.2. Products
- 11.2.16.3. SWOT Analysis
- 11.2.16.4. Recent Developments
- 11.2.16.5. Financials (Based on Availability)
- 11.2.17 Rongcheng Lidao Chenfenzhuang Weijian Kelp Factory
- 11.2.17.1. Overview
- 11.2.17.2. Products
- 11.2.17.3. SWOT Analysis
- 11.2.17.4. Recent Developments
- 11.2.17.5. Financials (Based on Availability)
- 11.2.18 Rongcheng Yandunjiao Aquatic Company
- 11.2.18.1. Overview
- 11.2.18.2. Products
- 11.2.18.3. SWOT Analysis
- 11.2.18.4. Recent Developments
- 11.2.18.5. Financials (Based on Availability)
- 11.2.19 Shandong Gaolv Aquatic Company
- 11.2.19.1. Overview
- 11.2.19.2. Products
- 11.2.19.3. SWOT Analysis
- 11.2.19.4. Recent Developments
- 11.2.19.5. Financials (Based on Availability)
- 11.2.20 Shandong Haizhibao Technology
- 11.2.20.1. Overview
- 11.2.20.2. Products
- 11.2.20.3. SWOT Analysis
- 11.2.20.4. Recent Developments
- 11.2.20.5. Financials (Based on Availability)
- 11.2.21 Matsumaeya
- 11.2.21.1. Overview
- 11.2.21.2. Products
- 11.2.21.3. SWOT Analysis
- 11.2.21.4. Recent Developments
- 11.2.21.5. Financials (Based on Availability)
- 11.2.1 Seakura
List of Figures
- Figure 1: Global Seaweed Products Revenue Breakdown (billion, %) by Region 2025 & 2033
- Figure 2: Global Seaweed Products Volume Breakdown (K, %) by Region 2025 & 2033
- Figure 3: North America Seaweed Products Revenue (billion), by Application 2025 & 2033
- Figure 4: North America Seaweed Products Volume (K), by Application 2025 & 2033
- Figure 5: North America Seaweed Products Revenue Share (%), by Application 2025 & 2033
- Figure 6: North America Seaweed Products Volume Share (%), by Application 2025 & 2033
- Figure 7: North America Seaweed Products Revenue (billion), by Types 2025 & 2033
- Figure 8: North America Seaweed Products Volume (K), by Types 2025 & 2033
- Figure 9: North America Seaweed Products Revenue Share (%), by Types 2025 & 2033
- Figure 10: North America Seaweed Products Volume Share (%), by Types 2025 & 2033
- Figure 11: North America Seaweed Products Revenue (billion), by Country 2025 & 2033
- Figure 12: North America Seaweed Products Volume (K), by Country 2025 & 2033
- Figure 13: North America Seaweed Products Revenue Share (%), by Country 2025 & 2033
- Figure 14: North America Seaweed Products Volume Share (%), by Country 2025 & 2033
- Figure 15: South America Seaweed Products Revenue (billion), by Application 2025 & 2033
- Figure 16: South America Seaweed Products Volume (K), by Application 2025 & 2033
- Figure 17: South America Seaweed Products Revenue Share (%), by Application 2025 & 2033
- Figure 18: South America Seaweed Products Volume Share (%), by Application 2025 & 2033
- Figure 19: South America Seaweed Products Revenue (billion), by Types 2025 & 2033
- Figure 20: South America Seaweed Products Volume (K), by Types 2025 & 2033
- Figure 21: South America Seaweed Products Revenue Share (%), by Types 2025 & 2033
- Figure 22: South America Seaweed Products Volume Share (%), by Types 2025 & 2033
- Figure 23: South America Seaweed Products Revenue (billion), by Country 2025 & 2033
- Figure 24: South America Seaweed Products Volume (K), by Country 2025 & 2033
- Figure 25: South America Seaweed Products Revenue Share (%), by Country 2025 & 2033
- Figure 26: South America Seaweed Products Volume Share (%), by Country 2025 & 2033
- Figure 27: Europe Seaweed Products Revenue (billion), by Application 2025 & 2033
- Figure 28: Europe Seaweed Products Volume (K), by Application 2025 & 2033
- Figure 29: Europe Seaweed Products Revenue Share (%), by Application 2025 & 2033
- Figure 30: Europe Seaweed Products Volume Share (%), by Application 2025 & 2033
- Figure 31: Europe Seaweed Products Revenue (billion), by Types 2025 & 2033
- Figure 32: Europe Seaweed Products Volume (K), by Types 2025 & 2033
- Figure 33: Europe Seaweed Products Revenue Share (%), by Types 2025 & 2033
- Figure 34: Europe Seaweed Products Volume Share (%), by Types 2025 & 2033
- Figure 35: Europe Seaweed Products Revenue (billion), by Country 2025 & 2033
- Figure 36: Europe Seaweed Products Volume (K), by Country 2025 & 2033
- Figure 37: Europe Seaweed Products Revenue Share (%), by Country 2025 & 2033
- Figure 38: Europe Seaweed Products Volume Share (%), by Country 2025 & 2033
- Figure 39: Middle East & Africa Seaweed Products Revenue (billion), by Application 2025 & 2033
- Figure 40: Middle East & Africa Seaweed Products Volume (K), by Application 2025 & 2033
- Figure 41: Middle East & Africa Seaweed Products Revenue Share (%), by Application 2025 & 2033
- Figure 42: Middle East & Africa Seaweed Products Volume Share (%), by Application 2025 & 2033
- Figure 43: Middle East & Africa Seaweed Products Revenue (billion), by Types 2025 & 2033
- Figure 44: Middle East & Africa Seaweed Products Volume (K), by Types 2025 & 2033
- Figure 45: Middle East & Africa Seaweed Products Revenue Share (%), by Types 2025 & 2033
- Figure 46: Middle East & Africa Seaweed Products Volume Share (%), by Types 2025 & 2033
- Figure 47: Middle East & Africa Seaweed Products Revenue (billion), by Country 2025 & 2033
- Figure 48: Middle East & Africa Seaweed Products Volume (K), by Country 2025 & 2033
- Figure 49: Middle East & Africa Seaweed Products Revenue Share (%), by Country 2025 & 2033
- Figure 50: Middle East & Africa Seaweed Products Volume Share (%), by Country 2025 & 2033
- Figure 51: Asia Pacific Seaweed Products Revenue (billion), by Application 2025 & 2033
- Figure 52: Asia Pacific Seaweed Products Volume (K), by Application 2025 & 2033
- Figure 53: Asia Pacific Seaweed Products Revenue Share (%), by Application 2025 & 2033
- Figure 54: Asia Pacific Seaweed Products Volume Share (%), by Application 2025 & 2033
- Figure 55: Asia Pacific Seaweed Products Revenue (billion), by Types 2025 & 2033
- Figure 56: Asia Pacific Seaweed Products Volume (K), by Types 2025 & 2033
- Figure 57: Asia Pacific Seaweed Products Revenue Share (%), by Types 2025 & 2033
- Figure 58: Asia Pacific Seaweed Products Volume Share (%), by Types 2025 & 2033
- Figure 59: Asia Pacific Seaweed Products Revenue (billion), by Country 2025 & 2033
- Figure 60: Asia Pacific Seaweed Products Volume (K), by Country 2025 & 2033
- Figure 61: Asia Pacific Seaweed Products Revenue Share (%), by Country 2025 & 2033
- Figure 62: Asia Pacific Seaweed Products Volume Share (%), by Country 2025 & 2033
List of Tables
- Table 1: Global Seaweed Products Revenue billion Forecast, by Application 2020 & 2033
- Table 2: Global Seaweed Products Volume K Forecast, by Application 2020 & 2033
- Table 3: Global Seaweed Products Revenue billion Forecast, by Types 2020 & 2033
- Table 4: Global Seaweed Products Volume K Forecast, by Types 2020 & 2033
- Table 5: Global Seaweed Products Revenue billion Forecast, by Region 2020 & 2033
- Table 6: Global Seaweed Products Volume K Forecast, by Region 2020 & 2033
- Table 7: Global Seaweed Products Revenue billion Forecast, by Application 2020 & 2033
- Table 8: Global Seaweed Products Volume K Forecast, by Application 2020 & 2033
- Table 9: Global Seaweed Products Revenue billion Forecast, by Types 2020 & 2033
- Table 10: Global Seaweed Products Volume K Forecast, by Types 2020 & 2033
- Table 11: Global Seaweed Products Revenue billion Forecast, by Country 2020 & 2033
- Table 12: Global Seaweed Products Volume K Forecast, by Country 2020 & 2033
- Table 13: United States Seaweed Products Revenue (billion) Forecast, by Application 2020 & 2033
- Table 14: United States Seaweed Products Volume (K) Forecast, by Application 2020 & 2033
- Table 15: Canada Seaweed Products Revenue (billion) Forecast, by Application 2020 & 2033
- Table 16: Canada Seaweed Products Volume (K) Forecast, by Application 2020 & 2033
- Table 17: Mexico Seaweed Products Revenue (billion) Forecast, by Application 2020 & 2033
- Table 18: Mexico Seaweed Products Volume (K) Forecast, by Application 2020 & 2033
- Table 19: Global Seaweed Products Revenue billion Forecast, by Application 2020 & 2033
- Table 20: Global Seaweed Products Volume K Forecast, by Application 2020 & 2033
- Table 21: Global Seaweed Products Revenue billion Forecast, by Types 2020 & 2033
- Table 22: Global Seaweed Products Volume K Forecast, by Types 2020 & 2033
- Table 23: Global Seaweed Products Revenue billion Forecast, by Country 2020 & 2033
- Table 24: Global Seaweed Products Volume K Forecast, by Country 2020 & 2033
- Table 25: Brazil Seaweed Products Revenue (billion) Forecast, by Application 2020 & 2033
- Table 26: Brazil Seaweed Products Volume (K) Forecast, by Application 2020 & 2033
- Table 27: Argentina Seaweed Products Revenue (billion) Forecast, by Application 2020 & 2033
- Table 28: Argentina Seaweed Products Volume (K) Forecast, by Application 2020 & 2033
- Table 29: Rest of South America Seaweed Products Revenue (billion) Forecast, by Application 2020 & 2033
- Table 30: Rest of South America Seaweed Products Volume (K) Forecast, by Application 2020 & 2033
- Table 31: Global Seaweed Products Revenue billion Forecast, by Application 2020 & 2033
- Table 32: Global Seaweed Products Volume K Forecast, by Application 2020 & 2033
- Table 33: Global Seaweed Products Revenue billion Forecast, by Types 2020 & 2033
- Table 34: Global Seaweed Products Volume K Forecast, by Types 2020 & 2033
- Table 35: Global Seaweed Products Revenue billion Forecast, by Country 2020 & 2033
- Table 36: Global Seaweed Products Volume K Forecast, by Country 2020 & 2033
- Table 37: United Kingdom Seaweed Products Revenue (billion) Forecast, by Application 2020 & 2033
- Table 38: United Kingdom Seaweed Products Volume (K) Forecast, by Application 2020 & 2033
- Table 39: Germany Seaweed Products Revenue (billion) Forecast, by Application 2020 & 2033
- Table 40: Germany Seaweed Products Volume (K) Forecast, by Application 2020 & 2033
- Table 41: France Seaweed Products Revenue (billion) Forecast, by Application 2020 & 2033
- Table 42: France Seaweed Products Volume (K) Forecast, by Application 2020 & 2033
- Table 43: Italy Seaweed Products Revenue (billion) Forecast, by Application 2020 & 2033
- Table 44: Italy Seaweed Products Volume (K) Forecast, by Application 2020 & 2033
- Table 45: Spain Seaweed Products Revenue (billion) Forecast, by Application 2020 & 2033
- Table 46: Spain Seaweed Products Volume (K) Forecast, by Application 2020 & 2033
- Table 47: Russia Seaweed Products Revenue (billion) Forecast, by Application 2020 & 2033
- Table 48: Russia Seaweed Products Volume (K) Forecast, by Application 2020 & 2033
- Table 49: Benelux Seaweed Products Revenue (billion) Forecast, by Application 2020 & 2033
- Table 50: Benelux Seaweed Products Volume (K) Forecast, by Application 2020 & 2033
- Table 51: Nordics Seaweed Products Revenue (billion) Forecast, by Application 2020 & 2033
- Table 52: Nordics Seaweed Products Volume (K) Forecast, by Application 2020 & 2033
- Table 53: Rest of Europe Seaweed Products Revenue (billion) Forecast, by Application 2020 & 2033
- Table 54: Rest of Europe Seaweed Products Volume (K) Forecast, by Application 2020 & 2033
- Table 55: Global Seaweed Products Revenue billion Forecast, by Application 2020 & 2033
- Table 56: Global Seaweed Products Volume K Forecast, by Application 2020 & 2033
- Table 57: Global Seaweed Products Revenue billion Forecast, by Types 2020 & 2033
- Table 58: Global Seaweed Products Volume K Forecast, by Types 2020 & 2033
- Table 59: Global Seaweed Products Revenue billion Forecast, by Country 2020 & 2033
- Table 60: Global Seaweed Products Volume K Forecast, by Country 2020 & 2033
- Table 61: Turkey Seaweed Products Revenue (billion) Forecast, by Application 2020 & 2033
- Table 62: Turkey Seaweed Products Volume (K) Forecast, by Application 2020 & 2033
- Table 63: Israel Seaweed Products Revenue (billion) Forecast, by Application 2020 & 2033
- Table 64: Israel Seaweed Products Volume (K) Forecast, by Application 2020 & 2033
- Table 65: GCC Seaweed Products Revenue (billion) Forecast, by Application 2020 & 2033
- Table 66: GCC Seaweed Products Volume (K) Forecast, by Application 2020 & 2033
- Table 67: North Africa Seaweed Products Revenue (billion) Forecast, by Application 2020 & 2033
- Table 68: North Africa Seaweed Products Volume (K) Forecast, by Application 2020 & 2033
- Table 69: South Africa Seaweed Products Revenue (billion) Forecast, by Application 2020 & 2033
- Table 70: South Africa Seaweed Products Volume (K) Forecast, by Application 2020 & 2033
- Table 71: Rest of Middle East & Africa Seaweed Products Revenue (billion) Forecast, by Application 2020 & 2033
- Table 72: Rest of Middle East & Africa Seaweed Products Volume (K) Forecast, by Application 2020 & 2033
- Table 73: Global Seaweed Products Revenue billion Forecast, by Application 2020 & 2033
- Table 74: Global Seaweed Products Volume K Forecast, by Application 2020 & 2033
- Table 75: Global Seaweed Products Revenue billion Forecast, by Types 2020 & 2033
- Table 76: Global Seaweed Products Volume K Forecast, by Types 2020 & 2033
- Table 77: Global Seaweed Products Revenue billion Forecast, by Country 2020 & 2033
- Table 78: Global Seaweed Products Volume K Forecast, by Country 2020 & 2033
- Table 79: China Seaweed Products Revenue (billion) Forecast, by Application 2020 & 2033
- Table 80: China Seaweed Products Volume (K) Forecast, by Application 2020 & 2033
- Table 81: India Seaweed Products Revenue (billion) Forecast, by Application 2020 & 2033
- Table 82: India Seaweed Products Volume (K) Forecast, by Application 2020 & 2033
- Table 83: Japan Seaweed Products Revenue (billion) Forecast, by Application 2020 & 2033
- Table 84: Japan Seaweed Products Volume (K) Forecast, by Application 2020 & 2033
- Table 85: South Korea Seaweed Products Revenue (billion) Forecast, by Application 2020 & 2033
- Table 86: South Korea Seaweed Products Volume (K) Forecast, by Application 2020 & 2033
- Table 87: ASEAN Seaweed Products Revenue (billion) Forecast, by Application 2020 & 2033
- Table 88: ASEAN Seaweed Products Volume (K) Forecast, by Application 2020 & 2033
- Table 89: Oceania Seaweed Products Revenue (billion) Forecast, by Application 2020 & 2033
- Table 90: Oceania Seaweed Products Volume (K) Forecast, by Application 2020 & 2033
- Table 91: Rest of Asia Pacific Seaweed Products Revenue (billion) Forecast, by Application 2020 & 2033
- Table 92: Rest of Asia Pacific Seaweed Products Volume (K) Forecast, by Application 2020 & 2033
Frequently Asked Questions
1. What is the projected Compound Annual Growth Rate (CAGR) of the Seaweed Products?
The projected CAGR is approximately 13.6%.
2. Which companies are prominent players in the Seaweed Products?
Key companies in the market include Seakura, Kelpak, Seagate Products, Cargill, Irish Seaweeds, AlgAran, Dakini Tidal Wilds, Wild Irish Sea Veg, Weihai Shidai Marine Biotechnology, Shandong Lidao Oceanic Technology, Fujian Lianjiang Tianyuan Aquatic, Xunshan Group, Qingdao Gather Great Ocean Algae, Fujian Yiyuan Sea Food Company, Fujian Huangqiwan Sea Food Biotechnology, Rongcheng Lidao Chenfenzhuang Hongqiang Kelp Factory, Rongcheng Lidao Chenfenzhuang Weijian Kelp Factory, Rongcheng Yandunjiao Aquatic Company, Shandong Gaolv Aquatic Company, Shandong Haizhibao Technology, Matsumaeya.
3. What are the main segments of the Seaweed Products?
The market segments include Application, Types.
4. Can you provide details about the market size?
The market size is estimated to be USD 1.41 billion as of 2022.
5. What are some drivers contributing to market growth?
N/A
6. What are the notable trends driving market growth?
N/A
7. Are there any restraints impacting market growth?
N/A
8. Can you provide examples of recent developments in the market?
N/A
9. What pricing options are available for accessing the report?
Pricing options include single-user, multi-user, and enterprise licenses priced at USD 3350.00, USD 5025.00, and USD 6700.00 respectively.
10. Is the market size provided in terms of value or volume?
The market size is provided in terms of value, measured in billion and volume, measured in K.
11. Are there any specific market keywords associated with the report?
Yes, the market keyword associated with the report is "Seaweed Products," which aids in identifying and referencing the specific market segment covered.
12. How do I determine which pricing option suits my needs best?
The pricing options vary based on user requirements and access needs. Individual users may opt for single-user licenses, while businesses requiring broader access may choose multi-user or enterprise licenses for cost-effective access to the report.
13. Are there any additional resources or data provided in the Seaweed Products report?
While the report offers comprehensive insights, it's advisable to review the specific contents or supplementary materials provided to ascertain if additional resources or data are available.
14. How can I stay updated on further developments or reports in the Seaweed Products?
To stay informed about further developments, trends, and reports in the Seaweed Products, consider subscribing to industry newsletters, following relevant companies and organizations, or regularly checking reputable industry news sources and publications.
Methodology
Step 1 - Identification of Relevant Samples Size from Population Database


Step 2 - Approaches for Defining Global Market Size (Value, Volume* & Price*)

Note*: In applicable scenarios
Step 3 - Data Sources
Primary Research
- Web Analytics
- Survey Reports
- Research Institute
- Latest Research Reports
- Opinion Leaders
Secondary Research
- Annual Reports
- White Paper
- Latest Press Release
- Industry Association
- Paid Database
- Investor Presentations

Step 4 - Data Triangulation
Involves using different sources of information in order to increase the validity of a study
These sources are likely to be stakeholders in a program - participants, other researchers, program staff, other community members, and so on.
Then we put all data in single framework & apply various statistical tools to find out the dynamic on the market.
During the analysis stage, feedback from the stakeholder groups would be compared to determine areas of agreement as well as areas of divergence

