
Key Insights
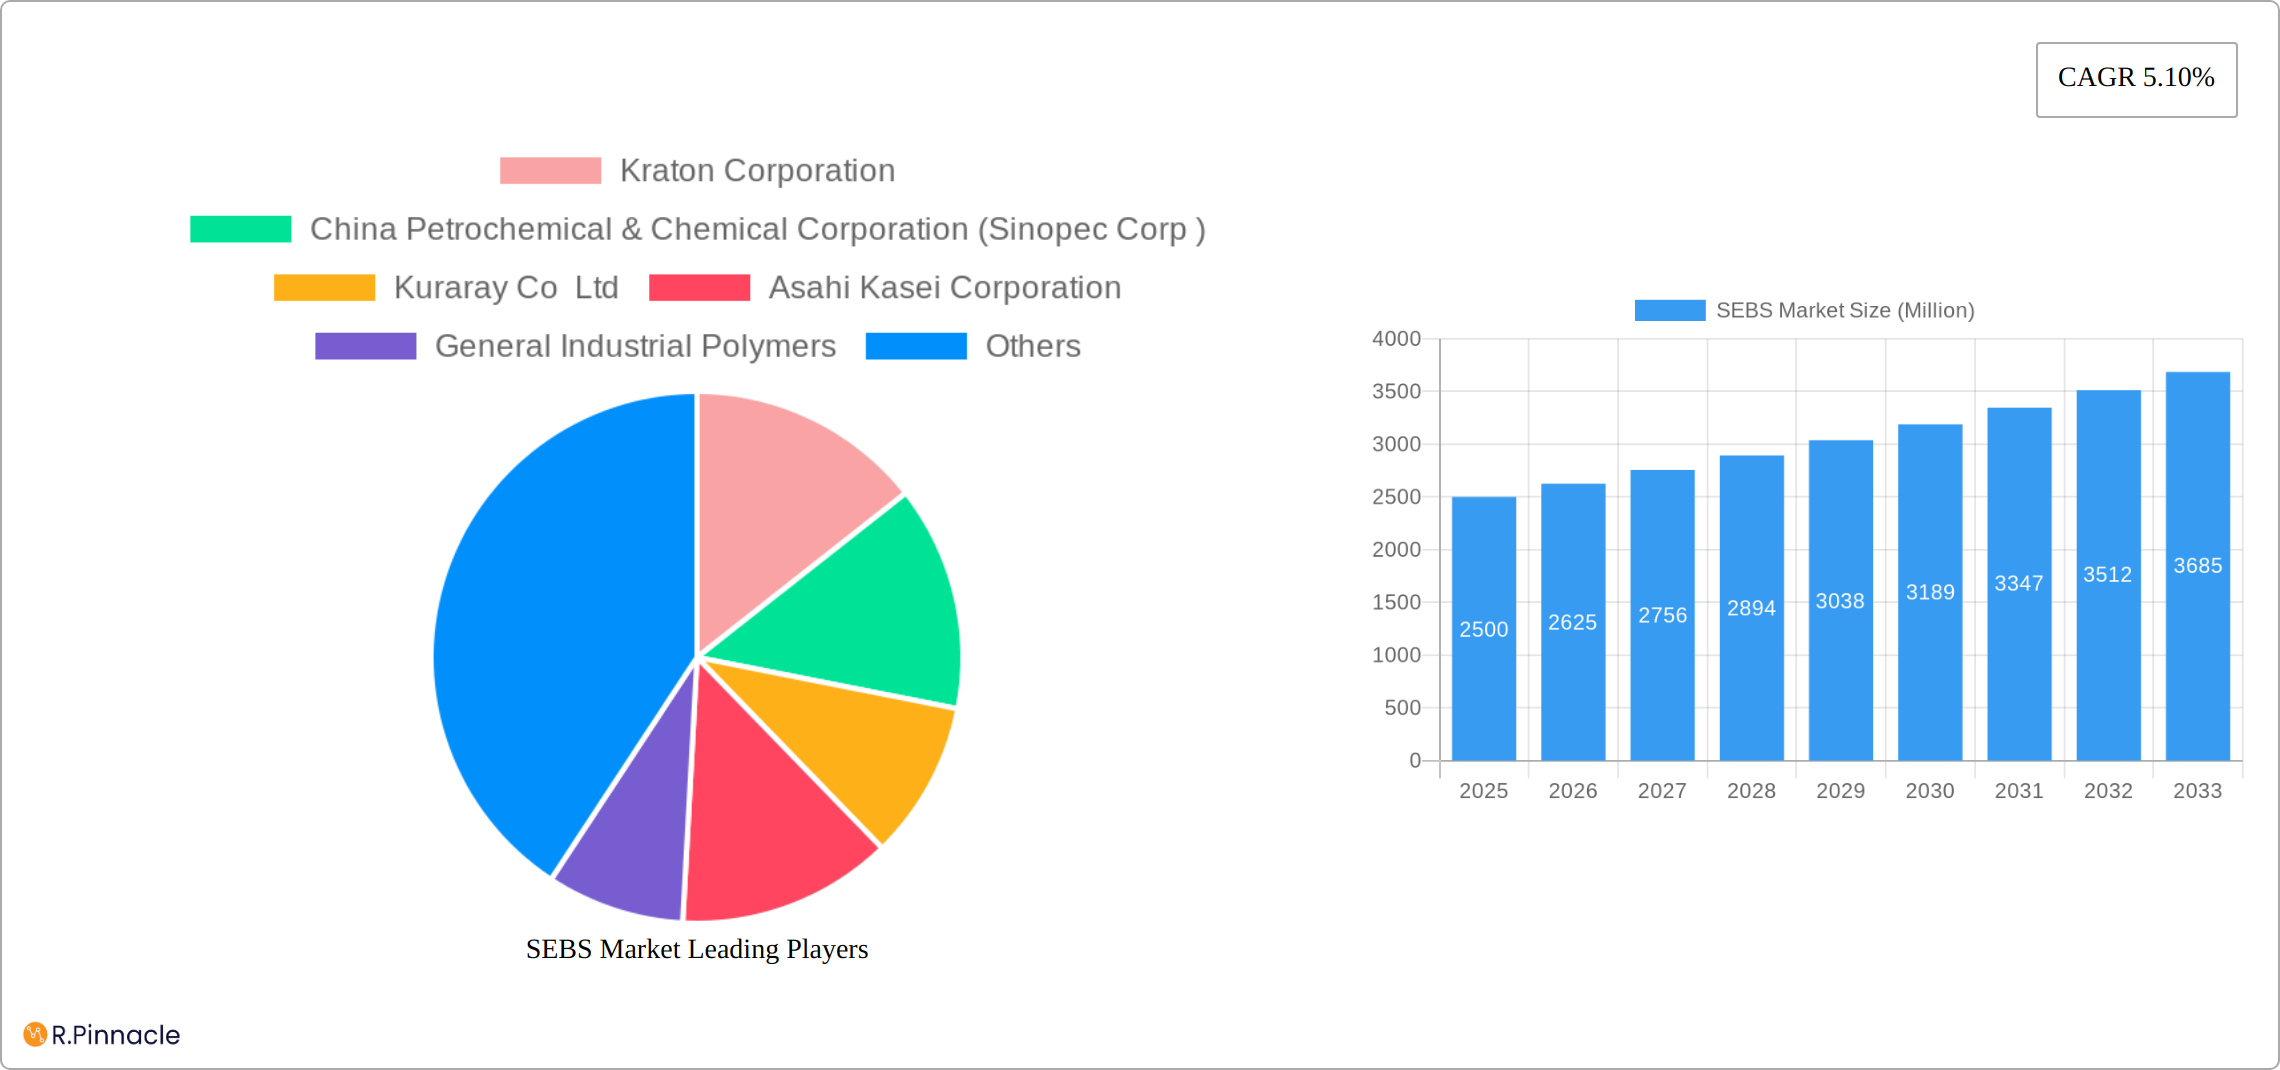
The global styrene-ethylene-butylene-styrene (SEBS) market is experiencing robust growth, projected to reach a substantial size by 2033. A compound annual growth rate (CAGR) of 5.10% from 2019 to 2024 indicates a steadily expanding market driven by increasing demand across diverse end-use industries. The footwear industry, a major consumer of SEBS, is fueling this growth due to the material's flexibility, durability, and superior performance characteristics in shoe soles and other components. Furthermore, the rise of the adhesives and sealants sector, coupled with expanding applications in the automotive and plastics industries, contributes significantly to the overall market expansion. Technological advancements leading to improved SEBS grades with enhanced properties like higher tensile strength and impact resistance are also key drivers. However, price volatility of raw materials and potential environmental concerns related to plastic waste generation pose certain restraints on market expansion. The market is segmented by form (pellets and powder) and end-user industry, with the Asia-Pacific region, particularly China and India, showing significant growth potential due to increasing industrialization and infrastructure development. Competitive dynamics are shaped by major players such as Kraton Corporation, Sinopec Corp, and Kuraray Co Ltd, among others, who are continuously innovating and expanding their product portfolios to meet the evolving market demands.
The market’s segmentation by form and end-use further reveals distinct growth trajectories. The pellet form currently dominates due to ease of processing and handling, while powder forms are gaining traction in specific niche applications. Among end-user industries, automotive and footwear consistently demonstrate high demand, driven by increasing vehicle production and footwear consumption. Growth in emerging applications such as 3D printing and medical devices is promising, while the plastics industry, a long-standing consumer of SEBS, is expected to maintain consistent demand. Regional analysis highlights the Asia-Pacific region as the dominant market, driven by robust economic growth and manufacturing activities. North America and Europe follow, showcasing mature markets with steady growth potential based on continued innovation and technological advancements in the SEBS manufacturing process. The South American and Middle East and Africa regions are projected to experience moderate growth, driven by increased industrialization and infrastructure development.
SEBS Market: A Comprehensive Report (2019-2033)
This in-depth report provides a comprehensive analysis of the global SEBS market, offering invaluable insights for industry professionals, investors, and strategic decision-makers. With a detailed examination of market dynamics, key players, and future trends, this report covers the period from 2019 to 2033, with a focus on the forecast period of 2025-2033 and a base year of 2025. The report projects a xx Million market value by 2033, showcasing significant growth potential.
SEBS Market Structure & Innovation Trends
The SEBS market exhibits a moderately consolidated structure, with key players like Kraton Corporation, Sinopec Corp, and Kuraray Co Ltd holding significant market share. The exact market share for each company is unavailable for this report; however, estimates place Kraton Corporation at approximately xx% and Sinopec Corp at around xx% in 2025. Innovation within the SEBS market is driven by the increasing demand for high-performance materials across various end-use industries, including automotive, medical, and 3D printing. Regulatory frameworks concerning material safety and environmental impact significantly influence market dynamics. Product substitutes, such as thermoplastic elastomers (TPEs), pose a competitive challenge, while advancements in material science continue to drive innovation.
- Market Concentration: Moderately consolidated, with several major players dominating.
- Innovation Drivers: Demand for high-performance materials, advancements in material science, and stringent regulatory frameworks.
- Regulatory Landscape: Stringent safety and environmental regulations impacting material development and production.
- Product Substitutes: Competition from TPEs and other elastomers.
- M&A Activity: Significant M&A activity observed in recent years, with deal values in the range of xx Million. Examples include the Kraton-DL Chemical merger.

SEBS Market Dynamics & Trends
The global SEBS market is poised for substantial growth, driven by increasing demand from diverse end-use sectors. The automotive industry, particularly in electric vehicle (EV) manufacturing, requires high-performance, lightweight materials, bolstering SEBS demand. The medical and 3D printing industries are also emerging as significant growth drivers, seeking biocompatible and customizable SEBS materials. Technological advancements in material synthesis and processing technologies contribute to improved material properties and broader applications, influencing consumer preferences for higher-quality and specialized products. Competitive dynamics are characterized by technological innovation and strategic partnerships, including acquisitions, that lead to the evolution of market shares. The CAGR for the forecast period is projected to be xx%, with market penetration significantly increasing across various sectors.
Dominant Regions & Segments in SEBS Market
The Asia-Pacific region is poised to maintain its dominance in the global SEBS market throughout the forecast period, driven by robust demand from key industries such as automotive, footwear, and electronics. Within this region, China and Japan are significant contributors to market growth, reflecting their substantial manufacturing capacities and technological advancements.
Key Drivers of Asia-Pacific Market Leadership:
- Rapid Industrialization and Economic Growth: The region's robust industrial expansion, particularly in sectors like automotive and electronics, fuels the high demand for SEBS. This is further amplified by supportive government policies promoting manufacturing and technological innovation.
- Expanding Infrastructure Development: Significant investments in infrastructure projects across the Asia-Pacific region create a substantial demand for high-performance construction materials incorporating SEBS.
- Increasing Consumer Spending: Rising disposable incomes are driving demand for consumer goods incorporating SEBS, particularly in footwear and electronics.
Dominant Market Segments:
- Form: Pellets currently dominate the SEBS market, owing to their ease of processing and handling in various manufacturing processes. However, the powder segment is exhibiting strong growth potential, particularly in niche applications requiring specific material properties.
- End-User Industry: The automotive and footwear industries remain the largest consumers of SEBS, reflecting its versatility and desirable material properties. Significant growth is also observed in the adhesives and sealants, electronics, and medical sectors. The expanding medical device and implant market is a key driver of the increased demand for biocompatible and high-performance SEBS materials.
SEBS Market Product Innovations
Recent product innovations in the SEBS market focus on enhanced material properties such as improved durability, flexibility, and biocompatibility. These innovations cater to the demands of various end-use industries, particularly in automotive, medical, and 3D printing. Companies are investing in research and development to create sustainable and eco-friendly SEBS materials, aligning with global environmental regulations and consumer preferences.
Report Scope & Segmentation Analysis
This report segments the SEBS market by form (pellets, powder) and end-user industry (footwear, adhesives and sealants, plastics, roads and railways, automotive, sporting and toys, electrical and electronics, other end-user industries). Each segment's growth projections, market size, and competitive dynamics are analyzed in detail. The pellets segment is projected to maintain a higher growth rate in the forecast period. The automotive industry is the leading end-user sector.
Key Drivers of SEBS Market Growth
The SEBS market is experiencing robust growth, fueled by several key drivers. The rising demand for lightweight yet durable materials in the automotive industry, particularly for EVs, is a significant factor. The expanding medical and 3D printing sectors are also creating substantial demand for specialized SEBS materials. Government regulations promoting sustainable materials and improved infrastructure projects further stimulate market expansion.
Challenges in the SEBS Market Sector
The SEBS market faces challenges, including fluctuating raw material prices, impacting production costs and profitability. Supply chain disruptions and intense competition from substitute materials pose significant challenges. Stringent environmental regulations necessitate investments in sustainable production methods, adding to operational costs. The overall impact of these challenges on market growth is estimated to be a xx% reduction in overall CAGR during the forecast period.
Emerging Opportunities in SEBS Market
The SEBS market presents numerous emerging opportunities, including the growing demand for biocompatible and biodegradable SEBS materials in the medical and packaging industries. The expansion of the 3D printing industry creates potential for customized SEBS applications. Furthermore, the increasing focus on sustainable materials and circular economy principles will drive the development of eco-friendly SEBS products.
Leading Players in the SEBS Market Market
- Kraton Corporation
- China Petrochemical & Chemical Corporation (Sinopec Corp)
- Kuraray Co Ltd
- Asahi Kasei Corporation
- General Industrial Polymers
- Dynasol Group
- Celanese Corporation
- Ningbo Changhong Polymer Scientific and Technical Inc
- ENEOS Corporation
- Trinseo
- RTP Company
- versalis SpA
- Ravago
- LCY GROUP
- TSRC
Key Developments in SEBS Market Industry
- March 2022: KRATON CORPORATION announced its acquisition by DL Chemical Co. Ltd, strengthening its global presence and investment in sustainable innovation.
- April 2022: ENEOS Corporation acquired JSR's elastomers business, expanding its high-performance materials portfolio and technological capabilities.
- August 2022: Kraton announced a 30% increase in styrene block copolymer production capacity at its Taiwan facility.
Future Outlook for SEBS Market Market
The future of the SEBS market looks promising, driven by continuous technological advancements and increasing demand from various end-use industries. Strategic investments in R&D, focused on sustainability and material performance, will be crucial for market success. The market is expected to experience sustained growth, driven by the expansion of end-use applications and ongoing innovations in material science.
SEBS Market Segmentation
-
1. Form
- 1.1. Pellets
- 1.2. Powder
-
2. End-User Industry
- 2.1. Footwear
- 2.2. Adhesives and Sealants
- 2.3. Plastics
- 2.4. Roads and Railways
- 2.5. Automotive
- 2.6. Sporting and Toys
- 2.7. Electrical and Electronics
- 2.8. Other End-User Industry
SEBS Market Segmentation By Geography
-
1. Asia Pacific
- 1.1. China
- 1.2. India
- 1.3. Japan
- 1.4. South Korea
- 1.5. Malaysia
- 1.6. Thailand
- 1.7. Indonesia
- 1.8. Vietnam
- 1.9. Rest of Asia Pacific
-
2. North America
- 2.1. United States
- 2.2. Canada
- 2.3. Mexico
-
3. Europe
- 3.1. Germany
- 3.2. United Kingdom
- 3.3. France
- 3.4. Italy
- 3.5. Spain
- 3.6. NORDIC countries
- 3.7. Turkey
- 3.8. Russia
- 3.9. Rest of Europe
-
4. South America
- 4.1. Brazil
- 4.2. Argentina
- 4.3. Colombia
- 4.4. Rest of South America
-
5. Middle East and Africa
- 5.1. Saudi Arabia
- 5.2. Qatar
- 5.3. United Arab Emirates
- 5.4. Nigeria
- 5.5. Egypt
- 5.6. South Africa
- 5.7. Rest of Middle East and Africa

SEBS Market REPORT HIGHLIGHTS
| Aspects | Details |
|---|---|
| Study Period | 2019-2033 |
| Base Year | 2024 |
| Estimated Year | 2025 |
| Forecast Period | 2025-2033 |
| Historical Period | 2019-2024 |
| Growth Rate | CAGR of 5.10% from 2019-2033 |
| Segmentation |
|
Table of Contents
- 1. Introduction
- 1.1. Research Scope
- 1.2. Market Segmentation
- 1.3. Research Methodology
- 1.4. Definitions and Assumptions
- 2. Executive Summary
- 2.1. Introduction
- 3. Market Dynamics
- 3.1. Introduction
- 3.2. Market Drivers
- 3.2.1. Increasing Investments in the Adhesives Industry; Growing Demand From the Automotive Industry; Other Drivers
- 3.3. Market Restrains
- 3.3.1. Hazardous Nature and Regulations of Styrene; Other Restraints
- 3.4. Market Trends
- 3.4.1. The Automotive Industry is Expected to Dominate the Market
- 4. Market Factor Analysis
- 4.1. Porters Five Forces
- 4.2. Supply/Value Chain
- 4.3. PESTEL analysis
- 4.4. Market Entropy
- 4.5. Patent/Trademark Analysis
- 5. Global SEBS Market Analysis, Insights and Forecast, 2019-2031
- 5.1. Market Analysis, Insights and Forecast - by Form
- 5.1.1. Pellets
- 5.1.2. Powder
- 5.2. Market Analysis, Insights and Forecast - by End-User Industry
- 5.2.1. Footwear
- 5.2.2. Adhesives and Sealants
- 5.2.3. Plastics
- 5.2.4. Roads and Railways
- 5.2.5. Automotive
- 5.2.6. Sporting and Toys
- 5.2.7. Electrical and Electronics
- 5.2.8. Other End-User Industry
- 5.3. Market Analysis, Insights and Forecast - by Region
- 5.3.1. Asia Pacific
- 5.3.2. North America
- 5.3.3. Europe
- 5.3.4. South America
- 5.3.5. Middle East and Africa
- 5.1. Market Analysis, Insights and Forecast - by Form
- 6. Asia Pacific SEBS Market Analysis, Insights and Forecast, 2019-2031
- 6.1. Market Analysis, Insights and Forecast - by Form
- 6.1.1. Pellets
- 6.1.2. Powder
- 6.2. Market Analysis, Insights and Forecast - by End-User Industry
- 6.2.1. Footwear
- 6.2.2. Adhesives and Sealants
- 6.2.3. Plastics
- 6.2.4. Roads and Railways
- 6.2.5. Automotive
- 6.2.6. Sporting and Toys
- 6.2.7. Electrical and Electronics
- 6.2.8. Other End-User Industry
- 6.1. Market Analysis, Insights and Forecast - by Form
- 7. North America SEBS Market Analysis, Insights and Forecast, 2019-2031
- 7.1. Market Analysis, Insights and Forecast - by Form
- 7.1.1. Pellets
- 7.1.2. Powder
- 7.2. Market Analysis, Insights and Forecast - by End-User Industry
- 7.2.1. Footwear
- 7.2.2. Adhesives and Sealants
- 7.2.3. Plastics
- 7.2.4. Roads and Railways
- 7.2.5. Automotive
- 7.2.6. Sporting and Toys
- 7.2.7. Electrical and Electronics
- 7.2.8. Other End-User Industry
- 7.1. Market Analysis, Insights and Forecast - by Form
- 8. Europe SEBS Market Analysis, Insights and Forecast, 2019-2031
- 8.1. Market Analysis, Insights and Forecast - by Form
- 8.1.1. Pellets
- 8.1.2. Powder
- 8.2. Market Analysis, Insights and Forecast - by End-User Industry
- 8.2.1. Footwear
- 8.2.2. Adhesives and Sealants
- 8.2.3. Plastics
- 8.2.4. Roads and Railways
- 8.2.5. Automotive
- 8.2.6. Sporting and Toys
- 8.2.7. Electrical and Electronics
- 8.2.8. Other End-User Industry
- 8.1. Market Analysis, Insights and Forecast - by Form
- 9. South America SEBS Market Analysis, Insights and Forecast, 2019-2031
- 9.1. Market Analysis, Insights and Forecast - by Form
- 9.1.1. Pellets
- 9.1.2. Powder
- 9.2. Market Analysis, Insights and Forecast - by End-User Industry
- 9.2.1. Footwear
- 9.2.2. Adhesives and Sealants
- 9.2.3. Plastics
- 9.2.4. Roads and Railways
- 9.2.5. Automotive
- 9.2.6. Sporting and Toys
- 9.2.7. Electrical and Electronics
- 9.2.8. Other End-User Industry
- 9.1. Market Analysis, Insights and Forecast - by Form
- 10. Middle East and Africa SEBS Market Analysis, Insights and Forecast, 2019-2031
- 10.1. Market Analysis, Insights and Forecast - by Form
- 10.1.1. Pellets
- 10.1.2. Powder
- 10.2. Market Analysis, Insights and Forecast - by End-User Industry
- 10.2.1. Footwear
- 10.2.2. Adhesives and Sealants
- 10.2.3. Plastics
- 10.2.4. Roads and Railways
- 10.2.5. Automotive
- 10.2.6. Sporting and Toys
- 10.2.7. Electrical and Electronics
- 10.2.8. Other End-User Industry
- 10.1. Market Analysis, Insights and Forecast - by Form
- 11. Asia Pacific SEBS Market Analysis, Insights and Forecast, 2019-2031
- 11.1. Market Analysis, Insights and Forecast - By Country/Sub-region
- 11.1.1 China
- 11.1.2 India
- 11.1.3 Japan
- 11.1.4 South Korea
- 11.1.5 Rest of Asia Pacific
- 12. North America SEBS Market Analysis, Insights and Forecast, 2019-2031
- 12.1. Market Analysis, Insights and Forecast - By Country/Sub-region
- 12.1.1 United States
- 12.1.2 Canada
- 12.1.3 Mexico
- 13. Europe SEBS Market Analysis, Insights and Forecast, 2019-2031
- 13.1. Market Analysis, Insights and Forecast - By Country/Sub-region
- 13.1.1 Germany
- 13.1.2 United Kingdom
- 13.1.3 France
- 13.1.4 Italy
- 13.1.5 Rest of Europe
- 14. South America SEBS Market Analysis, Insights and Forecast, 2019-2031
- 14.1. Market Analysis, Insights and Forecast - By Country/Sub-region
- 14.1.1 Brazil
- 14.1.2 Argentina
- 14.1.3 Rest of South America
- 15. Middle East and Africa SEBS Market Analysis, Insights and Forecast, 2019-2031
- 15.1. Market Analysis, Insights and Forecast - By Country/Sub-region
- 15.1.1 Saudi Arabia
- 15.1.2 South Africa
- 15.1.3 Rest of Middle East and Africa
- 16. Competitive Analysis
- 16.1. Global Market Share Analysis 2024
- 16.2. Company Profiles
- 16.2.1 Kraton Corporation
- 16.2.1.1. Overview
- 16.2.1.2. Products
- 16.2.1.3. SWOT Analysis
- 16.2.1.4. Recent Developments
- 16.2.1.5. Financials (Based on Availability)
- 16.2.2 China Petrochemical & Chemical Corporation (Sinopec Corp )
- 16.2.2.1. Overview
- 16.2.2.2. Products
- 16.2.2.3. SWOT Analysis
- 16.2.2.4. Recent Developments
- 16.2.2.5. Financials (Based on Availability)
- 16.2.3 Kuraray Co Ltd
- 16.2.3.1. Overview
- 16.2.3.2. Products
- 16.2.3.3. SWOT Analysis
- 16.2.3.4. Recent Developments
- 16.2.3.5. Financials (Based on Availability)
- 16.2.4 Asahi Kasei Corporation
- 16.2.4.1. Overview
- 16.2.4.2. Products
- 16.2.4.3. SWOT Analysis
- 16.2.4.4. Recent Developments
- 16.2.4.5. Financials (Based on Availability)
- 16.2.5 General Industrial Polymers
- 16.2.5.1. Overview
- 16.2.5.2. Products
- 16.2.5.3. SWOT Analysis
- 16.2.5.4. Recent Developments
- 16.2.5.5. Financials (Based on Availability)
- 16.2.6 Dynasol Group
- 16.2.6.1. Overview
- 16.2.6.2. Products
- 16.2.6.3. SWOT Analysis
- 16.2.6.4. Recent Developments
- 16.2.6.5. Financials (Based on Availability)
- 16.2.7 Celanese Corporation
- 16.2.7.1. Overview
- 16.2.7.2. Products
- 16.2.7.3. SWOT Analysis
- 16.2.7.4. Recent Developments
- 16.2.7.5. Financials (Based on Availability)
- 16.2.8 Ningbo Changhong Polymer Scientific and Technical Inc
- 16.2.8.1. Overview
- 16.2.8.2. Products
- 16.2.8.3. SWOT Analysis
- 16.2.8.4. Recent Developments
- 16.2.8.5. Financials (Based on Availability)
- 16.2.9 ENEOS Corporation
- 16.2.9.1. Overview
- 16.2.9.2. Products
- 16.2.9.3. SWOT Analysis
- 16.2.9.4. Recent Developments
- 16.2.9.5. Financials (Based on Availability)
- 16.2.10 Trinseo
- 16.2.10.1. Overview
- 16.2.10.2. Products
- 16.2.10.3. SWOT Analysis
- 16.2.10.4. Recent Developments
- 16.2.10.5. Financials (Based on Availability)
- 16.2.11 RTP Company
- 16.2.11.1. Overview
- 16.2.11.2. Products
- 16.2.11.3. SWOT Analysis
- 16.2.11.4. Recent Developments
- 16.2.11.5. Financials (Based on Availability)
- 16.2.12 versalis SpA
- 16.2.12.1. Overview
- 16.2.12.2. Products
- 16.2.12.3. SWOT Analysis
- 16.2.12.4. Recent Developments
- 16.2.12.5. Financials (Based on Availability)
- 16.2.13 Ravago
- 16.2.13.1. Overview
- 16.2.13.2. Products
- 16.2.13.3. SWOT Analysis
- 16.2.13.4. Recent Developments
- 16.2.13.5. Financials (Based on Availability)
- 16.2.14 LCY GROUP
- 16.2.14.1. Overview
- 16.2.14.2. Products
- 16.2.14.3. SWOT Analysis
- 16.2.14.4. Recent Developments
- 16.2.14.5. Financials (Based on Availability)
- 16.2.15 TSRC
- 16.2.15.1. Overview
- 16.2.15.2. Products
- 16.2.15.3. SWOT Analysis
- 16.2.15.4. Recent Developments
- 16.2.15.5. Financials (Based on Availability)
- 16.2.1 Kraton Corporation
List of Figures
- Figure 1: Global SEBS Market Revenue Breakdown (Million, %) by Region 2024 & 2032
- Figure 2: Global SEBS Market Volume Breakdown (kilotons, %) by Region 2024 & 2032
- Figure 3: Asia Pacific SEBS Market Revenue (Million), by Country 2024 & 2032
- Figure 4: Asia Pacific SEBS Market Volume (kilotons), by Country 2024 & 2032
- Figure 5: Asia Pacific SEBS Market Revenue Share (%), by Country 2024 & 2032
- Figure 6: Asia Pacific SEBS Market Volume Share (%), by Country 2024 & 2032
- Figure 7: North America SEBS Market Revenue (Million), by Country 2024 & 2032
- Figure 8: North America SEBS Market Volume (kilotons), by Country 2024 & 2032
- Figure 9: North America SEBS Market Revenue Share (%), by Country 2024 & 2032
- Figure 10: North America SEBS Market Volume Share (%), by Country 2024 & 2032
- Figure 11: Europe SEBS Market Revenue (Million), by Country 2024 & 2032
- Figure 12: Europe SEBS Market Volume (kilotons), by Country 2024 & 2032
- Figure 13: Europe SEBS Market Revenue Share (%), by Country 2024 & 2032
- Figure 14: Europe SEBS Market Volume Share (%), by Country 2024 & 2032
- Figure 15: South America SEBS Market Revenue (Million), by Country 2024 & 2032
- Figure 16: South America SEBS Market Volume (kilotons), by Country 2024 & 2032
- Figure 17: South America SEBS Market Revenue Share (%), by Country 2024 & 2032
- Figure 18: South America SEBS Market Volume Share (%), by Country 2024 & 2032
- Figure 19: Middle East and Africa SEBS Market Revenue (Million), by Country 2024 & 2032
- Figure 20: Middle East and Africa SEBS Market Volume (kilotons), by Country 2024 & 2032
- Figure 21: Middle East and Africa SEBS Market Revenue Share (%), by Country 2024 & 2032
- Figure 22: Middle East and Africa SEBS Market Volume Share (%), by Country 2024 & 2032
- Figure 23: Asia Pacific SEBS Market Revenue (Million), by Form 2024 & 2032
- Figure 24: Asia Pacific SEBS Market Volume (kilotons), by Form 2024 & 2032
- Figure 25: Asia Pacific SEBS Market Revenue Share (%), by Form 2024 & 2032
- Figure 26: Asia Pacific SEBS Market Volume Share (%), by Form 2024 & 2032
- Figure 27: Asia Pacific SEBS Market Revenue (Million), by End-User Industry 2024 & 2032
- Figure 28: Asia Pacific SEBS Market Volume (kilotons), by End-User Industry 2024 & 2032
- Figure 29: Asia Pacific SEBS Market Revenue Share (%), by End-User Industry 2024 & 2032
- Figure 30: Asia Pacific SEBS Market Volume Share (%), by End-User Industry 2024 & 2032
- Figure 31: Asia Pacific SEBS Market Revenue (Million), by Country 2024 & 2032
- Figure 32: Asia Pacific SEBS Market Volume (kilotons), by Country 2024 & 2032
- Figure 33: Asia Pacific SEBS Market Revenue Share (%), by Country 2024 & 2032
- Figure 34: Asia Pacific SEBS Market Volume Share (%), by Country 2024 & 2032
- Figure 35: North America SEBS Market Revenue (Million), by Form 2024 & 2032
- Figure 36: North America SEBS Market Volume (kilotons), by Form 2024 & 2032
- Figure 37: North America SEBS Market Revenue Share (%), by Form 2024 & 2032
- Figure 38: North America SEBS Market Volume Share (%), by Form 2024 & 2032
- Figure 39: North America SEBS Market Revenue (Million), by End-User Industry 2024 & 2032
- Figure 40: North America SEBS Market Volume (kilotons), by End-User Industry 2024 & 2032
- Figure 41: North America SEBS Market Revenue Share (%), by End-User Industry 2024 & 2032
- Figure 42: North America SEBS Market Volume Share (%), by End-User Industry 2024 & 2032
- Figure 43: North America SEBS Market Revenue (Million), by Country 2024 & 2032
- Figure 44: North America SEBS Market Volume (kilotons), by Country 2024 & 2032
- Figure 45: North America SEBS Market Revenue Share (%), by Country 2024 & 2032
- Figure 46: North America SEBS Market Volume Share (%), by Country 2024 & 2032
- Figure 47: Europe SEBS Market Revenue (Million), by Form 2024 & 2032
- Figure 48: Europe SEBS Market Volume (kilotons), by Form 2024 & 2032
- Figure 49: Europe SEBS Market Revenue Share (%), by Form 2024 & 2032
- Figure 50: Europe SEBS Market Volume Share (%), by Form 2024 & 2032
- Figure 51: Europe SEBS Market Revenue (Million), by End-User Industry 2024 & 2032
- Figure 52: Europe SEBS Market Volume (kilotons), by End-User Industry 2024 & 2032
- Figure 53: Europe SEBS Market Revenue Share (%), by End-User Industry 2024 & 2032
- Figure 54: Europe SEBS Market Volume Share (%), by End-User Industry 2024 & 2032
- Figure 55: Europe SEBS Market Revenue (Million), by Country 2024 & 2032
- Figure 56: Europe SEBS Market Volume (kilotons), by Country 2024 & 2032
- Figure 57: Europe SEBS Market Revenue Share (%), by Country 2024 & 2032
- Figure 58: Europe SEBS Market Volume Share (%), by Country 2024 & 2032
- Figure 59: South America SEBS Market Revenue (Million), by Form 2024 & 2032
- Figure 60: South America SEBS Market Volume (kilotons), by Form 2024 & 2032
- Figure 61: South America SEBS Market Revenue Share (%), by Form 2024 & 2032
- Figure 62: South America SEBS Market Volume Share (%), by Form 2024 & 2032
- Figure 63: South America SEBS Market Revenue (Million), by End-User Industry 2024 & 2032
- Figure 64: South America SEBS Market Volume (kilotons), by End-User Industry 2024 & 2032
- Figure 65: South America SEBS Market Revenue Share (%), by End-User Industry 2024 & 2032
- Figure 66: South America SEBS Market Volume Share (%), by End-User Industry 2024 & 2032
- Figure 67: South America SEBS Market Revenue (Million), by Country 2024 & 2032
- Figure 68: South America SEBS Market Volume (kilotons), by Country 2024 & 2032
- Figure 69: South America SEBS Market Revenue Share (%), by Country 2024 & 2032
- Figure 70: South America SEBS Market Volume Share (%), by Country 2024 & 2032
- Figure 71: Middle East and Africa SEBS Market Revenue (Million), by Form 2024 & 2032
- Figure 72: Middle East and Africa SEBS Market Volume (kilotons), by Form 2024 & 2032
- Figure 73: Middle East and Africa SEBS Market Revenue Share (%), by Form 2024 & 2032
- Figure 74: Middle East and Africa SEBS Market Volume Share (%), by Form 2024 & 2032
- Figure 75: Middle East and Africa SEBS Market Revenue (Million), by End-User Industry 2024 & 2032
- Figure 76: Middle East and Africa SEBS Market Volume (kilotons), by End-User Industry 2024 & 2032
- Figure 77: Middle East and Africa SEBS Market Revenue Share (%), by End-User Industry 2024 & 2032
- Figure 78: Middle East and Africa SEBS Market Volume Share (%), by End-User Industry 2024 & 2032
- Figure 79: Middle East and Africa SEBS Market Revenue (Million), by Country 2024 & 2032
- Figure 80: Middle East and Africa SEBS Market Volume (kilotons), by Country 2024 & 2032
- Figure 81: Middle East and Africa SEBS Market Revenue Share (%), by Country 2024 & 2032
- Figure 82: Middle East and Africa SEBS Market Volume Share (%), by Country 2024 & 2032
List of Tables
- Table 1: Global SEBS Market Revenue Million Forecast, by Region 2019 & 2032
- Table 2: Global SEBS Market Volume kilotons Forecast, by Region 2019 & 2032
- Table 3: Global SEBS Market Revenue Million Forecast, by Form 2019 & 2032
- Table 4: Global SEBS Market Volume kilotons Forecast, by Form 2019 & 2032
- Table 5: Global SEBS Market Revenue Million Forecast, by End-User Industry 2019 & 2032
- Table 6: Global SEBS Market Volume kilotons Forecast, by End-User Industry 2019 & 2032
- Table 7: Global SEBS Market Revenue Million Forecast, by Region 2019 & 2032
- Table 8: Global SEBS Market Volume kilotons Forecast, by Region 2019 & 2032
- Table 9: Global SEBS Market Revenue Million Forecast, by Country 2019 & 2032
- Table 10: Global SEBS Market Volume kilotons Forecast, by Country 2019 & 2032
- Table 11: China SEBS Market Revenue (Million) Forecast, by Application 2019 & 2032
- Table 12: China SEBS Market Volume (kilotons) Forecast, by Application 2019 & 2032
- Table 13: India SEBS Market Revenue (Million) Forecast, by Application 2019 & 2032
- Table 14: India SEBS Market Volume (kilotons) Forecast, by Application 2019 & 2032
- Table 15: Japan SEBS Market Revenue (Million) Forecast, by Application 2019 & 2032
- Table 16: Japan SEBS Market Volume (kilotons) Forecast, by Application 2019 & 2032
- Table 17: South Korea SEBS Market Revenue (Million) Forecast, by Application 2019 & 2032
- Table 18: South Korea SEBS Market Volume (kilotons) Forecast, by Application 2019 & 2032
- Table 19: Rest of Asia Pacific SEBS Market Revenue (Million) Forecast, by Application 2019 & 2032
- Table 20: Rest of Asia Pacific SEBS Market Volume (kilotons) Forecast, by Application 2019 & 2032
- Table 21: Global SEBS Market Revenue Million Forecast, by Country 2019 & 2032
- Table 22: Global SEBS Market Volume kilotons Forecast, by Country 2019 & 2032
- Table 23: United States SEBS Market Revenue (Million) Forecast, by Application 2019 & 2032
- Table 24: United States SEBS Market Volume (kilotons) Forecast, by Application 2019 & 2032
- Table 25: Canada SEBS Market Revenue (Million) Forecast, by Application 2019 & 2032
- Table 26: Canada SEBS Market Volume (kilotons) Forecast, by Application 2019 & 2032
- Table 27: Mexico SEBS Market Revenue (Million) Forecast, by Application 2019 & 2032
- Table 28: Mexico SEBS Market Volume (kilotons) Forecast, by Application 2019 & 2032
- Table 29: Global SEBS Market Revenue Million Forecast, by Country 2019 & 2032
- Table 30: Global SEBS Market Volume kilotons Forecast, by Country 2019 & 2032
- Table 31: Germany SEBS Market Revenue (Million) Forecast, by Application 2019 & 2032
- Table 32: Germany SEBS Market Volume (kilotons) Forecast, by Application 2019 & 2032
- Table 33: United Kingdom SEBS Market Revenue (Million) Forecast, by Application 2019 & 2032
- Table 34: United Kingdom SEBS Market Volume (kilotons) Forecast, by Application 2019 & 2032
- Table 35: France SEBS Market Revenue (Million) Forecast, by Application 2019 & 2032
- Table 36: France SEBS Market Volume (kilotons) Forecast, by Application 2019 & 2032
- Table 37: Italy SEBS Market Revenue (Million) Forecast, by Application 2019 & 2032
- Table 38: Italy SEBS Market Volume (kilotons) Forecast, by Application 2019 & 2032
- Table 39: Rest of Europe SEBS Market Revenue (Million) Forecast, by Application 2019 & 2032
- Table 40: Rest of Europe SEBS Market Volume (kilotons) Forecast, by Application 2019 & 2032
- Table 41: Global SEBS Market Revenue Million Forecast, by Country 2019 & 2032
- Table 42: Global SEBS Market Volume kilotons Forecast, by Country 2019 & 2032
- Table 43: Brazil SEBS Market Revenue (Million) Forecast, by Application 2019 & 2032
- Table 44: Brazil SEBS Market Volume (kilotons) Forecast, by Application 2019 & 2032
- Table 45: Argentina SEBS Market Revenue (Million) Forecast, by Application 2019 & 2032
- Table 46: Argentina SEBS Market Volume (kilotons) Forecast, by Application 2019 & 2032
- Table 47: Rest of South America SEBS Market Revenue (Million) Forecast, by Application 2019 & 2032
- Table 48: Rest of South America SEBS Market Volume (kilotons) Forecast, by Application 2019 & 2032
- Table 49: Global SEBS Market Revenue Million Forecast, by Country 2019 & 2032
- Table 50: Global SEBS Market Volume kilotons Forecast, by Country 2019 & 2032
- Table 51: Saudi Arabia SEBS Market Revenue (Million) Forecast, by Application 2019 & 2032
- Table 52: Saudi Arabia SEBS Market Volume (kilotons) Forecast, by Application 2019 & 2032
- Table 53: South Africa SEBS Market Revenue (Million) Forecast, by Application 2019 & 2032
- Table 54: South Africa SEBS Market Volume (kilotons) Forecast, by Application 2019 & 2032
- Table 55: Rest of Middle East and Africa SEBS Market Revenue (Million) Forecast, by Application 2019 & 2032
- Table 56: Rest of Middle East and Africa SEBS Market Volume (kilotons) Forecast, by Application 2019 & 2032
- Table 57: Global SEBS Market Revenue Million Forecast, by Form 2019 & 2032
- Table 58: Global SEBS Market Volume kilotons Forecast, by Form 2019 & 2032
- Table 59: Global SEBS Market Revenue Million Forecast, by End-User Industry 2019 & 2032
- Table 60: Global SEBS Market Volume kilotons Forecast, by End-User Industry 2019 & 2032
- Table 61: Global SEBS Market Revenue Million Forecast, by Country 2019 & 2032
- Table 62: Global SEBS Market Volume kilotons Forecast, by Country 2019 & 2032
- Table 63: China SEBS Market Revenue (Million) Forecast, by Application 2019 & 2032
- Table 64: China SEBS Market Volume (kilotons) Forecast, by Application 2019 & 2032
- Table 65: India SEBS Market Revenue (Million) Forecast, by Application 2019 & 2032
- Table 66: India SEBS Market Volume (kilotons) Forecast, by Application 2019 & 2032
- Table 67: Japan SEBS Market Revenue (Million) Forecast, by Application 2019 & 2032
- Table 68: Japan SEBS Market Volume (kilotons) Forecast, by Application 2019 & 2032
- Table 69: South Korea SEBS Market Revenue (Million) Forecast, by Application 2019 & 2032
- Table 70: South Korea SEBS Market Volume (kilotons) Forecast, by Application 2019 & 2032
- Table 71: Malaysia SEBS Market Revenue (Million) Forecast, by Application 2019 & 2032
- Table 72: Malaysia SEBS Market Volume (kilotons) Forecast, by Application 2019 & 2032
- Table 73: Thailand SEBS Market Revenue (Million) Forecast, by Application 2019 & 2032
- Table 74: Thailand SEBS Market Volume (kilotons) Forecast, by Application 2019 & 2032
- Table 75: Indonesia SEBS Market Revenue (Million) Forecast, by Application 2019 & 2032
- Table 76: Indonesia SEBS Market Volume (kilotons) Forecast, by Application 2019 & 2032
- Table 77: Vietnam SEBS Market Revenue (Million) Forecast, by Application 2019 & 2032
- Table 78: Vietnam SEBS Market Volume (kilotons) Forecast, by Application 2019 & 2032
- Table 79: Rest of Asia Pacific SEBS Market Revenue (Million) Forecast, by Application 2019 & 2032
- Table 80: Rest of Asia Pacific SEBS Market Volume (kilotons) Forecast, by Application 2019 & 2032
- Table 81: Global SEBS Market Revenue Million Forecast, by Form 2019 & 2032
- Table 82: Global SEBS Market Volume kilotons Forecast, by Form 2019 & 2032
- Table 83: Global SEBS Market Revenue Million Forecast, by End-User Industry 2019 & 2032
- Table 84: Global SEBS Market Volume kilotons Forecast, by End-User Industry 2019 & 2032
- Table 85: Global SEBS Market Revenue Million Forecast, by Country 2019 & 2032
- Table 86: Global SEBS Market Volume kilotons Forecast, by Country 2019 & 2032
- Table 87: United States SEBS Market Revenue (Million) Forecast, by Application 2019 & 2032
- Table 88: United States SEBS Market Volume (kilotons) Forecast, by Application 2019 & 2032
- Table 89: Canada SEBS Market Revenue (Million) Forecast, by Application 2019 & 2032
- Table 90: Canada SEBS Market Volume (kilotons) Forecast, by Application 2019 & 2032
- Table 91: Mexico SEBS Market Revenue (Million) Forecast, by Application 2019 & 2032
- Table 92: Mexico SEBS Market Volume (kilotons) Forecast, by Application 2019 & 2032
- Table 93: Global SEBS Market Revenue Million Forecast, by Form 2019 & 2032
- Table 94: Global SEBS Market Volume kilotons Forecast, by Form 2019 & 2032
- Table 95: Global SEBS Market Revenue Million Forecast, by End-User Industry 2019 & 2032
- Table 96: Global SEBS Market Volume kilotons Forecast, by End-User Industry 2019 & 2032
- Table 97: Global SEBS Market Revenue Million Forecast, by Country 2019 & 2032
- Table 98: Global SEBS Market Volume kilotons Forecast, by Country 2019 & 2032
- Table 99: Germany SEBS Market Revenue (Million) Forecast, by Application 2019 & 2032
- Table 100: Germany SEBS Market Volume (kilotons) Forecast, by Application 2019 & 2032
- Table 101: United Kingdom SEBS Market Revenue (Million) Forecast, by Application 2019 & 2032
- Table 102: United Kingdom SEBS Market Volume (kilotons) Forecast, by Application 2019 & 2032
- Table 103: France SEBS Market Revenue (Million) Forecast, by Application 2019 & 2032
- Table 104: France SEBS Market Volume (kilotons) Forecast, by Application 2019 & 2032
- Table 105: Italy SEBS Market Revenue (Million) Forecast, by Application 2019 & 2032
- Table 106: Italy SEBS Market Volume (kilotons) Forecast, by Application 2019 & 2032
- Table 107: Spain SEBS Market Revenue (Million) Forecast, by Application 2019 & 2032
- Table 108: Spain SEBS Market Volume (kilotons) Forecast, by Application 2019 & 2032
- Table 109: NORDIC countries SEBS Market Revenue (Million) Forecast, by Application 2019 & 2032
- Table 110: NORDIC countries SEBS Market Volume (kilotons) Forecast, by Application 2019 & 2032
- Table 111: Turkey SEBS Market Revenue (Million) Forecast, by Application 2019 & 2032
- Table 112: Turkey SEBS Market Volume (kilotons) Forecast, by Application 2019 & 2032
- Table 113: Russia SEBS Market Revenue (Million) Forecast, by Application 2019 & 2032
- Table 114: Russia SEBS Market Volume (kilotons) Forecast, by Application 2019 & 2032
- Table 115: Rest of Europe SEBS Market Revenue (Million) Forecast, by Application 2019 & 2032
- Table 116: Rest of Europe SEBS Market Volume (kilotons) Forecast, by Application 2019 & 2032
- Table 117: Global SEBS Market Revenue Million Forecast, by Form 2019 & 2032
- Table 118: Global SEBS Market Volume kilotons Forecast, by Form 2019 & 2032
- Table 119: Global SEBS Market Revenue Million Forecast, by End-User Industry 2019 & 2032
- Table 120: Global SEBS Market Volume kilotons Forecast, by End-User Industry 2019 & 2032
- Table 121: Global SEBS Market Revenue Million Forecast, by Country 2019 & 2032
- Table 122: Global SEBS Market Volume kilotons Forecast, by Country 2019 & 2032
- Table 123: Brazil SEBS Market Revenue (Million) Forecast, by Application 2019 & 2032
- Table 124: Brazil SEBS Market Volume (kilotons) Forecast, by Application 2019 & 2032
- Table 125: Argentina SEBS Market Revenue (Million) Forecast, by Application 2019 & 2032
- Table 126: Argentina SEBS Market Volume (kilotons) Forecast, by Application 2019 & 2032
- Table 127: Colombia SEBS Market Revenue (Million) Forecast, by Application 2019 & 2032
- Table 128: Colombia SEBS Market Volume (kilotons) Forecast, by Application 2019 & 2032
- Table 129: Rest of South America SEBS Market Revenue (Million) Forecast, by Application 2019 & 2032
- Table 130: Rest of South America SEBS Market Volume (kilotons) Forecast, by Application 2019 & 2032
- Table 131: Global SEBS Market Revenue Million Forecast, by Form 2019 & 2032
- Table 132: Global SEBS Market Volume kilotons Forecast, by Form 2019 & 2032
- Table 133: Global SEBS Market Revenue Million Forecast, by End-User Industry 2019 & 2032
- Table 134: Global SEBS Market Volume kilotons Forecast, by End-User Industry 2019 & 2032
- Table 135: Global SEBS Market Revenue Million Forecast, by Country 2019 & 2032
- Table 136: Global SEBS Market Volume kilotons Forecast, by Country 2019 & 2032
- Table 137: Saudi Arabia SEBS Market Revenue (Million) Forecast, by Application 2019 & 2032
- Table 138: Saudi Arabia SEBS Market Volume (kilotons) Forecast, by Application 2019 & 2032
- Table 139: Qatar SEBS Market Revenue (Million) Forecast, by Application 2019 & 2032
- Table 140: Qatar SEBS Market Volume (kilotons) Forecast, by Application 2019 & 2032
- Table 141: United Arab Emirates SEBS Market Revenue (Million) Forecast, by Application 2019 & 2032
- Table 142: United Arab Emirates SEBS Market Volume (kilotons) Forecast, by Application 2019 & 2032
- Table 143: Nigeria SEBS Market Revenue (Million) Forecast, by Application 2019 & 2032
- Table 144: Nigeria SEBS Market Volume (kilotons) Forecast, by Application 2019 & 2032
- Table 145: Egypt SEBS Market Revenue (Million) Forecast, by Application 2019 & 2032
- Table 146: Egypt SEBS Market Volume (kilotons) Forecast, by Application 2019 & 2032
- Table 147: South Africa SEBS Market Revenue (Million) Forecast, by Application 2019 & 2032
- Table 148: South Africa SEBS Market Volume (kilotons) Forecast, by Application 2019 & 2032
- Table 149: Rest of Middle East and Africa SEBS Market Revenue (Million) Forecast, by Application 2019 & 2032
- Table 150: Rest of Middle East and Africa SEBS Market Volume (kilotons) Forecast, by Application 2019 & 2032
Frequently Asked Questions
1. What is the projected Compound Annual Growth Rate (CAGR) of the SEBS Market?
The projected CAGR is approximately 5.10%.
2. Which companies are prominent players in the SEBS Market?
Key companies in the market include Kraton Corporation, China Petrochemical & Chemical Corporation (Sinopec Corp ), Kuraray Co Ltd, Asahi Kasei Corporation, General Industrial Polymers, Dynasol Group, Celanese Corporation, Ningbo Changhong Polymer Scientific and Technical Inc, ENEOS Corporation, Trinseo, RTP Company, versalis SpA, Ravago, LCY GROUP, TSRC.
3. What are the main segments of the SEBS Market?
The market segments include Form, End-User Industry.
4. Can you provide details about the market size?
The market size is estimated to be USD XX Million as of 2022.
5. What are some drivers contributing to market growth?
Increasing Investments in the Adhesives Industry; Growing Demand From the Automotive Industry; Other Drivers.
6. What are the notable trends driving market growth?
The Automotive Industry is Expected to Dominate the Market.
7. Are there any restraints impacting market growth?
Hazardous Nature and Regulations of Styrene; Other Restraints.
8. Can you provide examples of recent developments in the market?
August 2022: Kraton announced the expansion of the production capacity of styrene block copolymers at a manufacturing facility in Mailiao, Taiwan. This strategic move was expected to increase the capacity of the facility by 30% for the styrene-ethylene-butylene-styrene product range.
9. What pricing options are available for accessing the report?
Pricing options include single-user, multi-user, and enterprise licenses priced at USD 4750, USD 5250, and USD 8750 respectively.
10. Is the market size provided in terms of value or volume?
The market size is provided in terms of value, measured in Million and volume, measured in kilotons.
11. Are there any specific market keywords associated with the report?
Yes, the market keyword associated with the report is "SEBS Market," which aids in identifying and referencing the specific market segment covered.
12. How do I determine which pricing option suits my needs best?
The pricing options vary based on user requirements and access needs. Individual users may opt for single-user licenses, while businesses requiring broader access may choose multi-user or enterprise licenses for cost-effective access to the report.
13. Are there any additional resources or data provided in the SEBS Market report?
While the report offers comprehensive insights, it's advisable to review the specific contents or supplementary materials provided to ascertain if additional resources or data are available.
14. How can I stay updated on further developments or reports in the SEBS Market?
To stay informed about further developments, trends, and reports in the SEBS Market, consider subscribing to industry newsletters, following relevant companies and organizations, or regularly checking reputable industry news sources and publications.
Methodology
Step 1 - Identification of Relevant Samples Size from Population Database


Step 2 - Approaches for Defining Global Market Size (Value, Volume* & Price*)

Note*: In applicable scenarios
Step 3 - Data Sources
Primary Research
- Web Analytics
- Survey Reports
- Research Institute
- Latest Research Reports
- Opinion Leaders
Secondary Research
- Annual Reports
- White Paper
- Latest Press Release
- Industry Association
- Paid Database
- Investor Presentations

Step 4 - Data Triangulation
Involves using different sources of information in order to increase the validity of a study
These sources are likely to be stakeholders in a program - participants, other researchers, program staff, other community members, and so on.
Then we put all data in single framework & apply various statistical tools to find out the dynamic on the market.
During the analysis stage, feedback from the stakeholder groups would be compared to determine areas of agreement as well as areas of divergence


