
Key Insights
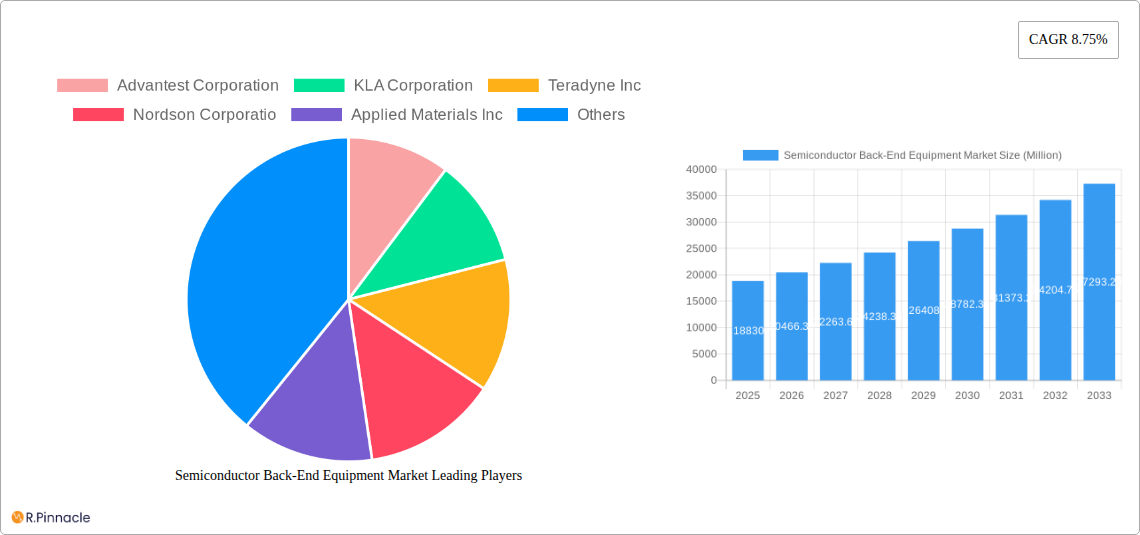
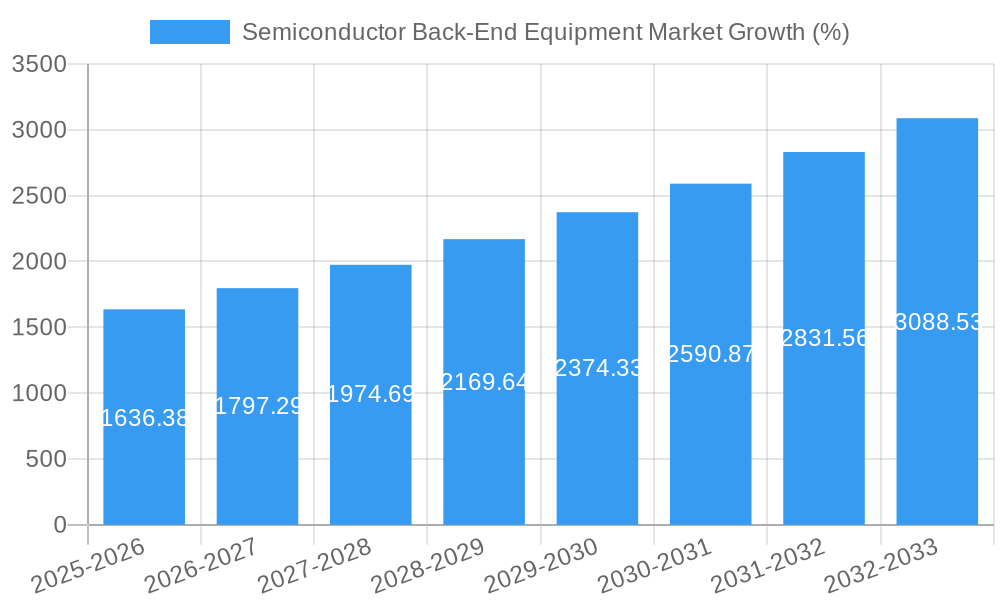
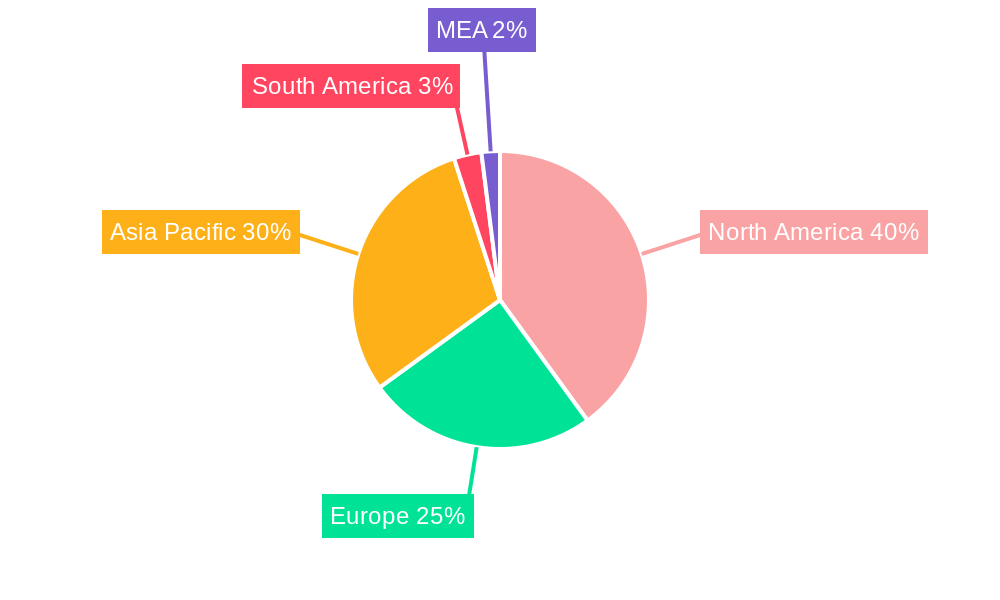
The semiconductor back-end equipment market is experiencing robust growth, projected to reach \$18.83 billion in 2025 and maintain a Compound Annual Growth Rate (CAGR) of 8.75% from 2025 to 2033. This expansion is fueled by several key factors. The increasing demand for advanced semiconductor devices in diverse applications, including smartphones, IoT devices, automotive electronics, and high-performance computing, is a primary driver. Furthermore, advancements in miniaturization and the rise of heterogeneous integration are pushing the need for sophisticated back-end equipment capable of handling complex processes. The ongoing trend towards automation and improved yield optimization within semiconductor fabrication plants also significantly contributes to market growth. Competition among leading manufacturers is intense, with companies like Advantest, KLA, Teradyne, and Applied Materials vying for market share through technological innovation and strategic partnerships. Geographical expansion is also a key aspect, with North America and Asia-Pacific expected to remain dominant regions due to the presence of major semiconductor manufacturers and supportive government initiatives. However, challenges such as high capital investment requirements and the cyclical nature of the semiconductor industry could potentially temper growth in the short term.
The market segmentation reveals significant opportunities within various back-end processes. Metrology and inspection equipment constitute a major segment, driven by the critical need for precise quality control at each stage. Dicing, bonding, assembly, and packaging segments are all experiencing growth aligned with the overall market expansion. While North America currently holds a substantial market share, the Asia-Pacific region is poised for significant growth, driven by substantial investments in semiconductor manufacturing capacity in countries like China, Taiwan, South Korea, and Japan. Europe also holds a notable market position, although at a slower growth trajectory compared to Asia-Pacific. The long-term outlook remains positive, anticipating continued growth driven by the evolving demands of the electronics industry and advancements in semiconductor technology.
Semiconductor Back-End Equipment Market Report: 2019-2033
This comprehensive report provides a detailed analysis of the Semiconductor Back-End Equipment Market, offering actionable insights for industry professionals. With a study period spanning 2019-2033, a base year of 2025, and a forecast period of 2025-2033, this report covers historical data (2019-2024) and future projections. The market is segmented by type: Metrology and Inspection, Dicing, Bonding, Assembly and Packaging. Key players analyzed include Advantest Corporation, KLA Corporation, Teradyne Inc, Nordson Corporation, Applied Materials Inc, ASML Holding N V, Screen Holdings Co Ltd, Onto Innovation Inc, Tokyo Electron Limited, and LAM Research Corporation. The report's total market value is projected at xx Million by 2033, demonstrating significant growth potential.
Semiconductor Back-End Equipment Market Structure & Innovation Trends
The Semiconductor Back-End Equipment market exhibits a moderately concentrated structure, with a few dominant players holding significant market share. The market share distribution among the top 10 companies is estimated at approximately 70% in 2025, with further consolidation predicted through mergers and acquisitions (M&A). Innovation is driven by the relentless pursuit of miniaturization, improved performance, and cost reduction in semiconductor devices. Stringent regulatory frameworks governing safety and environmental compliance also shape industry practices. Product substitutes are limited, primarily focused on alternative packaging techniques, but overall market dominance is secured by established players. The end-user demographic is predominantly composed of integrated device manufacturers (IDMs) and outsourced semiconductor assembly and test (OSAT) companies, with a growing presence of fabless semiconductor companies. M&A activity has been substantial over the past five years, with several large deals exceeding $xx Million aimed at expanding capabilities and market reach.
- Market Concentration: High, with top 10 players controlling ~70% of the market in 2025.
- M&A Activity: Significant, with recent deals valued at over $xx Million.
- Innovation Drivers: Miniaturization, performance enhancement, and cost reduction.
- Regulatory Frameworks: Focus on safety, environmental compliance, and intellectual property.
Semiconductor Back-End Equipment Market Dynamics & Trends
The Semiconductor Back-End Equipment market is experiencing robust growth, fueled by the increasing demand for advanced semiconductor devices across various end-use industries, such as consumer electronics, automotive, and data centers. This growth is supported by rising adoption of sophisticated packaging technologies like 3D stacking and system-in-package (SiP), driving demand for specialized equipment. Technological disruptions are primarily centered around advanced laser technologies, AI-driven automation, and improved process control systems. These advancements enhance efficiency, precision, and yield in the back-end processes. Consumer preferences heavily influence the market, with increasing demand for smaller, faster, and more power-efficient devices that require sophisticated packaging solutions. Competitive dynamics are characterized by intense competition, innovation races, and strategic partnerships. The Compound Annual Growth Rate (CAGR) is projected at xx% from 2025 to 2033, indicating a significant market expansion. Market penetration for advanced packaging technologies is expected to reach xx% by 2033.
Dominant Regions & Segments in Semiconductor Back-End Equipment Market
The Asia-Pacific region, particularly East Asia (Taiwan, South Korea, and China), dominates the semiconductor back-end equipment market. This dominance is attributable to a high concentration of semiconductor manufacturing facilities, robust government support for the semiconductor industry, and a vast pool of skilled labor. Other regions like North America and Europe hold significant shares but lag behind Asia-Pacific in terms of market size and growth rate.
Key Drivers for Asia-Pacific Dominance:
- High concentration of semiconductor manufacturing facilities.
- Significant government investment and supportive policies.
- Large and skilled workforce.
- Strong technological innovation ecosystem.
Among the market segments by type, the Assembly and Packaging segment currently holds the largest market share. This is largely due to the increasing complexity of semiconductor packaging and the growing demand for advanced packaging technologies. The Metrology and Inspection segment is also experiencing strong growth driven by increasing needs for higher precision and quality control. The Dicing and Bonding segments, while important, have slightly slower growth rates compared to the other two. Detailed analysis reveals the following regional trends for each segment: In the Assembly and Packaging sector, East Asia dominates due to the aforementioned factors, whereas North America maintains a strong position in the Metrology and Inspection segment due to its focus on advanced equipment development and stringent quality control standards. The Dicing and Bonding segments exhibit comparatively more diversified regional presence.
Semiconductor Back-End Equipment Market Product Innovations
Recent innovations include Tokyo Electron's Extreme Laser Lift Off (XLO) technology for 3D integration and Advantest Corporation's new products for AI/HPC market needs. These exemplify trends toward improved process control, higher throughput, and reduced defects. The innovations enhance efficiency, increase yield, and facilitate the manufacturing of more advanced semiconductor devices. The market fit for these innovations is strong due to industry-wide adoption of advanced packaging techniques and escalating demand for high-performance computing. Further product developments are focused on addressing challenges in handling ever-smaller components and increasing throughput while maintaining quality.
Report Scope & Segmentation Analysis
The report segments the Semiconductor Back-End Equipment market primarily by type:
Metrology and Inspection: This segment encompasses equipment used for measuring and inspecting semiconductor wafers and packages. The market size is projected at xx Million in 2025, with a CAGR of xx% during the forecast period. Competition is intense, with established players focusing on technological advancements.
Dicing: This segment includes equipment used for dicing semiconductor wafers into individual dies. The market size is estimated at xx Million in 2025, and is expected to grow at a CAGR of xx% during the forecast period. Established players are improving precision and automation.
Bonding: This segment covers equipment for wire bonding, die bonding, and other bonding processes. The 2025 market size is anticipated to be xx Million, with a forecast CAGR of xx%. This segment sees ongoing innovations improving the reliability and efficiency of bonding processes.
Assembly and Packaging: This segment is the largest, encompassing equipment used for various assembly and packaging processes, including substrate preparation, molding, and testing. The 2025 market size is estimated at xx Million, with a CAGR of xx% expected during the forecast period, due to the rising demand for advanced packaging techniques. Competition is highly competitive in this area, with significant investment in R&D.
Key Drivers of Semiconductor Back-End Equipment Market Growth
The Semiconductor Back-End Equipment market is driven by several factors: the increasing demand for advanced semiconductor devices in various applications (e.g., 5G, AI, IoT); advancements in semiconductor packaging technologies (e.g., 3D integration, system-in-package); rising investments in research and development within the semiconductor industry; and government incentives and supportive policies for semiconductor manufacturing. These factors collectively fuel demand for sophisticated back-end equipment.
Challenges in the Semiconductor Back-End Equipment Market Sector
Significant challenges exist, including the high cost of advanced equipment, the complexity of the manufacturing processes, and the need for continuous innovation to meet the demands of ever-shrinking components. Supply chain disruptions, driven by geopolitical uncertainties, create additional hurdles. Furthermore, stringent regulatory requirements increase costs and complexity, potentially hindering growth if not managed effectively. These factors can affect profit margins, impacting the overall market outlook. The estimated impact of these challenges on the market growth is a reduction of xx% by 2033.
Emerging Opportunities in Semiconductor Back-End Equipment Market
Emerging opportunities arise from the growth of new applications such as automotive electronics, wearable devices, and advanced medical technologies. The development of innovative packaging techniques, such as 3D integration and chiplets, opens new avenues for market expansion. Furthermore, advancements in artificial intelligence and machine learning are creating opportunities for enhanced process optimization and automation. These opportunities are expected to increase the market value by xx Million by 2033.
Leading Players in the Semiconductor Back-End Equipment Market Market
- Advantest Corporation
- KLA Corporation
- Teradyne Inc
- Nordson Corporation
- Applied Materials Inc
- ASML Holding N V
- Screen Holdings Co Ltd
- Onto Innovation Inc
- Tokyo Electron Limited
- LAM Research Corporation
Key Developments in Semiconductor Back-End Equipment Market Industry
December 2023: Tokyo Electron announced the development of Extreme Laser Lift Off (XLO) technology for 3D integration, enhancing permanent wafer bonding capabilities. This significantly advances 3D packaging possibilities.
December 2023: Advantest Corporation launched the HA1200 die-level handler and a 2kW ATC option for the M487x handler series, catering to the growing AI/HPC market's testing needs. This addresses the increasing complexity of advanced packaging technologies in high-growth sectors.
Future Outlook for Semiconductor Back-End Equipment Market Market
The future outlook for the Semiconductor Back-End Equipment market is positive, driven by the continued miniaturization of semiconductor devices, the increasing demand for advanced packaging technologies, and the expansion of various end-use industries. Strategic partnerships and collaborations among key players, coupled with ongoing technological advancements, will further enhance market growth and open new opportunities for innovation and expansion. The market is projected to see substantial growth, exceeding xx Million by 2033, driven by factors previously mentioned.
Semiconductor Back-End Equipment Market Segmentation
-
1. Type
- 1.1. Metrology and Inspection
- 1.2. Dicing
- 1.3. Bonding
- 1.4. Assembly and Packaging
-
2. End-Use Industry
- 2.1. Semiconductors
- 2.2. Electronics
- 2.3. Automotive
- 2.4. Medical
- 2.5. Defense
Semiconductor Back-End Equipment Market Segmentation By Geography
- 1. United States
- 2. Europe
- 3. China
- 4. South Korea
- 5. Taiwan
- 6. Japan
- 7. Rest of the Asia Pacific
- 8. Rest of the World
Semiconductor Back-End Equipment Market REPORT HIGHLIGHTS
| Aspects | Details |
|---|---|
| Study Period | 2019-2033 |
| Base Year | 2024 |
| Estimated Year | 2025 |
| Forecast Period | 2025-2033 |
| Historical Period | 2019-2024 |
| Growth Rate | CAGR of 8.75% from 2019-2033 |
| Segmentation |
|
Table of Contents
- 1. Introduction
- 1.1. Research Scope
- 1.2. Market Segmentation
- 1.3. Research Methodology
- 1.4. Definitions and Assumptions
- 2. Executive Summary
- 2.1. Introduction
- 3. Market Dynamics
- 3.1. Introduction
- 3.2. Market Drivers
- 3.2.1. Increasing Demand for Semiconductors in Electric and Hybrid Vehicles; Demand for Setting Up New Foundries (International Chip Shortage)
- 3.3. Market Restrains
- 3.3.1. High Setup Costs; Constant Evolution of Products Influencing Demand
- 3.4. Market Trends
- 3.4.1. Assembly and Packaging Segment is Expected to Witness Significant Growth
- 4. Market Factor Analysis
- 4.1. Porters Five Forces
- 4.2. Supply/Value Chain
- 4.3. PESTEL analysis
- 4.4. Market Entropy
- 4.5. Patent/Trademark Analysis
- 5. Global Semiconductor Back-End Equipment Market Analysis, Insights and Forecast, 2019-2031
- 5.1. Market Analysis, Insights and Forecast - by Type
- 5.1.1. Metrology and Inspection
- 5.1.2. Dicing
- 5.1.3. Bonding
- 5.1.4. Assembly and Packaging
- 5.2. Market Analysis, Insights and Forecast - by End-Use Industry
- 5.2.1. Semiconductors
- 5.2.2. Electronics
- 5.2.3. Automotive
- 5.2.4. Medical
- 5.2.5. Defense
- 5.3. Market Analysis, Insights and Forecast - by Region
- 5.3.1. United States
- 5.3.2. Europe
- 5.3.3. China
- 5.3.4. South Korea
- 5.3.5. Taiwan
- 5.3.6. Japan
- 5.3.7. Rest of the Asia Pacific
- 5.3.8. Rest of the World
- 5.1. Market Analysis, Insights and Forecast - by Type
- 6. United States Semiconductor Back-End Equipment Market Analysis, Insights and Forecast, 2019-2031
- 6.1. Market Analysis, Insights and Forecast - by Type
- 6.1.1. Metrology and Inspection
- 6.1.2. Dicing
- 6.1.3. Bonding
- 6.1.4. Assembly and Packaging
- 6.2. Market Analysis, Insights and Forecast - by End-Use Industry
- 6.2.1. Semiconductors
- 6.2.2. Electronics
- 6.2.3. Automotive
- 6.2.4. Medical
- 6.2.5. Defense
- 6.1. Market Analysis, Insights and Forecast - by Type
- 7. Europe Semiconductor Back-End Equipment Market Analysis, Insights and Forecast, 2019-2031
- 7.1. Market Analysis, Insights and Forecast - by Type
- 7.1.1. Metrology and Inspection
- 7.1.2. Dicing
- 7.1.3. Bonding
- 7.1.4. Assembly and Packaging
- 7.2. Market Analysis, Insights and Forecast - by End-Use Industry
- 7.2.1. Semiconductors
- 7.2.2. Electronics
- 7.2.3. Automotive
- 7.2.4. Medical
- 7.2.5. Defense
- 7.1. Market Analysis, Insights and Forecast - by Type
- 8. China Semiconductor Back-End Equipment Market Analysis, Insights and Forecast, 2019-2031
- 8.1. Market Analysis, Insights and Forecast - by Type
- 8.1.1. Metrology and Inspection
- 8.1.2. Dicing
- 8.1.3. Bonding
- 8.1.4. Assembly and Packaging
- 8.2. Market Analysis, Insights and Forecast - by End-Use Industry
- 8.2.1. Semiconductors
- 8.2.2. Electronics
- 8.2.3. Automotive
- 8.2.4. Medical
- 8.2.5. Defense
- 8.1. Market Analysis, Insights and Forecast - by Type
- 9. South Korea Semiconductor Back-End Equipment Market Analysis, Insights and Forecast, 2019-2031
- 9.1. Market Analysis, Insights and Forecast - by Type
- 9.1.1. Metrology and Inspection
- 9.1.2. Dicing
- 9.1.3. Bonding
- 9.1.4. Assembly and Packaging
- 9.2. Market Analysis, Insights and Forecast - by End-Use Industry
- 9.2.1. Semiconductors
- 9.2.2. Electronics
- 9.2.3. Automotive
- 9.2.4. Medical
- 9.2.5. Defense
- 9.1. Market Analysis, Insights and Forecast - by Type
- 10. Taiwan Semiconductor Back-End Equipment Market Analysis, Insights and Forecast, 2019-2031
- 10.1. Market Analysis, Insights and Forecast - by Type
- 10.1.1. Metrology and Inspection
- 10.1.2. Dicing
- 10.1.3. Bonding
- 10.1.4. Assembly and Packaging
- 10.2. Market Analysis, Insights and Forecast - by End-Use Industry
- 10.2.1. Semiconductors
- 10.2.2. Electronics
- 10.2.3. Automotive
- 10.2.4. Medical
- 10.2.5. Defense
- 10.1. Market Analysis, Insights and Forecast - by Type
- 11. Japan Semiconductor Back-End Equipment Market Analysis, Insights and Forecast, 2019-2031
- 11.1. Market Analysis, Insights and Forecast - by Type
- 11.1.1. Metrology and Inspection
- 11.1.2. Dicing
- 11.1.3. Bonding
- 11.1.4. Assembly and Packaging
- 11.2. Market Analysis, Insights and Forecast - by End-Use Industry
- 11.2.1. Semiconductors
- 11.2.2. Electronics
- 11.2.3. Automotive
- 11.2.4. Medical
- 11.2.5. Defense
- 11.1. Market Analysis, Insights and Forecast - by Type
- 12. Rest of the Asia Pacific Semiconductor Back-End Equipment Market Analysis, Insights and Forecast, 2019-2031
- 12.1. Market Analysis, Insights and Forecast - by Type
- 12.1.1. Metrology and Inspection
- 12.1.2. Dicing
- 12.1.3. Bonding
- 12.1.4. Assembly and Packaging
- 12.2. Market Analysis, Insights and Forecast - by End-Use Industry
- 12.2.1. Semiconductors
- 12.2.2. Electronics
- 12.2.3. Automotive
- 12.2.4. Medical
- 12.2.5. Defense
- 12.1. Market Analysis, Insights and Forecast - by Type
- 13. Rest of the World Semiconductor Back-End Equipment Market Analysis, Insights and Forecast, 2019-2031
- 13.1. Market Analysis, Insights and Forecast - by Type
- 13.1.1. Metrology and Inspection
- 13.1.2. Dicing
- 13.1.3. Bonding
- 13.1.4. Assembly and Packaging
- 13.2. Market Analysis, Insights and Forecast - by End-Use Industry
- 13.2.1. Semiconductors
- 13.2.2. Electronics
- 13.2.3. Automotive
- 13.2.4. Medical
- 13.2.5. Defense
- 13.1. Market Analysis, Insights and Forecast - by Type
- 14. North America Semiconductor Back-End Equipment Market Analysis, Insights and Forecast, 2019-2031
- 14.1. Market Analysis, Insights and Forecast - By Country/Sub-region
- 14.1.1 United States
- 14.1.2 Canada
- 14.1.3 Mexico
- 15. Europe Semiconductor Back-End Equipment Market Analysis, Insights and Forecast, 2019-2031
- 15.1. Market Analysis, Insights and Forecast - By Country/Sub-region
- 15.1.1 Germany
- 15.1.2 United Kingdom
- 15.1.3 France
- 15.1.4 Spain
- 15.1.5 Italy
- 15.1.6 Spain
- 15.1.7 Belgium
- 15.1.8 Netherland
- 15.1.9 Nordics
- 15.1.10 Rest of Europe
- 16. Asia Pacific Semiconductor Back-End Equipment Market Analysis, Insights and Forecast, 2019-2031
- 16.1. Market Analysis, Insights and Forecast - By Country/Sub-region
- 16.1.1 China
- 16.1.2 Japan
- 16.1.3 India
- 16.1.4 South Korea
- 16.1.5 Southeast Asia
- 16.1.6 Australia
- 16.1.7 Indonesia
- 16.1.8 Phillipes
- 16.1.9 Singapore
- 16.1.10 Thailandc
- 16.1.11 Rest of Asia Pacific
- 17. South America Semiconductor Back-End Equipment Market Analysis, Insights and Forecast, 2019-2031
- 17.1. Market Analysis, Insights and Forecast - By Country/Sub-region
- 17.1.1 Brazil
- 17.1.2 Argentina
- 17.1.3 Peru
- 17.1.4 Chile
- 17.1.5 Colombia
- 17.1.6 Ecuador
- 17.1.7 Venezuela
- 17.1.8 Rest of South America
- 18. North America Semiconductor Back-End Equipment Market Analysis, Insights and Forecast, 2019-2031
- 18.1. Market Analysis, Insights and Forecast - By Country/Sub-region
- 18.1.1 United States
- 18.1.2 Canada
- 18.1.3 Mexico
- 19. MEA Semiconductor Back-End Equipment Market Analysis, Insights and Forecast, 2019-2031
- 19.1. Market Analysis, Insights and Forecast - By Country/Sub-region
- 19.1.1 United Arab Emirates
- 19.1.2 Saudi Arabia
- 19.1.3 South Africa
- 19.1.4 Rest of Middle East and Africa
- 20. Competitive Analysis
- 20.1. Global Market Share Analysis 2024
- 20.2. Company Profiles
- 20.2.1 Advantest Corporation
- 20.2.1.1. Overview
- 20.2.1.2. Products
- 20.2.1.3. SWOT Analysis
- 20.2.1.4. Recent Developments
- 20.2.1.5. Financials (Based on Availability)
- 20.2.2 KLA Corporation
- 20.2.2.1. Overview
- 20.2.2.2. Products
- 20.2.2.3. SWOT Analysis
- 20.2.2.4. Recent Developments
- 20.2.2.5. Financials (Based on Availability)
- 20.2.3 Teradyne Inc
- 20.2.3.1. Overview
- 20.2.3.2. Products
- 20.2.3.3. SWOT Analysis
- 20.2.3.4. Recent Developments
- 20.2.3.5. Financials (Based on Availability)
- 20.2.4 Nordson Corporatio
- 20.2.4.1. Overview
- 20.2.4.2. Products
- 20.2.4.3. SWOT Analysis
- 20.2.4.4. Recent Developments
- 20.2.4.5. Financials (Based on Availability)
- 20.2.5 Applied Materials Inc
- 20.2.5.1. Overview
- 20.2.5.2. Products
- 20.2.5.3. SWOT Analysis
- 20.2.5.4. Recent Developments
- 20.2.5.5. Financials (Based on Availability)
- 20.2.6 ASML Holding N V
- 20.2.6.1. Overview
- 20.2.6.2. Products
- 20.2.6.3. SWOT Analysis
- 20.2.6.4. Recent Developments
- 20.2.6.5. Financials (Based on Availability)
- 20.2.7 Screen Holdings Co Ltd
- 20.2.7.1. Overview
- 20.2.7.2. Products
- 20.2.7.3. SWOT Analysis
- 20.2.7.4. Recent Developments
- 20.2.7.5. Financials (Based on Availability)
- 20.2.8 Onto Innovation Inc
- 20.2.8.1. Overview
- 20.2.8.2. Products
- 20.2.8.3. SWOT Analysis
- 20.2.8.4. Recent Developments
- 20.2.8.5. Financials (Based on Availability)
- 20.2.9 Tokyo Electron Limited
- 20.2.9.1. Overview
- 20.2.9.2. Products
- 20.2.9.3. SWOT Analysis
- 20.2.9.4. Recent Developments
- 20.2.9.5. Financials (Based on Availability)
- 20.2.10 LAM Research Corporation
- 20.2.10.1. Overview
- 20.2.10.2. Products
- 20.2.10.3. SWOT Analysis
- 20.2.10.4. Recent Developments
- 20.2.10.5. Financials (Based on Availability)
- 20.2.1 Advantest Corporation
List of Figures
- Figure 1: Global Semiconductor Back-End Equipment Market Revenue Breakdown (Million, %) by Region 2024 & 2032
- Figure 2: Global Semiconductor Back-End Equipment Market Volume Breakdown (K Unit, %) by Region 2024 & 2032
- Figure 3: North America Semiconductor Back-End Equipment Market Revenue (Million), by Country 2024 & 2032
- Figure 4: North America Semiconductor Back-End Equipment Market Volume (K Unit), by Country 2024 & 2032
- Figure 5: North America Semiconductor Back-End Equipment Market Revenue Share (%), by Country 2024 & 2032
- Figure 6: North America Semiconductor Back-End Equipment Market Volume Share (%), by Country 2024 & 2032
- Figure 7: Europe Semiconductor Back-End Equipment Market Revenue (Million), by Country 2024 & 2032
- Figure 8: Europe Semiconductor Back-End Equipment Market Volume (K Unit), by Country 2024 & 2032
- Figure 9: Europe Semiconductor Back-End Equipment Market Revenue Share (%), by Country 2024 & 2032
- Figure 10: Europe Semiconductor Back-End Equipment Market Volume Share (%), by Country 2024 & 2032
- Figure 11: Asia Pacific Semiconductor Back-End Equipment Market Revenue (Million), by Country 2024 & 2032
- Figure 12: Asia Pacific Semiconductor Back-End Equipment Market Volume (K Unit), by Country 2024 & 2032
- Figure 13: Asia Pacific Semiconductor Back-End Equipment Market Revenue Share (%), by Country 2024 & 2032
- Figure 14: Asia Pacific Semiconductor Back-End Equipment Market Volume Share (%), by Country 2024 & 2032
- Figure 15: South America Semiconductor Back-End Equipment Market Revenue (Million), by Country 2024 & 2032
- Figure 16: South America Semiconductor Back-End Equipment Market Volume (K Unit), by Country 2024 & 2032
- Figure 17: South America Semiconductor Back-End Equipment Market Revenue Share (%), by Country 2024 & 2032
- Figure 18: South America Semiconductor Back-End Equipment Market Volume Share (%), by Country 2024 & 2032
- Figure 19: North America Semiconductor Back-End Equipment Market Revenue (Million), by Country 2024 & 2032
- Figure 20: North America Semiconductor Back-End Equipment Market Volume (K Unit), by Country 2024 & 2032
- Figure 21: North America Semiconductor Back-End Equipment Market Revenue Share (%), by Country 2024 & 2032
- Figure 22: North America Semiconductor Back-End Equipment Market Volume Share (%), by Country 2024 & 2032
- Figure 23: MEA Semiconductor Back-End Equipment Market Revenue (Million), by Country 2024 & 2032
- Figure 24: MEA Semiconductor Back-End Equipment Market Volume (K Unit), by Country 2024 & 2032
- Figure 25: MEA Semiconductor Back-End Equipment Market Revenue Share (%), by Country 2024 & 2032
- Figure 26: MEA Semiconductor Back-End Equipment Market Volume Share (%), by Country 2024 & 2032
- Figure 27: United States Semiconductor Back-End Equipment Market Revenue (Million), by Type 2024 & 2032
- Figure 28: United States Semiconductor Back-End Equipment Market Volume (K Unit), by Type 2024 & 2032
- Figure 29: United States Semiconductor Back-End Equipment Market Revenue Share (%), by Type 2024 & 2032
- Figure 30: United States Semiconductor Back-End Equipment Market Volume Share (%), by Type 2024 & 2032
- Figure 31: United States Semiconductor Back-End Equipment Market Revenue (Million), by End-Use Industry 2024 & 2032
- Figure 32: United States Semiconductor Back-End Equipment Market Volume (K Unit), by End-Use Industry 2024 & 2032
- Figure 33: United States Semiconductor Back-End Equipment Market Revenue Share (%), by End-Use Industry 2024 & 2032
- Figure 34: United States Semiconductor Back-End Equipment Market Volume Share (%), by End-Use Industry 2024 & 2032
- Figure 35: United States Semiconductor Back-End Equipment Market Revenue (Million), by Country 2024 & 2032
- Figure 36: United States Semiconductor Back-End Equipment Market Volume (K Unit), by Country 2024 & 2032
- Figure 37: United States Semiconductor Back-End Equipment Market Revenue Share (%), by Country 2024 & 2032
- Figure 38: United States Semiconductor Back-End Equipment Market Volume Share (%), by Country 2024 & 2032
- Figure 39: Europe Semiconductor Back-End Equipment Market Revenue (Million), by Type 2024 & 2032
- Figure 40: Europe Semiconductor Back-End Equipment Market Volume (K Unit), by Type 2024 & 2032
- Figure 41: Europe Semiconductor Back-End Equipment Market Revenue Share (%), by Type 2024 & 2032
- Figure 42: Europe Semiconductor Back-End Equipment Market Volume Share (%), by Type 2024 & 2032
- Figure 43: Europe Semiconductor Back-End Equipment Market Revenue (Million), by End-Use Industry 2024 & 2032
- Figure 44: Europe Semiconductor Back-End Equipment Market Volume (K Unit), by End-Use Industry 2024 & 2032
- Figure 45: Europe Semiconductor Back-End Equipment Market Revenue Share (%), by End-Use Industry 2024 & 2032
- Figure 46: Europe Semiconductor Back-End Equipment Market Volume Share (%), by End-Use Industry 2024 & 2032
- Figure 47: Europe Semiconductor Back-End Equipment Market Revenue (Million), by Country 2024 & 2032
- Figure 48: Europe Semiconductor Back-End Equipment Market Volume (K Unit), by Country 2024 & 2032
- Figure 49: Europe Semiconductor Back-End Equipment Market Revenue Share (%), by Country 2024 & 2032
- Figure 50: Europe Semiconductor Back-End Equipment Market Volume Share (%), by Country 2024 & 2032
- Figure 51: China Semiconductor Back-End Equipment Market Revenue (Million), by Type 2024 & 2032
- Figure 52: China Semiconductor Back-End Equipment Market Volume (K Unit), by Type 2024 & 2032
- Figure 53: China Semiconductor Back-End Equipment Market Revenue Share (%), by Type 2024 & 2032
- Figure 54: China Semiconductor Back-End Equipment Market Volume Share (%), by Type 2024 & 2032
- Figure 55: China Semiconductor Back-End Equipment Market Revenue (Million), by End-Use Industry 2024 & 2032
- Figure 56: China Semiconductor Back-End Equipment Market Volume (K Unit), by End-Use Industry 2024 & 2032
- Figure 57: China Semiconductor Back-End Equipment Market Revenue Share (%), by End-Use Industry 2024 & 2032
- Figure 58: China Semiconductor Back-End Equipment Market Volume Share (%), by End-Use Industry 2024 & 2032
- Figure 59: China Semiconductor Back-End Equipment Market Revenue (Million), by Country 2024 & 2032
- Figure 60: China Semiconductor Back-End Equipment Market Volume (K Unit), by Country 2024 & 2032
- Figure 61: China Semiconductor Back-End Equipment Market Revenue Share (%), by Country 2024 & 2032
- Figure 62: China Semiconductor Back-End Equipment Market Volume Share (%), by Country 2024 & 2032
- Figure 63: South Korea Semiconductor Back-End Equipment Market Revenue (Million), by Type 2024 & 2032
- Figure 64: South Korea Semiconductor Back-End Equipment Market Volume (K Unit), by Type 2024 & 2032
- Figure 65: South Korea Semiconductor Back-End Equipment Market Revenue Share (%), by Type 2024 & 2032
- Figure 66: South Korea Semiconductor Back-End Equipment Market Volume Share (%), by Type 2024 & 2032
- Figure 67: South Korea Semiconductor Back-End Equipment Market Revenue (Million), by End-Use Industry 2024 & 2032
- Figure 68: South Korea Semiconductor Back-End Equipment Market Volume (K Unit), by End-Use Industry 2024 & 2032
- Figure 69: South Korea Semiconductor Back-End Equipment Market Revenue Share (%), by End-Use Industry 2024 & 2032
- Figure 70: South Korea Semiconductor Back-End Equipment Market Volume Share (%), by End-Use Industry 2024 & 2032
- Figure 71: South Korea Semiconductor Back-End Equipment Market Revenue (Million), by Country 2024 & 2032
- Figure 72: South Korea Semiconductor Back-End Equipment Market Volume (K Unit), by Country 2024 & 2032
- Figure 73: South Korea Semiconductor Back-End Equipment Market Revenue Share (%), by Country 2024 & 2032
- Figure 74: South Korea Semiconductor Back-End Equipment Market Volume Share (%), by Country 2024 & 2032
- Figure 75: Taiwan Semiconductor Back-End Equipment Market Revenue (Million), by Type 2024 & 2032
- Figure 76: Taiwan Semiconductor Back-End Equipment Market Volume (K Unit), by Type 2024 & 2032
- Figure 77: Taiwan Semiconductor Back-End Equipment Market Revenue Share (%), by Type 2024 & 2032
- Figure 78: Taiwan Semiconductor Back-End Equipment Market Volume Share (%), by Type 2024 & 2032
- Figure 79: Taiwan Semiconductor Back-End Equipment Market Revenue (Million), by End-Use Industry 2024 & 2032
- Figure 80: Taiwan Semiconductor Back-End Equipment Market Volume (K Unit), by End-Use Industry 2024 & 2032
- Figure 81: Taiwan Semiconductor Back-End Equipment Market Revenue Share (%), by End-Use Industry 2024 & 2032
- Figure 82: Taiwan Semiconductor Back-End Equipment Market Volume Share (%), by End-Use Industry 2024 & 2032
- Figure 83: Taiwan Semiconductor Back-End Equipment Market Revenue (Million), by Country 2024 & 2032
- Figure 84: Taiwan Semiconductor Back-End Equipment Market Volume (K Unit), by Country 2024 & 2032
- Figure 85: Taiwan Semiconductor Back-End Equipment Market Revenue Share (%), by Country 2024 & 2032
- Figure 86: Taiwan Semiconductor Back-End Equipment Market Volume Share (%), by Country 2024 & 2032
- Figure 87: Japan Semiconductor Back-End Equipment Market Revenue (Million), by Type 2024 & 2032
- Figure 88: Japan Semiconductor Back-End Equipment Market Volume (K Unit), by Type 2024 & 2032
- Figure 89: Japan Semiconductor Back-End Equipment Market Revenue Share (%), by Type 2024 & 2032
- Figure 90: Japan Semiconductor Back-End Equipment Market Volume Share (%), by Type 2024 & 2032
- Figure 91: Japan Semiconductor Back-End Equipment Market Revenue (Million), by End-Use Industry 2024 & 2032
- Figure 92: Japan Semiconductor Back-End Equipment Market Volume (K Unit), by End-Use Industry 2024 & 2032
- Figure 93: Japan Semiconductor Back-End Equipment Market Revenue Share (%), by End-Use Industry 2024 & 2032
- Figure 94: Japan Semiconductor Back-End Equipment Market Volume Share (%), by End-Use Industry 2024 & 2032
- Figure 95: Japan Semiconductor Back-End Equipment Market Revenue (Million), by Country 2024 & 2032
- Figure 96: Japan Semiconductor Back-End Equipment Market Volume (K Unit), by Country 2024 & 2032
- Figure 97: Japan Semiconductor Back-End Equipment Market Revenue Share (%), by Country 2024 & 2032
- Figure 98: Japan Semiconductor Back-End Equipment Market Volume Share (%), by Country 2024 & 2032
- Figure 99: Rest of the Asia Pacific Semiconductor Back-End Equipment Market Revenue (Million), by Type 2024 & 2032
- Figure 100: Rest of the Asia Pacific Semiconductor Back-End Equipment Market Volume (K Unit), by Type 2024 & 2032
- Figure 101: Rest of the Asia Pacific Semiconductor Back-End Equipment Market Revenue Share (%), by Type 2024 & 2032
- Figure 102: Rest of the Asia Pacific Semiconductor Back-End Equipment Market Volume Share (%), by Type 2024 & 2032
- Figure 103: Rest of the Asia Pacific Semiconductor Back-End Equipment Market Revenue (Million), by End-Use Industry 2024 & 2032
- Figure 104: Rest of the Asia Pacific Semiconductor Back-End Equipment Market Volume (K Unit), by End-Use Industry 2024 & 2032
- Figure 105: Rest of the Asia Pacific Semiconductor Back-End Equipment Market Revenue Share (%), by End-Use Industry 2024 & 2032
- Figure 106: Rest of the Asia Pacific Semiconductor Back-End Equipment Market Volume Share (%), by End-Use Industry 2024 & 2032
- Figure 107: Rest of the Asia Pacific Semiconductor Back-End Equipment Market Revenue (Million), by Country 2024 & 2032
- Figure 108: Rest of the Asia Pacific Semiconductor Back-End Equipment Market Volume (K Unit), by Country 2024 & 2032
- Figure 109: Rest of the Asia Pacific Semiconductor Back-End Equipment Market Revenue Share (%), by Country 2024 & 2032
- Figure 110: Rest of the Asia Pacific Semiconductor Back-End Equipment Market Volume Share (%), by Country 2024 & 2032
- Figure 111: Rest of the World Semiconductor Back-End Equipment Market Revenue (Million), by Type 2024 & 2032
- Figure 112: Rest of the World Semiconductor Back-End Equipment Market Volume (K Unit), by Type 2024 & 2032
- Figure 113: Rest of the World Semiconductor Back-End Equipment Market Revenue Share (%), by Type 2024 & 2032
- Figure 114: Rest of the World Semiconductor Back-End Equipment Market Volume Share (%), by Type 2024 & 2032
- Figure 115: Rest of the World Semiconductor Back-End Equipment Market Revenue (Million), by End-Use Industry 2024 & 2032
- Figure 116: Rest of the World Semiconductor Back-End Equipment Market Volume (K Unit), by End-Use Industry 2024 & 2032
- Figure 117: Rest of the World Semiconductor Back-End Equipment Market Revenue Share (%), by End-Use Industry 2024 & 2032
- Figure 118: Rest of the World Semiconductor Back-End Equipment Market Volume Share (%), by End-Use Industry 2024 & 2032
- Figure 119: Rest of the World Semiconductor Back-End Equipment Market Revenue (Million), by Country 2024 & 2032
- Figure 120: Rest of the World Semiconductor Back-End Equipment Market Volume (K Unit), by Country 2024 & 2032
- Figure 121: Rest of the World Semiconductor Back-End Equipment Market Revenue Share (%), by Country 2024 & 2032
- Figure 122: Rest of the World Semiconductor Back-End Equipment Market Volume Share (%), by Country 2024 & 2032
List of Tables
- Table 1: Global Semiconductor Back-End Equipment Market Revenue Million Forecast, by Region 2019 & 2032
- Table 2: Global Semiconductor Back-End Equipment Market Volume K Unit Forecast, by Region 2019 & 2032
- Table 3: Global Semiconductor Back-End Equipment Market Revenue Million Forecast, by Type 2019 & 2032
- Table 4: Global Semiconductor Back-End Equipment Market Volume K Unit Forecast, by Type 2019 & 2032
- Table 5: Global Semiconductor Back-End Equipment Market Revenue Million Forecast, by End-Use Industry 2019 & 2032
- Table 6: Global Semiconductor Back-End Equipment Market Volume K Unit Forecast, by End-Use Industry 2019 & 2032
- Table 7: Global Semiconductor Back-End Equipment Market Revenue Million Forecast, by Region 2019 & 2032
- Table 8: Global Semiconductor Back-End Equipment Market Volume K Unit Forecast, by Region 2019 & 2032
- Table 9: Global Semiconductor Back-End Equipment Market Revenue Million Forecast, by Country 2019 & 2032
- Table 10: Global Semiconductor Back-End Equipment Market Volume K Unit Forecast, by Country 2019 & 2032
- Table 11: United States Semiconductor Back-End Equipment Market Revenue (Million) Forecast, by Application 2019 & 2032
- Table 12: United States Semiconductor Back-End Equipment Market Volume (K Unit) Forecast, by Application 2019 & 2032
- Table 13: Canada Semiconductor Back-End Equipment Market Revenue (Million) Forecast, by Application 2019 & 2032
- Table 14: Canada Semiconductor Back-End Equipment Market Volume (K Unit) Forecast, by Application 2019 & 2032
- Table 15: Mexico Semiconductor Back-End Equipment Market Revenue (Million) Forecast, by Application 2019 & 2032
- Table 16: Mexico Semiconductor Back-End Equipment Market Volume (K Unit) Forecast, by Application 2019 & 2032
- Table 17: Global Semiconductor Back-End Equipment Market Revenue Million Forecast, by Country 2019 & 2032
- Table 18: Global Semiconductor Back-End Equipment Market Volume K Unit Forecast, by Country 2019 & 2032
- Table 19: Germany Semiconductor Back-End Equipment Market Revenue (Million) Forecast, by Application 2019 & 2032
- Table 20: Germany Semiconductor Back-End Equipment Market Volume (K Unit) Forecast, by Application 2019 & 2032
- Table 21: United Kingdom Semiconductor Back-End Equipment Market Revenue (Million) Forecast, by Application 2019 & 2032
- Table 22: United Kingdom Semiconductor Back-End Equipment Market Volume (K Unit) Forecast, by Application 2019 & 2032
- Table 23: France Semiconductor Back-End Equipment Market Revenue (Million) Forecast, by Application 2019 & 2032
- Table 24: France Semiconductor Back-End Equipment Market Volume (K Unit) Forecast, by Application 2019 & 2032
- Table 25: Spain Semiconductor Back-End Equipment Market Revenue (Million) Forecast, by Application 2019 & 2032
- Table 26: Spain Semiconductor Back-End Equipment Market Volume (K Unit) Forecast, by Application 2019 & 2032
- Table 27: Italy Semiconductor Back-End Equipment Market Revenue (Million) Forecast, by Application 2019 & 2032
- Table 28: Italy Semiconductor Back-End Equipment Market Volume (K Unit) Forecast, by Application 2019 & 2032
- Table 29: Spain Semiconductor Back-End Equipment Market Revenue (Million) Forecast, by Application 2019 & 2032
- Table 30: Spain Semiconductor Back-End Equipment Market Volume (K Unit) Forecast, by Application 2019 & 2032
- Table 31: Belgium Semiconductor Back-End Equipment Market Revenue (Million) Forecast, by Application 2019 & 2032
- Table 32: Belgium Semiconductor Back-End Equipment Market Volume (K Unit) Forecast, by Application 2019 & 2032
- Table 33: Netherland Semiconductor Back-End Equipment Market Revenue (Million) Forecast, by Application 2019 & 2032
- Table 34: Netherland Semiconductor Back-End Equipment Market Volume (K Unit) Forecast, by Application 2019 & 2032
- Table 35: Nordics Semiconductor Back-End Equipment Market Revenue (Million) Forecast, by Application 2019 & 2032
- Table 36: Nordics Semiconductor Back-End Equipment Market Volume (K Unit) Forecast, by Application 2019 & 2032
- Table 37: Rest of Europe Semiconductor Back-End Equipment Market Revenue (Million) Forecast, by Application 2019 & 2032
- Table 38: Rest of Europe Semiconductor Back-End Equipment Market Volume (K Unit) Forecast, by Application 2019 & 2032
- Table 39: Global Semiconductor Back-End Equipment Market Revenue Million Forecast, by Country 2019 & 2032
- Table 40: Global Semiconductor Back-End Equipment Market Volume K Unit Forecast, by Country 2019 & 2032
- Table 41: China Semiconductor Back-End Equipment Market Revenue (Million) Forecast, by Application 2019 & 2032
- Table 42: China Semiconductor Back-End Equipment Market Volume (K Unit) Forecast, by Application 2019 & 2032
- Table 43: Japan Semiconductor Back-End Equipment Market Revenue (Million) Forecast, by Application 2019 & 2032
- Table 44: Japan Semiconductor Back-End Equipment Market Volume (K Unit) Forecast, by Application 2019 & 2032
- Table 45: India Semiconductor Back-End Equipment Market Revenue (Million) Forecast, by Application 2019 & 2032
- Table 46: India Semiconductor Back-End Equipment Market Volume (K Unit) Forecast, by Application 2019 & 2032
- Table 47: South Korea Semiconductor Back-End Equipment Market Revenue (Million) Forecast, by Application 2019 & 2032
- Table 48: South Korea Semiconductor Back-End Equipment Market Volume (K Unit) Forecast, by Application 2019 & 2032
- Table 49: Southeast Asia Semiconductor Back-End Equipment Market Revenue (Million) Forecast, by Application 2019 & 2032
- Table 50: Southeast Asia Semiconductor Back-End Equipment Market Volume (K Unit) Forecast, by Application 2019 & 2032
- Table 51: Australia Semiconductor Back-End Equipment Market Revenue (Million) Forecast, by Application 2019 & 2032
- Table 52: Australia Semiconductor Back-End Equipment Market Volume (K Unit) Forecast, by Application 2019 & 2032
- Table 53: Indonesia Semiconductor Back-End Equipment Market Revenue (Million) Forecast, by Application 2019 & 2032
- Table 54: Indonesia Semiconductor Back-End Equipment Market Volume (K Unit) Forecast, by Application 2019 & 2032
- Table 55: Phillipes Semiconductor Back-End Equipment Market Revenue (Million) Forecast, by Application 2019 & 2032
- Table 56: Phillipes Semiconductor Back-End Equipment Market Volume (K Unit) Forecast, by Application 2019 & 2032
- Table 57: Singapore Semiconductor Back-End Equipment Market Revenue (Million) Forecast, by Application 2019 & 2032
- Table 58: Singapore Semiconductor Back-End Equipment Market Volume (K Unit) Forecast, by Application 2019 & 2032
- Table 59: Thailandc Semiconductor Back-End Equipment Market Revenue (Million) Forecast, by Application 2019 & 2032
- Table 60: Thailandc Semiconductor Back-End Equipment Market Volume (K Unit) Forecast, by Application 2019 & 2032
- Table 61: Rest of Asia Pacific Semiconductor Back-End Equipment Market Revenue (Million) Forecast, by Application 2019 & 2032
- Table 62: Rest of Asia Pacific Semiconductor Back-End Equipment Market Volume (K Unit) Forecast, by Application 2019 & 2032
- Table 63: Global Semiconductor Back-End Equipment Market Revenue Million Forecast, by Country 2019 & 2032
- Table 64: Global Semiconductor Back-End Equipment Market Volume K Unit Forecast, by Country 2019 & 2032
- Table 65: Brazil Semiconductor Back-End Equipment Market Revenue (Million) Forecast, by Application 2019 & 2032
- Table 66: Brazil Semiconductor Back-End Equipment Market Volume (K Unit) Forecast, by Application 2019 & 2032
- Table 67: Argentina Semiconductor Back-End Equipment Market Revenue (Million) Forecast, by Application 2019 & 2032
- Table 68: Argentina Semiconductor Back-End Equipment Market Volume (K Unit) Forecast, by Application 2019 & 2032
- Table 69: Peru Semiconductor Back-End Equipment Market Revenue (Million) Forecast, by Application 2019 & 2032
- Table 70: Peru Semiconductor Back-End Equipment Market Volume (K Unit) Forecast, by Application 2019 & 2032
- Table 71: Chile Semiconductor Back-End Equipment Market Revenue (Million) Forecast, by Application 2019 & 2032
- Table 72: Chile Semiconductor Back-End Equipment Market Volume (K Unit) Forecast, by Application 2019 & 2032
- Table 73: Colombia Semiconductor Back-End Equipment Market Revenue (Million) Forecast, by Application 2019 & 2032
- Table 74: Colombia Semiconductor Back-End Equipment Market Volume (K Unit) Forecast, by Application 2019 & 2032
- Table 75: Ecuador Semiconductor Back-End Equipment Market Revenue (Million) Forecast, by Application 2019 & 2032
- Table 76: Ecuador Semiconductor Back-End Equipment Market Volume (K Unit) Forecast, by Application 2019 & 2032
- Table 77: Venezuela Semiconductor Back-End Equipment Market Revenue (Million) Forecast, by Application 2019 & 2032
- Table 78: Venezuela Semiconductor Back-End Equipment Market Volume (K Unit) Forecast, by Application 2019 & 2032
- Table 79: Rest of South America Semiconductor Back-End Equipment Market Revenue (Million) Forecast, by Application 2019 & 2032
- Table 80: Rest of South America Semiconductor Back-End Equipment Market Volume (K Unit) Forecast, by Application 2019 & 2032
- Table 81: Global Semiconductor Back-End Equipment Market Revenue Million Forecast, by Country 2019 & 2032
- Table 82: Global Semiconductor Back-End Equipment Market Volume K Unit Forecast, by Country 2019 & 2032
- Table 83: United States Semiconductor Back-End Equipment Market Revenue (Million) Forecast, by Application 2019 & 2032
- Table 84: United States Semiconductor Back-End Equipment Market Volume (K Unit) Forecast, by Application 2019 & 2032
- Table 85: Canada Semiconductor Back-End Equipment Market Revenue (Million) Forecast, by Application 2019 & 2032
- Table 86: Canada Semiconductor Back-End Equipment Market Volume (K Unit) Forecast, by Application 2019 & 2032
- Table 87: Mexico Semiconductor Back-End Equipment Market Revenue (Million) Forecast, by Application 2019 & 2032
- Table 88: Mexico Semiconductor Back-End Equipment Market Volume (K Unit) Forecast, by Application 2019 & 2032
- Table 89: Global Semiconductor Back-End Equipment Market Revenue Million Forecast, by Country 2019 & 2032
- Table 90: Global Semiconductor Back-End Equipment Market Volume K Unit Forecast, by Country 2019 & 2032
- Table 91: United Arab Emirates Semiconductor Back-End Equipment Market Revenue (Million) Forecast, by Application 2019 & 2032
- Table 92: United Arab Emirates Semiconductor Back-End Equipment Market Volume (K Unit) Forecast, by Application 2019 & 2032
- Table 93: Saudi Arabia Semiconductor Back-End Equipment Market Revenue (Million) Forecast, by Application 2019 & 2032
- Table 94: Saudi Arabia Semiconductor Back-End Equipment Market Volume (K Unit) Forecast, by Application 2019 & 2032
- Table 95: South Africa Semiconductor Back-End Equipment Market Revenue (Million) Forecast, by Application 2019 & 2032
- Table 96: South Africa Semiconductor Back-End Equipment Market Volume (K Unit) Forecast, by Application 2019 & 2032
- Table 97: Rest of Middle East and Africa Semiconductor Back-End Equipment Market Revenue (Million) Forecast, by Application 2019 & 2032
- Table 98: Rest of Middle East and Africa Semiconductor Back-End Equipment Market Volume (K Unit) Forecast, by Application 2019 & 2032
- Table 99: Global Semiconductor Back-End Equipment Market Revenue Million Forecast, by Type 2019 & 2032
- Table 100: Global Semiconductor Back-End Equipment Market Volume K Unit Forecast, by Type 2019 & 2032
- Table 101: Global Semiconductor Back-End Equipment Market Revenue Million Forecast, by End-Use Industry 2019 & 2032
- Table 102: Global Semiconductor Back-End Equipment Market Volume K Unit Forecast, by End-Use Industry 2019 & 2032
- Table 103: Global Semiconductor Back-End Equipment Market Revenue Million Forecast, by Country 2019 & 2032
- Table 104: Global Semiconductor Back-End Equipment Market Volume K Unit Forecast, by Country 2019 & 2032
- Table 105: Global Semiconductor Back-End Equipment Market Revenue Million Forecast, by Type 2019 & 2032
- Table 106: Global Semiconductor Back-End Equipment Market Volume K Unit Forecast, by Type 2019 & 2032
- Table 107: Global Semiconductor Back-End Equipment Market Revenue Million Forecast, by End-Use Industry 2019 & 2032
- Table 108: Global Semiconductor Back-End Equipment Market Volume K Unit Forecast, by End-Use Industry 2019 & 2032
- Table 109: Global Semiconductor Back-End Equipment Market Revenue Million Forecast, by Country 2019 & 2032
- Table 110: Global Semiconductor Back-End Equipment Market Volume K Unit Forecast, by Country 2019 & 2032
- Table 111: Global Semiconductor Back-End Equipment Market Revenue Million Forecast, by Type 2019 & 2032
- Table 112: Global Semiconductor Back-End Equipment Market Volume K Unit Forecast, by Type 2019 & 2032
- Table 113: Global Semiconductor Back-End Equipment Market Revenue Million Forecast, by End-Use Industry 2019 & 2032
- Table 114: Global Semiconductor Back-End Equipment Market Volume K Unit Forecast, by End-Use Industry 2019 & 2032
- Table 115: Global Semiconductor Back-End Equipment Market Revenue Million Forecast, by Country 2019 & 2032
- Table 116: Global Semiconductor Back-End Equipment Market Volume K Unit Forecast, by Country 2019 & 2032
- Table 117: Global Semiconductor Back-End Equipment Market Revenue Million Forecast, by Type 2019 & 2032
- Table 118: Global Semiconductor Back-End Equipment Market Volume K Unit Forecast, by Type 2019 & 2032
- Table 119: Global Semiconductor Back-End Equipment Market Revenue Million Forecast, by End-Use Industry 2019 & 2032
- Table 120: Global Semiconductor Back-End Equipment Market Volume K Unit Forecast, by End-Use Industry 2019 & 2032
- Table 121: Global Semiconductor Back-End Equipment Market Revenue Million Forecast, by Country 2019 & 2032
- Table 122: Global Semiconductor Back-End Equipment Market Volume K Unit Forecast, by Country 2019 & 2032
- Table 123: Global Semiconductor Back-End Equipment Market Revenue Million Forecast, by Type 2019 & 2032
- Table 124: Global Semiconductor Back-End Equipment Market Volume K Unit Forecast, by Type 2019 & 2032
- Table 125: Global Semiconductor Back-End Equipment Market Revenue Million Forecast, by End-Use Industry 2019 & 2032
- Table 126: Global Semiconductor Back-End Equipment Market Volume K Unit Forecast, by End-Use Industry 2019 & 2032
- Table 127: Global Semiconductor Back-End Equipment Market Revenue Million Forecast, by Country 2019 & 2032
- Table 128: Global Semiconductor Back-End Equipment Market Volume K Unit Forecast, by Country 2019 & 2032
- Table 129: Global Semiconductor Back-End Equipment Market Revenue Million Forecast, by Type 2019 & 2032
- Table 130: Global Semiconductor Back-End Equipment Market Volume K Unit Forecast, by Type 2019 & 2032
- Table 131: Global Semiconductor Back-End Equipment Market Revenue Million Forecast, by End-Use Industry 2019 & 2032
- Table 132: Global Semiconductor Back-End Equipment Market Volume K Unit Forecast, by End-Use Industry 2019 & 2032
- Table 133: Global Semiconductor Back-End Equipment Market Revenue Million Forecast, by Country 2019 & 2032
- Table 134: Global Semiconductor Back-End Equipment Market Volume K Unit Forecast, by Country 2019 & 2032
- Table 135: Global Semiconductor Back-End Equipment Market Revenue Million Forecast, by Type 2019 & 2032
- Table 136: Global Semiconductor Back-End Equipment Market Volume K Unit Forecast, by Type 2019 & 2032
- Table 137: Global Semiconductor Back-End Equipment Market Revenue Million Forecast, by End-Use Industry 2019 & 2032
- Table 138: Global Semiconductor Back-End Equipment Market Volume K Unit Forecast, by End-Use Industry 2019 & 2032
- Table 139: Global Semiconductor Back-End Equipment Market Revenue Million Forecast, by Country 2019 & 2032
- Table 140: Global Semiconductor Back-End Equipment Market Volume K Unit Forecast, by Country 2019 & 2032
- Table 141: Global Semiconductor Back-End Equipment Market Revenue Million Forecast, by Type 2019 & 2032
- Table 142: Global Semiconductor Back-End Equipment Market Volume K Unit Forecast, by Type 2019 & 2032
- Table 143: Global Semiconductor Back-End Equipment Market Revenue Million Forecast, by End-Use Industry 2019 & 2032
- Table 144: Global Semiconductor Back-End Equipment Market Volume K Unit Forecast, by End-Use Industry 2019 & 2032
- Table 145: Global Semiconductor Back-End Equipment Market Revenue Million Forecast, by Country 2019 & 2032
- Table 146: Global Semiconductor Back-End Equipment Market Volume K Unit Forecast, by Country 2019 & 2032
Frequently Asked Questions
1. What is the projected Compound Annual Growth Rate (CAGR) of the Semiconductor Back-End Equipment Market?
The projected CAGR is approximately 8.75%.
2. Which companies are prominent players in the Semiconductor Back-End Equipment Market?
Key companies in the market include Advantest Corporation, KLA Corporation, Teradyne Inc, Nordson Corporatio, Applied Materials Inc, ASML Holding N V, Screen Holdings Co Ltd, Onto Innovation Inc, Tokyo Electron Limited, LAM Research Corporation.
3. What are the main segments of the Semiconductor Back-End Equipment Market?
The market segments include Type, End-Use Industry.
4. Can you provide details about the market size?
The market size is estimated to be USD 18.83 Million as of 2022.
5. What are some drivers contributing to market growth?
Increasing Demand for Semiconductors in Electric and Hybrid Vehicles; Demand for Setting Up New Foundries (International Chip Shortage).
6. What are the notable trends driving market growth?
Assembly and Packaging Segment is Expected to Witness Significant Growth.
7. Are there any restraints impacting market growth?
High Setup Costs; Constant Evolution of Products Influencing Demand.
8. Can you provide examples of recent developments in the market?
December 2023: Tokyo Electron announced that it has developed an Extreme Laser Lift Off (XLO) technology that contributes to innovations in 3D integration of advanced semiconductor devices adopting permanent wafer bonding. This new technology for two permanently bonded silicon wafers uses a laser to separate the top silicon substrate from the bottom substrate with an integrated circuit layer.
9. What pricing options are available for accessing the report?
Pricing options include single-user, multi-user, and enterprise licenses priced at USD 4750, USD 5250, and USD 8750 respectively.
10. Is the market size provided in terms of value or volume?
The market size is provided in terms of value, measured in Million and volume, measured in K Unit.
11. Are there any specific market keywords associated with the report?
Yes, the market keyword associated with the report is "Semiconductor Back-End Equipment Market," which aids in identifying and referencing the specific market segment covered.
12. How do I determine which pricing option suits my needs best?
The pricing options vary based on user requirements and access needs. Individual users may opt for single-user licenses, while businesses requiring broader access may choose multi-user or enterprise licenses for cost-effective access to the report.
13. Are there any additional resources or data provided in the Semiconductor Back-End Equipment Market report?
While the report offers comprehensive insights, it's advisable to review the specific contents or supplementary materials provided to ascertain if additional resources or data are available.
14. How can I stay updated on further developments or reports in the Semiconductor Back-End Equipment Market?
To stay informed about further developments, trends, and reports in the Semiconductor Back-End Equipment Market, consider subscribing to industry newsletters, following relevant companies and organizations, or regularly checking reputable industry news sources and publications.
Methodology
Step 1 - Identification of Relevant Samples Size from Population Database


Step 2 - Approaches for Defining Global Market Size (Value, Volume* & Price*)

Note*: In applicable scenarios
Step 3 - Data Sources
Primary Research
- Web Analytics
- Survey Reports
- Research Institute
- Latest Research Reports
- Opinion Leaders
Secondary Research
- Annual Reports
- White Paper
- Latest Press Release
- Industry Association
- Paid Database
- Investor Presentations

Step 4 - Data Triangulation
Involves using different sources of information in order to increase the validity of a study
These sources are likely to be stakeholders in a program - participants, other researchers, program staff, other community members, and so on.
Then we put all data in single framework & apply various statistical tools to find out the dynamic on the market.
During the analysis stage, feedback from the stakeholder groups would be compared to determine areas of agreement as well as areas of divergence


