

Key Insights
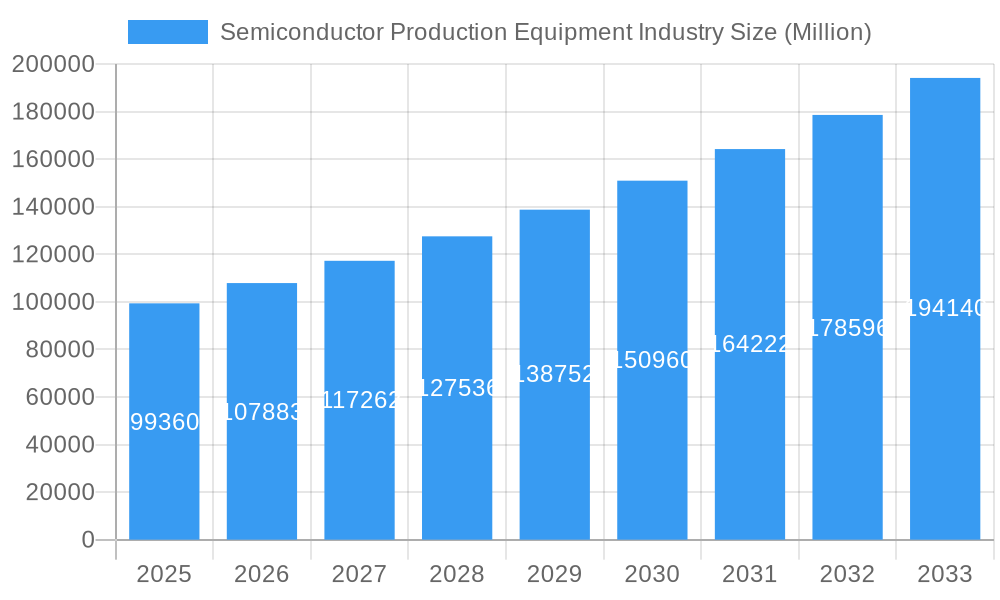
The semiconductor production equipment market, valued at $99.36 billion in 2025, is projected to experience robust growth, driven by the increasing demand for advanced semiconductor devices across various end-user industries. The Compound Annual Growth Rate (CAGR) of 8.65% from 2025 to 2033 signifies a significant expansion, fueled by several key factors. Advancements in miniaturization technologies, particularly in lithography and etching equipment, are crucial drivers. The rising adoption of 5G technology, the proliferation of IoT devices, and the burgeoning automotive electronics sector are significantly boosting demand. Furthermore, the growth of high-performance computing (HPC) and artificial intelligence (AI) applications necessitates more sophisticated and efficient semiconductor production equipment. While supply chain disruptions and geopolitical uncertainties present some restraints, the long-term outlook for the market remains positive, with continuous innovation and substantial investments in research and development mitigating these challenges. The market is segmented by equipment type (lithography, etching, deposition, and others) and end-user industry (semiconductor fabrication plants and semiconductor electronics manufacturing). Key players, including Applied Materials, ASML, Tokyo Electron, and Lam Research, are actively competing through technological advancements and strategic partnerships to capture market share. Geographic expansion, particularly in Asia-Pacific, is expected to further contribute to market growth.
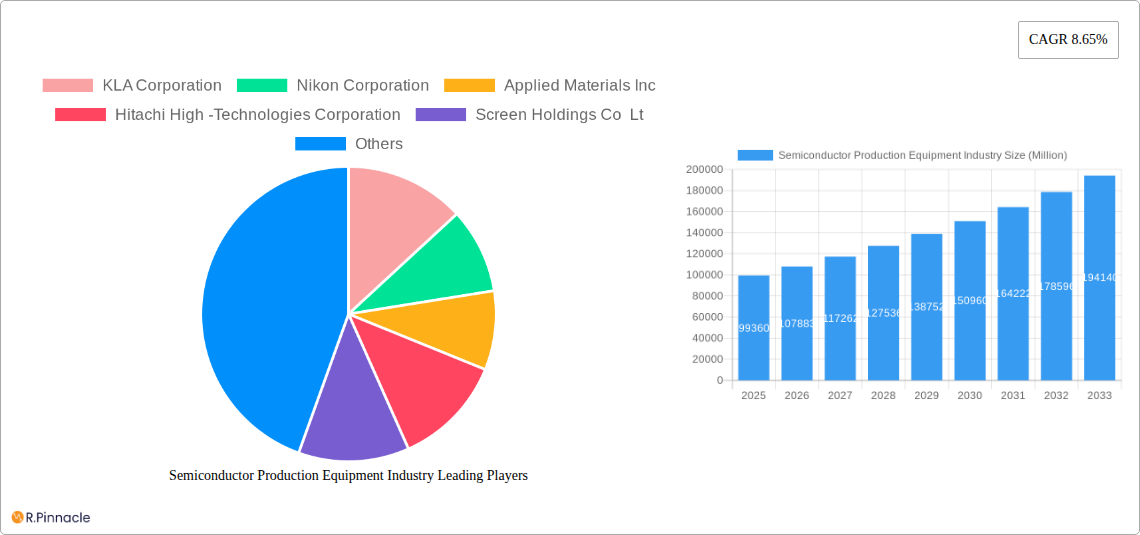
Semiconductor Production Equipment Industry Market Size (In Billion)
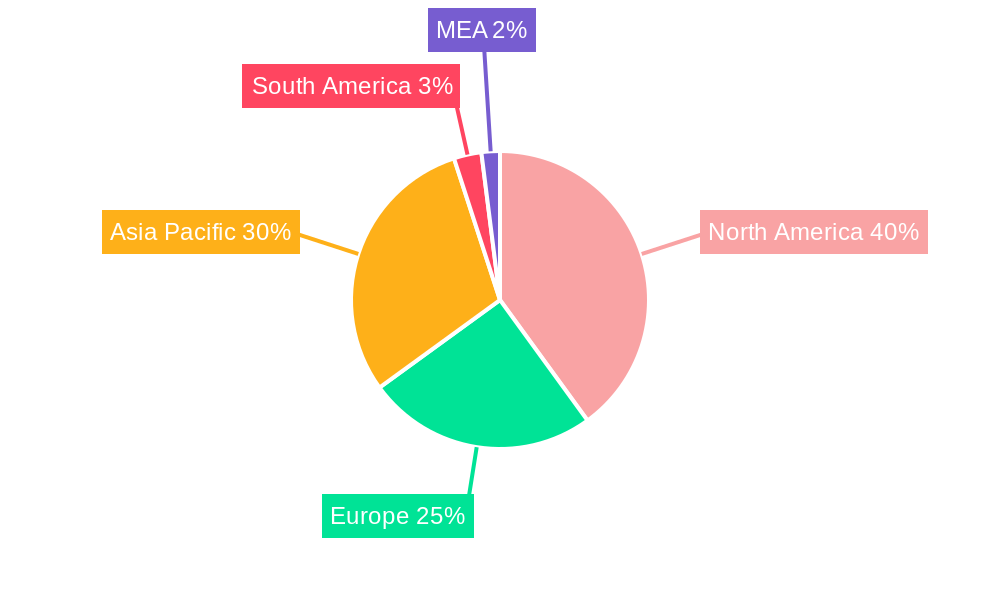
The geographical distribution of the market reflects the concentration of semiconductor manufacturing hubs globally. North America and Asia-Pacific are expected to dominate the market, followed by Europe. Within Asia-Pacific, China, South Korea, Taiwan, and Japan are key growth drivers. The increasing government initiatives and investments in domestic semiconductor manufacturing capabilities in various regions are expected to propel market expansion. Competition among major players is intense, resulting in continuous technological advancements and price pressures. However, the highly specialized nature of the equipment and significant barriers to entry create a stable market structure with leading players maintaining a strong presence. Future growth will depend on overcoming challenges related to talent acquisition, energy consumption, and environmental sustainability concerns associated with semiconductor production. The integration of advanced technologies like AI and machine learning into semiconductor production equipment is likely to shape the future market landscape.
Semiconductor Production Equipment Industry Company Market Share
Semiconductor Production Equipment Industry Market Report: 2019-2033
This comprehensive report provides an in-depth analysis of the Semiconductor Production Equipment industry, offering invaluable insights for industry professionals, investors, and strategic planners. Covering the period 2019-2033, with a focus on 2025, this report meticulously examines market dynamics, technological advancements, and competitive landscapes to forecast future growth and identify lucrative opportunities. The global market is projected to reach xx Million by 2033.
Semiconductor Production Equipment Industry Market Structure & Innovation Trends
The Semiconductor Production Equipment market exhibits a moderately concentrated structure, with key players like Applied Materials, ASML, Tokyo Electron, and Lam Research commanding significant market share. Market share dynamics are influenced by continuous innovation, particularly in advanced lithography, etching, and deposition technologies. The industry is characterized by high R&D expenditure, a complex regulatory landscape (including export controls and trade restrictions), and substantial M&A activity. Recent mergers and acquisitions have involved significant deal values, exceeding xx Million in some cases.
- Market Concentration: High, with top 5 players controlling approximately xx% of the market.
- Innovation Drivers: Miniaturization of semiconductor devices, increasing demand for high-performance computing, and the rise of 5G and AI.
- Regulatory Frameworks: Stringent environmental regulations and export controls influence manufacturing and supply chains.
- Product Substitutes: Limited viable substitutes exist for specialized equipment.
- End-User Demographics: Primarily driven by major semiconductor manufacturers and fabs, concentrated in specific geographical regions.
- M&A Activity: Significant activity in recent years, driven by consolidation and access to key technologies, with deal values exceeding xx Million in several instances.
Semiconductor Production Equipment Industry Market Dynamics & Trends
The Semiconductor Production Equipment market is experiencing robust growth, driven by several factors. The increasing demand for advanced semiconductor devices across various end-user industries fuels the market expansion. Technological advancements, such as EUV lithography and advanced packaging techniques, are key growth drivers. Competitive dynamics are intense, with leading players investing heavily in R&D to maintain their technological edge. The market is projected to achieve a CAGR of xx% during the forecast period (2025-2033), with significant market penetration in emerging economies. Specific technological disruptions include the shift towards high-NA EUV lithography and the development of next-generation etching and deposition techniques. Consumer preferences for faster, smaller, and more energy-efficient devices indirectly drive demand for advanced equipment.
Dominant Regions & Segments in Semiconductor Production Equipment Industry
The Asia-Pacific region, specifically Taiwan, South Korea, and China, dominates the Semiconductor Production Equipment market due to a high concentration of semiconductor fabrication plants and robust government support for the industry. Within equipment types, Lithography Equipment holds the largest market share, followed by Etching and Deposition equipment.
- Key Drivers for Asia-Pacific Dominance:
- Substantial investments in semiconductor manufacturing facilities.
- Favorable government policies and incentives.
- Growing domestic demand for electronics.
- By Type: Lithography Equipment is the leading segment due to its critical role in chip fabrication. Etching and Deposition equipment are also significant segments, with consistent growth. The "Other Equipment Types" segment encompasses various supporting technologies and is expected to exhibit moderate growth.
- By End-user Industry: Semiconductor Fabrication Plants constitute the largest end-user segment, driving market growth. Semiconductor Electronics Manufacturing contributes significantly.
Semiconductor Production Equipment Industry Product Innovations
Recent product innovations focus on addressing the challenges of producing increasingly smaller and more complex chips. Advanced lithography systems, using EUV and high-NA EUV technologies, are at the forefront of innovation, alongside improvements in etching and deposition equipment for enhanced precision and throughput. These advancements offer significant competitive advantages by enabling the production of higher-performing chips with improved yield and reduced production costs. The market fit is excellent, aligning perfectly with the industry's ongoing drive towards miniaturization and enhanced performance.
Report Scope & Segmentation Analysis
This report segments the Semiconductor Production Equipment market by Type (Lithography Equipment, Etching Equipment, Deposition Equipment, Other Equipment Types) and by End-user Industry (Semiconductor Fabrication Plant, Semiconductor Electronics Manufacturing). Each segment’s market size, growth projections, and competitive dynamics are analyzed. The Lithography equipment segment is projected to witness significant growth driven by the increasing demand for advanced node chips. The Etching and Deposition equipment segments are expected to experience steady growth, supported by continuous improvements in process technologies. The "Other" segment will also see moderate growth due to the rising need for supporting equipment. The Semiconductor Fabrication Plant segment dominates the end-user industry landscape due to its large-scale production needs.
Key Drivers of Semiconductor Production Equipment Industry Growth
Several key factors drive the growth of the Semiconductor Production Equipment industry. The increasing demand for advanced semiconductor chips in various applications, including smartphones, automobiles, and high-performance computing, is a primary driver. Technological advancements, such as EUV lithography and 3D packaging, are pushing the boundaries of chip miniaturization and performance, stimulating demand for sophisticated equipment. Furthermore, government support and investments in semiconductor manufacturing capacity in various regions are boosting industry growth.
Challenges in the Semiconductor Production Equipment Industry Sector
The Semiconductor Production Equipment industry faces several challenges. These include high capital expenditure requirements for new equipment, supply chain disruptions affecting the availability of critical components, intense competition among leading players, and the complexity of integrating new technologies into existing manufacturing processes. These factors can influence production costs and timelines, impacting profitability. Regulatory hurdles in various countries can also pose significant challenges.
Emerging Opportunities in Semiconductor Production Equipment Industry
Emerging opportunities exist in areas such as advanced packaging technologies, the development of equipment for producing chips with increasingly smaller nodes, and the growth of specialized semiconductor markets (e.g., automotive semiconductors, AI chips). The industry is expected to witness increasing demand for equipment that enhances production efficiency, reduces manufacturing costs, and addresses environmental concerns. These opportunities require continued innovation and strategic partnerships.
Leading Players in the Semiconductor Production Equipment Industry Market
Key Developments in Semiconductor Production Equipment Industry
- December 2023: Tokyo Electron launched Ulucus G, a wafer thinning system improving silicon wafer quality and reducing workforce needs in 300mm wafer fabrication.
- February 2024: Applied Materials unveiled new products for 2nm and below process nodes, addressing challenges in EUV and high-NA EUV patterning.
Future Outlook for Semiconductor Production Equipment Industry Market
The Semiconductor Production Equipment market is poised for continued growth, driven by ongoing advancements in semiconductor technology and the rising demand for high-performance computing and other applications. Strategic partnerships, technological innovations, and expansion into new markets will be crucial for companies to capitalize on future opportunities. The industry's focus on sustainability and reduced environmental impact will also shape future market trends.
Semiconductor Production Equipment Industry Segmentation
-
1. Type
- 1.1. Lithography Equipment
- 1.2. Etching Equipment
- 1.3. Deposition Equipment
- 1.4. Other Equipment Types
-
2. End-user Industry
- 2.1. Semiconductor Fabrication Plant
- 2.2. Semiconductor Electronics Manufacturing
Semiconductor Production Equipment Industry Segmentation By Geography
- 1. United States
- 2. Europe
- 3. China
- 4. South Korea
- 5. Taiwan
- 6. Japan
- 7. Latin America
- 8. Middle East and Africa
Semiconductor Production Equipment Industry Regional Market Share
Geographic Coverage of Semiconductor Production Equipment Industry
Semiconductor Production Equipment Industry REPORT HIGHLIGHTS
| Aspects | Details |
|---|---|
| Study Period | 2020-2034 |
| Base Year | 2025 |
| Estimated Year | 2026 |
| Forecast Period | 2026-2034 |
| Historical Period | 2020-2025 |
| Growth Rate | CAGR of 8.65% from 2020-2034 |
| Segmentation |
|
Table of Contents
- 1. Introduction
- 1.1. Research Scope
- 1.2. Market Segmentation
- 1.3. Research Objective
- 1.4. Definitions and Assumptions
- 2. Executive Summary
- 2.1. Market Snapshot
- 3. Market Dynamics
- 3.1. Market Drivers
- 3.2. Market Restrains
- 3.3. Market Trends
- 3.4. Market Opportunities
- 4. Market Factor Analysis
- 4.1. Porters Five Forces
- 4.1.1. Bargaining Power of Suppliers
- 4.1.2. Bargaining Power of Buyers
- 4.1.3. Threat of New Entrants
- 4.1.4. Threat of Substitutes
- 4.1.5. Competitive Rivalry
- 4.2. PESTEL analysis
- 4.3. BCG Analysis
- 4.3.1. Stars (High Growth, High Market Share)
- 4.3.2. Cash Cows (Low Growth, High Market Share)
- 4.3.3. Question Mark (High Growth, Low Market Share)
- 4.3.4. Dogs (Low Growth, Low Market Share)
- 4.4. Ansoff Matrix Analysis
- 4.5. Supply Chain Analysis
- 4.6. Regulatory Landscape
- 4.7. Current Market Potential and Opportunity Assessment (TAM–SAM–SOM Framework)
- 4.8. PRI Analyst Note
- 4.1. Porters Five Forces
- 5. Market Analysis, Insights and Forecast 2021-2033
- 5.1. Market Analysis, Insights and Forecast - by Type
- 5.1.1. Lithography Equipment
- 5.1.2. Etching Equipment
- 5.1.3. Deposition Equipment
- 5.1.4. Other Equipment Types
- 5.2. Market Analysis, Insights and Forecast - by End-user Industry
- 5.2.1. Semiconductor Fabrication Plant
- 5.2.2. Semiconductor Electronics Manufacturing
- 5.3. Market Analysis, Insights and Forecast - by Region
- 5.3.1. United States
- 5.3.2. Europe
- 5.3.3. China
- 5.3.4. South Korea
- 5.3.5. Taiwan
- 5.3.6. Japan
- 5.3.7. Latin America
- 5.3.8. Middle East and Africa
- 5.1. Market Analysis, Insights and Forecast - by Type
- 6. Global Semiconductor Production Equipment Industry Analysis, Insights and Forecast, 2021-2033
- 6.1. Market Analysis, Insights and Forecast - by Type
- 6.1.1. Lithography Equipment
- 6.1.2. Etching Equipment
- 6.1.3. Deposition Equipment
- 6.1.4. Other Equipment Types
- 6.2. Market Analysis, Insights and Forecast - by End-user Industry
- 6.2.1. Semiconductor Fabrication Plant
- 6.2.2. Semiconductor Electronics Manufacturing
- 6.1. Market Analysis, Insights and Forecast - by Type
- 7. United States Semiconductor Production Equipment Industry Analysis, Insights and Forecast, 2020-2032
- 7.1. Market Analysis, Insights and Forecast - by Type
- 7.1.1. Lithography Equipment
- 7.1.2. Etching Equipment
- 7.1.3. Deposition Equipment
- 7.1.4. Other Equipment Types
- 7.2. Market Analysis, Insights and Forecast - by End-user Industry
- 7.2.1. Semiconductor Fabrication Plant
- 7.2.2. Semiconductor Electronics Manufacturing
- 7.1. Market Analysis, Insights and Forecast - by Type
- 8. Europe Semiconductor Production Equipment Industry Analysis, Insights and Forecast, 2020-2032
- 8.1. Market Analysis, Insights and Forecast - by Type
- 8.1.1. Lithography Equipment
- 8.1.2. Etching Equipment
- 8.1.3. Deposition Equipment
- 8.1.4. Other Equipment Types
- 8.2. Market Analysis, Insights and Forecast - by End-user Industry
- 8.2.1. Semiconductor Fabrication Plant
- 8.2.2. Semiconductor Electronics Manufacturing
- 8.1. Market Analysis, Insights and Forecast - by Type
- 9. China Semiconductor Production Equipment Industry Analysis, Insights and Forecast, 2020-2032
- 9.1. Market Analysis, Insights and Forecast - by Type
- 9.1.1. Lithography Equipment
- 9.1.2. Etching Equipment
- 9.1.3. Deposition Equipment
- 9.1.4. Other Equipment Types
- 9.2. Market Analysis, Insights and Forecast - by End-user Industry
- 9.2.1. Semiconductor Fabrication Plant
- 9.2.2. Semiconductor Electronics Manufacturing
- 9.1. Market Analysis, Insights and Forecast - by Type
- 10. South Korea Semiconductor Production Equipment Industry Analysis, Insights and Forecast, 2020-2032
- 10.1. Market Analysis, Insights and Forecast - by Type
- 10.1.1. Lithography Equipment
- 10.1.2. Etching Equipment
- 10.1.3. Deposition Equipment
- 10.1.4. Other Equipment Types
- 10.2. Market Analysis, Insights and Forecast - by End-user Industry
- 10.2.1. Semiconductor Fabrication Plant
- 10.2.2. Semiconductor Electronics Manufacturing
- 10.1. Market Analysis, Insights and Forecast - by Type
- 11. Taiwan Semiconductor Production Equipment Industry Analysis, Insights and Forecast, 2020-2032
- 11.1. Market Analysis, Insights and Forecast - by Type
- 11.1.1. Lithography Equipment
- 11.1.2. Etching Equipment
- 11.1.3. Deposition Equipment
- 11.1.4. Other Equipment Types
- 11.2. Market Analysis, Insights and Forecast - by End-user Industry
- 11.2.1. Semiconductor Fabrication Plant
- 11.2.2. Semiconductor Electronics Manufacturing
- 11.1. Market Analysis, Insights and Forecast - by Type
- 12. Japan Semiconductor Production Equipment Industry Analysis, Insights and Forecast, 2020-2032
- 12.1. Market Analysis, Insights and Forecast - by Type
- 12.1.1. Lithography Equipment
- 12.1.2. Etching Equipment
- 12.1.3. Deposition Equipment
- 12.1.4. Other Equipment Types
- 12.2. Market Analysis, Insights and Forecast - by End-user Industry
- 12.2.1. Semiconductor Fabrication Plant
- 12.2.2. Semiconductor Electronics Manufacturing
- 12.1. Market Analysis, Insights and Forecast - by Type
- 13. Latin America Semiconductor Production Equipment Industry Analysis, Insights and Forecast, 2020-2032
- 13.1. Market Analysis, Insights and Forecast - by Type
- 13.1.1. Lithography Equipment
- 13.1.2. Etching Equipment
- 13.1.3. Deposition Equipment
- 13.1.4. Other Equipment Types
- 13.2. Market Analysis, Insights and Forecast - by End-user Industry
- 13.2.1. Semiconductor Fabrication Plant
- 13.2.2. Semiconductor Electronics Manufacturing
- 13.1. Market Analysis, Insights and Forecast - by Type
- 14. Middle East and Africa Semiconductor Production Equipment Industry Analysis, Insights and Forecast, 2020-2032
- 14.1. Market Analysis, Insights and Forecast - by Type
- 14.1.1. Lithography Equipment
- 14.1.2. Etching Equipment
- 14.1.3. Deposition Equipment
- 14.1.4. Other Equipment Types
- 14.2. Market Analysis, Insights and Forecast - by End-user Industry
- 14.2.1. Semiconductor Fabrication Plant
- 14.2.2. Semiconductor Electronics Manufacturing
- 14.1. Market Analysis, Insights and Forecast - by Type
- 15. Competitive Analysis
- 15.1. Company Profiles
- 15.1.1 KLA Corporation
- 15.1.1.1. Company Overview
- 15.1.1.2. Products
- 15.1.1.3. Company Financials
- 15.1.1.4. SWOT Analysis
- 15.1.2 Nikon Corporation
- 15.1.2.1. Company Overview
- 15.1.2.2. Products
- 15.1.2.3. Company Financials
- 15.1.2.4. SWOT Analysis
- 15.1.3 Applied Materials Inc
- 15.1.3.1. Company Overview
- 15.1.3.2. Products
- 15.1.3.3. Company Financials
- 15.1.3.4. SWOT Analysis
- 15.1.4 Hitachi High -Technologies Corporation
- 15.1.4.1. Company Overview
- 15.1.4.2. Products
- 15.1.4.3. Company Financials
- 15.1.4.4. SWOT Analysis
- 15.1.5 Screen Holdings Co Lt
- 15.1.5.1. Company Overview
- 15.1.5.2. Products
- 15.1.5.3. Company Financials
- 15.1.5.4. SWOT Analysis
- 15.1.6 Plasma Therm
- 15.1.6.1. Company Overview
- 15.1.6.2. Products
- 15.1.6.3. Company Financials
- 15.1.6.4. SWOT Analysis
- 15.1.7 Tokyo Electron Limited
- 15.1.7.1. Company Overview
- 15.1.7.2. Products
- 15.1.7.3. Company Financials
- 15.1.7.4. SWOT Analysis
- 15.1.8 ASML Holding NV
- 15.1.8.1. Company Overview
- 15.1.8.2. Products
- 15.1.8.3. Company Financials
- 15.1.8.4. SWOT Analysis
- 15.1.9 Carl Zeiss AG
- 15.1.9.1. Company Overview
- 15.1.9.2. Products
- 15.1.9.3. Company Financials
- 15.1.9.4. SWOT Analysis
- 15.1.10 LAM Research Corporation
- 15.1.10.1. Company Overview
- 15.1.10.2. Products
- 15.1.10.3. Company Financials
- 15.1.10.4. SWOT Analysis
- 15.1.11 VEECO Instruments Inc
- 15.1.11.1. Company Overview
- 15.1.11.2. Products
- 15.1.11.3. Company Financials
- 15.1.11.4. SWOT Analysis
- 15.1.1 KLA Corporation
- 15.2. Market Entropy
- 15.2.1 Company's Key Areas Served
- 15.2.2 Recent Developments
- 15.3. Company Market Share Analysis 2025
- 15.3.1 Top 5 Companies Market Share Analysis
- 15.3.2 Top 3 Companies Market Share Analysis
- 15.4. List of Potential Customers
- 16. Research Methodology
List of Figures
- Figure 1: Global Semiconductor Production Equipment Industry Revenue Breakdown (Million, %) by Region 2025 & 2033
- Figure 2: Global Semiconductor Production Equipment Industry Volume Breakdown (K Unit, %) by Region 2025 & 2033
- Figure 3: United States Semiconductor Production Equipment Industry Revenue (Million), by Type 2025 & 2033
- Figure 4: United States Semiconductor Production Equipment Industry Volume (K Unit), by Type 2025 & 2033
- Figure 5: United States Semiconductor Production Equipment Industry Revenue Share (%), by Type 2025 & 2033
- Figure 6: United States Semiconductor Production Equipment Industry Volume Share (%), by Type 2025 & 2033
- Figure 7: United States Semiconductor Production Equipment Industry Revenue (Million), by End-user Industry 2025 & 2033
- Figure 8: United States Semiconductor Production Equipment Industry Volume (K Unit), by End-user Industry 2025 & 2033
- Figure 9: United States Semiconductor Production Equipment Industry Revenue Share (%), by End-user Industry 2025 & 2033
- Figure 10: United States Semiconductor Production Equipment Industry Volume Share (%), by End-user Industry 2025 & 2033
- Figure 11: United States Semiconductor Production Equipment Industry Revenue (Million), by Country 2025 & 2033
- Figure 12: United States Semiconductor Production Equipment Industry Volume (K Unit), by Country 2025 & 2033
- Figure 13: United States Semiconductor Production Equipment Industry Revenue Share (%), by Country 2025 & 2033
- Figure 14: United States Semiconductor Production Equipment Industry Volume Share (%), by Country 2025 & 2033
- Figure 15: Europe Semiconductor Production Equipment Industry Revenue (Million), by Type 2025 & 2033
- Figure 16: Europe Semiconductor Production Equipment Industry Volume (K Unit), by Type 2025 & 2033
- Figure 17: Europe Semiconductor Production Equipment Industry Revenue Share (%), by Type 2025 & 2033
- Figure 18: Europe Semiconductor Production Equipment Industry Volume Share (%), by Type 2025 & 2033
- Figure 19: Europe Semiconductor Production Equipment Industry Revenue (Million), by End-user Industry 2025 & 2033
- Figure 20: Europe Semiconductor Production Equipment Industry Volume (K Unit), by End-user Industry 2025 & 2033
- Figure 21: Europe Semiconductor Production Equipment Industry Revenue Share (%), by End-user Industry 2025 & 2033
- Figure 22: Europe Semiconductor Production Equipment Industry Volume Share (%), by End-user Industry 2025 & 2033
- Figure 23: Europe Semiconductor Production Equipment Industry Revenue (Million), by Country 2025 & 2033
- Figure 24: Europe Semiconductor Production Equipment Industry Volume (K Unit), by Country 2025 & 2033
- Figure 25: Europe Semiconductor Production Equipment Industry Revenue Share (%), by Country 2025 & 2033
- Figure 26: Europe Semiconductor Production Equipment Industry Volume Share (%), by Country 2025 & 2033
- Figure 27: China Semiconductor Production Equipment Industry Revenue (Million), by Type 2025 & 2033
- Figure 28: China Semiconductor Production Equipment Industry Volume (K Unit), by Type 2025 & 2033
- Figure 29: China Semiconductor Production Equipment Industry Revenue Share (%), by Type 2025 & 2033
- Figure 30: China Semiconductor Production Equipment Industry Volume Share (%), by Type 2025 & 2033
- Figure 31: China Semiconductor Production Equipment Industry Revenue (Million), by End-user Industry 2025 & 2033
- Figure 32: China Semiconductor Production Equipment Industry Volume (K Unit), by End-user Industry 2025 & 2033
- Figure 33: China Semiconductor Production Equipment Industry Revenue Share (%), by End-user Industry 2025 & 2033
- Figure 34: China Semiconductor Production Equipment Industry Volume Share (%), by End-user Industry 2025 & 2033
- Figure 35: China Semiconductor Production Equipment Industry Revenue (Million), by Country 2025 & 2033
- Figure 36: China Semiconductor Production Equipment Industry Volume (K Unit), by Country 2025 & 2033
- Figure 37: China Semiconductor Production Equipment Industry Revenue Share (%), by Country 2025 & 2033
- Figure 38: China Semiconductor Production Equipment Industry Volume Share (%), by Country 2025 & 2033
- Figure 39: South Korea Semiconductor Production Equipment Industry Revenue (Million), by Type 2025 & 2033
- Figure 40: South Korea Semiconductor Production Equipment Industry Volume (K Unit), by Type 2025 & 2033
- Figure 41: South Korea Semiconductor Production Equipment Industry Revenue Share (%), by Type 2025 & 2033
- Figure 42: South Korea Semiconductor Production Equipment Industry Volume Share (%), by Type 2025 & 2033
- Figure 43: South Korea Semiconductor Production Equipment Industry Revenue (Million), by End-user Industry 2025 & 2033
- Figure 44: South Korea Semiconductor Production Equipment Industry Volume (K Unit), by End-user Industry 2025 & 2033
- Figure 45: South Korea Semiconductor Production Equipment Industry Revenue Share (%), by End-user Industry 2025 & 2033
- Figure 46: South Korea Semiconductor Production Equipment Industry Volume Share (%), by End-user Industry 2025 & 2033
- Figure 47: South Korea Semiconductor Production Equipment Industry Revenue (Million), by Country 2025 & 2033
- Figure 48: South Korea Semiconductor Production Equipment Industry Volume (K Unit), by Country 2025 & 2033
- Figure 49: South Korea Semiconductor Production Equipment Industry Revenue Share (%), by Country 2025 & 2033
- Figure 50: South Korea Semiconductor Production Equipment Industry Volume Share (%), by Country 2025 & 2033
- Figure 51: Taiwan Semiconductor Production Equipment Industry Revenue (Million), by Type 2025 & 2033
- Figure 52: Taiwan Semiconductor Production Equipment Industry Volume (K Unit), by Type 2025 & 2033
- Figure 53: Taiwan Semiconductor Production Equipment Industry Revenue Share (%), by Type 2025 & 2033
- Figure 54: Taiwan Semiconductor Production Equipment Industry Volume Share (%), by Type 2025 & 2033
- Figure 55: Taiwan Semiconductor Production Equipment Industry Revenue (Million), by End-user Industry 2025 & 2033
- Figure 56: Taiwan Semiconductor Production Equipment Industry Volume (K Unit), by End-user Industry 2025 & 2033
- Figure 57: Taiwan Semiconductor Production Equipment Industry Revenue Share (%), by End-user Industry 2025 & 2033
- Figure 58: Taiwan Semiconductor Production Equipment Industry Volume Share (%), by End-user Industry 2025 & 2033
- Figure 59: Taiwan Semiconductor Production Equipment Industry Revenue (Million), by Country 2025 & 2033
- Figure 60: Taiwan Semiconductor Production Equipment Industry Volume (K Unit), by Country 2025 & 2033
- Figure 61: Taiwan Semiconductor Production Equipment Industry Revenue Share (%), by Country 2025 & 2033
- Figure 62: Taiwan Semiconductor Production Equipment Industry Volume Share (%), by Country 2025 & 2033
- Figure 63: Japan Semiconductor Production Equipment Industry Revenue (Million), by Type 2025 & 2033
- Figure 64: Japan Semiconductor Production Equipment Industry Volume (K Unit), by Type 2025 & 2033
- Figure 65: Japan Semiconductor Production Equipment Industry Revenue Share (%), by Type 2025 & 2033
- Figure 66: Japan Semiconductor Production Equipment Industry Volume Share (%), by Type 2025 & 2033
- Figure 67: Japan Semiconductor Production Equipment Industry Revenue (Million), by End-user Industry 2025 & 2033
- Figure 68: Japan Semiconductor Production Equipment Industry Volume (K Unit), by End-user Industry 2025 & 2033
- Figure 69: Japan Semiconductor Production Equipment Industry Revenue Share (%), by End-user Industry 2025 & 2033
- Figure 70: Japan Semiconductor Production Equipment Industry Volume Share (%), by End-user Industry 2025 & 2033
- Figure 71: Japan Semiconductor Production Equipment Industry Revenue (Million), by Country 2025 & 2033
- Figure 72: Japan Semiconductor Production Equipment Industry Volume (K Unit), by Country 2025 & 2033
- Figure 73: Japan Semiconductor Production Equipment Industry Revenue Share (%), by Country 2025 & 2033
- Figure 74: Japan Semiconductor Production Equipment Industry Volume Share (%), by Country 2025 & 2033
- Figure 75: Latin America Semiconductor Production Equipment Industry Revenue (Million), by Type 2025 & 2033
- Figure 76: Latin America Semiconductor Production Equipment Industry Volume (K Unit), by Type 2025 & 2033
- Figure 77: Latin America Semiconductor Production Equipment Industry Revenue Share (%), by Type 2025 & 2033
- Figure 78: Latin America Semiconductor Production Equipment Industry Volume Share (%), by Type 2025 & 2033
- Figure 79: Latin America Semiconductor Production Equipment Industry Revenue (Million), by End-user Industry 2025 & 2033
- Figure 80: Latin America Semiconductor Production Equipment Industry Volume (K Unit), by End-user Industry 2025 & 2033
- Figure 81: Latin America Semiconductor Production Equipment Industry Revenue Share (%), by End-user Industry 2025 & 2033
- Figure 82: Latin America Semiconductor Production Equipment Industry Volume Share (%), by End-user Industry 2025 & 2033
- Figure 83: Latin America Semiconductor Production Equipment Industry Revenue (Million), by Country 2025 & 2033
- Figure 84: Latin America Semiconductor Production Equipment Industry Volume (K Unit), by Country 2025 & 2033
- Figure 85: Latin America Semiconductor Production Equipment Industry Revenue Share (%), by Country 2025 & 2033
- Figure 86: Latin America Semiconductor Production Equipment Industry Volume Share (%), by Country 2025 & 2033
- Figure 87: Middle East and Africa Semiconductor Production Equipment Industry Revenue (Million), by Type 2025 & 2033
- Figure 88: Middle East and Africa Semiconductor Production Equipment Industry Volume (K Unit), by Type 2025 & 2033
- Figure 89: Middle East and Africa Semiconductor Production Equipment Industry Revenue Share (%), by Type 2025 & 2033
- Figure 90: Middle East and Africa Semiconductor Production Equipment Industry Volume Share (%), by Type 2025 & 2033
- Figure 91: Middle East and Africa Semiconductor Production Equipment Industry Revenue (Million), by End-user Industry 2025 & 2033
- Figure 92: Middle East and Africa Semiconductor Production Equipment Industry Volume (K Unit), by End-user Industry 2025 & 2033
- Figure 93: Middle East and Africa Semiconductor Production Equipment Industry Revenue Share (%), by End-user Industry 2025 & 2033
- Figure 94: Middle East and Africa Semiconductor Production Equipment Industry Volume Share (%), by End-user Industry 2025 & 2033
- Figure 95: Middle East and Africa Semiconductor Production Equipment Industry Revenue (Million), by Country 2025 & 2033
- Figure 96: Middle East and Africa Semiconductor Production Equipment Industry Volume (K Unit), by Country 2025 & 2033
- Figure 97: Middle East and Africa Semiconductor Production Equipment Industry Revenue Share (%), by Country 2025 & 2033
- Figure 98: Middle East and Africa Semiconductor Production Equipment Industry Volume Share (%), by Country 2025 & 2033
List of Tables
- Table 1: Global Semiconductor Production Equipment Industry Revenue Million Forecast, by Type 2020 & 2033
- Table 2: Global Semiconductor Production Equipment Industry Volume K Unit Forecast, by Type 2020 & 2033
- Table 3: Global Semiconductor Production Equipment Industry Revenue Million Forecast, by End-user Industry 2020 & 2033
- Table 4: Global Semiconductor Production Equipment Industry Volume K Unit Forecast, by End-user Industry 2020 & 2033
- Table 5: Global Semiconductor Production Equipment Industry Revenue Million Forecast, by Region 2020 & 2033
- Table 6: Global Semiconductor Production Equipment Industry Volume K Unit Forecast, by Region 2020 & 2033
- Table 7: Global Semiconductor Production Equipment Industry Revenue Million Forecast, by Type 2020 & 2033
- Table 8: Global Semiconductor Production Equipment Industry Volume K Unit Forecast, by Type 2020 & 2033
- Table 9: Global Semiconductor Production Equipment Industry Revenue Million Forecast, by End-user Industry 2020 & 2033
- Table 10: Global Semiconductor Production Equipment Industry Volume K Unit Forecast, by End-user Industry 2020 & 2033
- Table 11: Global Semiconductor Production Equipment Industry Revenue Million Forecast, by Country 2020 & 2033
- Table 12: Global Semiconductor Production Equipment Industry Volume K Unit Forecast, by Country 2020 & 2033
- Table 13: Global Semiconductor Production Equipment Industry Revenue Million Forecast, by Type 2020 & 2033
- Table 14: Global Semiconductor Production Equipment Industry Volume K Unit Forecast, by Type 2020 & 2033
- Table 15: Global Semiconductor Production Equipment Industry Revenue Million Forecast, by End-user Industry 2020 & 2033
- Table 16: Global Semiconductor Production Equipment Industry Volume K Unit Forecast, by End-user Industry 2020 & 2033
- Table 17: Global Semiconductor Production Equipment Industry Revenue Million Forecast, by Country 2020 & 2033
- Table 18: Global Semiconductor Production Equipment Industry Volume K Unit Forecast, by Country 2020 & 2033
- Table 19: Global Semiconductor Production Equipment Industry Revenue Million Forecast, by Type 2020 & 2033
- Table 20: Global Semiconductor Production Equipment Industry Volume K Unit Forecast, by Type 2020 & 2033
- Table 21: Global Semiconductor Production Equipment Industry Revenue Million Forecast, by End-user Industry 2020 & 2033
- Table 22: Global Semiconductor Production Equipment Industry Volume K Unit Forecast, by End-user Industry 2020 & 2033
- Table 23: Global Semiconductor Production Equipment Industry Revenue Million Forecast, by Country 2020 & 2033
- Table 24: Global Semiconductor Production Equipment Industry Volume K Unit Forecast, by Country 2020 & 2033
- Table 25: Global Semiconductor Production Equipment Industry Revenue Million Forecast, by Type 2020 & 2033
- Table 26: Global Semiconductor Production Equipment Industry Volume K Unit Forecast, by Type 2020 & 2033
- Table 27: Global Semiconductor Production Equipment Industry Revenue Million Forecast, by End-user Industry 2020 & 2033
- Table 28: Global Semiconductor Production Equipment Industry Volume K Unit Forecast, by End-user Industry 2020 & 2033
- Table 29: Global Semiconductor Production Equipment Industry Revenue Million Forecast, by Country 2020 & 2033
- Table 30: Global Semiconductor Production Equipment Industry Volume K Unit Forecast, by Country 2020 & 2033
- Table 31: Global Semiconductor Production Equipment Industry Revenue Million Forecast, by Type 2020 & 2033
- Table 32: Global Semiconductor Production Equipment Industry Volume K Unit Forecast, by Type 2020 & 2033
- Table 33: Global Semiconductor Production Equipment Industry Revenue Million Forecast, by End-user Industry 2020 & 2033
- Table 34: Global Semiconductor Production Equipment Industry Volume K Unit Forecast, by End-user Industry 2020 & 2033
- Table 35: Global Semiconductor Production Equipment Industry Revenue Million Forecast, by Country 2020 & 2033
- Table 36: Global Semiconductor Production Equipment Industry Volume K Unit Forecast, by Country 2020 & 2033
- Table 37: Global Semiconductor Production Equipment Industry Revenue Million Forecast, by Type 2020 & 2033
- Table 38: Global Semiconductor Production Equipment Industry Volume K Unit Forecast, by Type 2020 & 2033
- Table 39: Global Semiconductor Production Equipment Industry Revenue Million Forecast, by End-user Industry 2020 & 2033
- Table 40: Global Semiconductor Production Equipment Industry Volume K Unit Forecast, by End-user Industry 2020 & 2033
- Table 41: Global Semiconductor Production Equipment Industry Revenue Million Forecast, by Country 2020 & 2033
- Table 42: Global Semiconductor Production Equipment Industry Volume K Unit Forecast, by Country 2020 & 2033
- Table 43: Global Semiconductor Production Equipment Industry Revenue Million Forecast, by Type 2020 & 2033
- Table 44: Global Semiconductor Production Equipment Industry Volume K Unit Forecast, by Type 2020 & 2033
- Table 45: Global Semiconductor Production Equipment Industry Revenue Million Forecast, by End-user Industry 2020 & 2033
- Table 46: Global Semiconductor Production Equipment Industry Volume K Unit Forecast, by End-user Industry 2020 & 2033
- Table 47: Global Semiconductor Production Equipment Industry Revenue Million Forecast, by Country 2020 & 2033
- Table 48: Global Semiconductor Production Equipment Industry Volume K Unit Forecast, by Country 2020 & 2033
- Table 49: Global Semiconductor Production Equipment Industry Revenue Million Forecast, by Type 2020 & 2033
- Table 50: Global Semiconductor Production Equipment Industry Volume K Unit Forecast, by Type 2020 & 2033
- Table 51: Global Semiconductor Production Equipment Industry Revenue Million Forecast, by End-user Industry 2020 & 2033
- Table 52: Global Semiconductor Production Equipment Industry Volume K Unit Forecast, by End-user Industry 2020 & 2033
- Table 53: Global Semiconductor Production Equipment Industry Revenue Million Forecast, by Country 2020 & 2033
- Table 54: Global Semiconductor Production Equipment Industry Volume K Unit Forecast, by Country 2020 & 2033
Frequently Asked Questions
1. What is the projected Compound Annual Growth Rate (CAGR) of the Semiconductor Production Equipment Industry?
The projected CAGR is approximately 8.65%.
2. Which companies are prominent players in the Semiconductor Production Equipment Industry?
Key companies in the market include KLA Corporation, Nikon Corporation, Applied Materials Inc, Hitachi High -Technologies Corporation, Screen Holdings Co Lt, Plasma Therm, Tokyo Electron Limited, ASML Holding NV, Carl Zeiss AG, LAM Research Corporation, VEECO Instruments Inc.
3. What are the main segments of the Semiconductor Production Equipment Industry?
The market segments include Type, End-user Industry.
4. Can you provide details about the market size?
The market size is estimated to be USD 99.36 Million as of 2022.
5. What are some drivers contributing to market growth?
Increasing Needs of Consumer Electronic Devices Boosting the Manufacturing Prospects; Proliferation of Artificial Intelligence. IoT. and Connected Devices Across Industry Verticals.
6. What are the notable trends driving market growth?
Semiconductor Fabrication Plant to be the Largest End-user Industry.
7. Are there any restraints impacting market growth?
Dynamic Nature of Technologies Requires Several Changes in Manufacturing Equipment.
8. Can you provide examples of recent developments in the market?
February 2024 - At the SPIE Advanced Lithography + Patterning conference, Applied Materials unveiled a new lineup of products to address the intricate patterning demands of chips in the "Angstrom era," specifically at 2nm and below process nodes. The portfolio leverages innovative materials engineering and metrology techniques to tackle challenges associated with EUV and high-NA EUV patterning, such as line edge roughness and edge placement errors. This expansion in Applied Materials' Patterning Solutions Portfolio aims to assist chipmakers in navigating issues like tip-to-tip spacing limitations and bridge defects as they advance towards increasingly minuscule chip dimensions.
9. What pricing options are available for accessing the report?
Pricing options include single-user, multi-user, and enterprise licenses priced at USD 4750, USD 5250, and USD 8750 respectively.
10. Is the market size provided in terms of value or volume?
The market size is provided in terms of value, measured in Million and volume, measured in K Unit.
11. Are there any specific market keywords associated with the report?
Yes, the market keyword associated with the report is "Semiconductor Production Equipment Industry," which aids in identifying and referencing the specific market segment covered.
12. How do I determine which pricing option suits my needs best?
The pricing options vary based on user requirements and access needs. Individual users may opt for single-user licenses, while businesses requiring broader access may choose multi-user or enterprise licenses for cost-effective access to the report.
13. Are there any additional resources or data provided in the Semiconductor Production Equipment Industry report?
While the report offers comprehensive insights, it's advisable to review the specific contents or supplementary materials provided to ascertain if additional resources or data are available.
14. How can I stay updated on further developments or reports in the Semiconductor Production Equipment Industry?
To stay informed about further developments, trends, and reports in the Semiconductor Production Equipment Industry, consider subscribing to industry newsletters, following relevant companies and organizations, or regularly checking reputable industry news sources and publications.
Methodology
Step 1 - Identification of Relevant Samples Size from Population Database


Step 2 - Approaches for Defining Global Market Size (Value, Volume* & Price*)

Note*: In applicable scenarios
Step 3 - Data Sources
Primary Research
- Web Analytics
- Survey Reports
- Research Institute
- Latest Research Reports
- Opinion Leaders
Secondary Research
- Annual Reports
- White Paper
- Latest Press Release
- Industry Association
- Paid Database
- Investor Presentations

Step 4 - Data Triangulation
Involves using different sources of information in order to increase the validity of a study
These sources are likely to be stakeholders in a program - participants, other researchers, program staff, other community members, and so on.
Then we put all data in single framework & apply various statistical tools to find out the dynamic on the market.
During the analysis stage, feedback from the stakeholder groups would be compared to determine areas of agreement as well as areas of divergence