

Key Insights
The Semiconductor Silicon Intellectual Property (IP) market is poised for substantial expansion, driven by the escalating demand for cutting-edge semiconductor technologies across numerous industries. The market is projected to reach $7.9 billion by 2025, with a Compound Annual Growth Rate (CAGR) of 13.9% over the forecast period. Key growth catalysts include the widespread adoption of connected devices, the rapid advancement of artificial intelligence (AI) and machine learning (ML), and the pervasive implementation of 5G and other advanced communication networks. These trends necessitate higher performance, energy-efficient, and feature-rich semiconductor chips, consequently fueling the demand for sophisticated semiconductor IP solutions. Analysis of market segments highlights processor IP and wired/wireless interface IP as leading categories, with licensing, royalty models, and services contributing significantly to revenue. Consumer electronics, computing, and automotive sectors remain primary end-user segments, with industrial applications exhibiting strong growth potential.
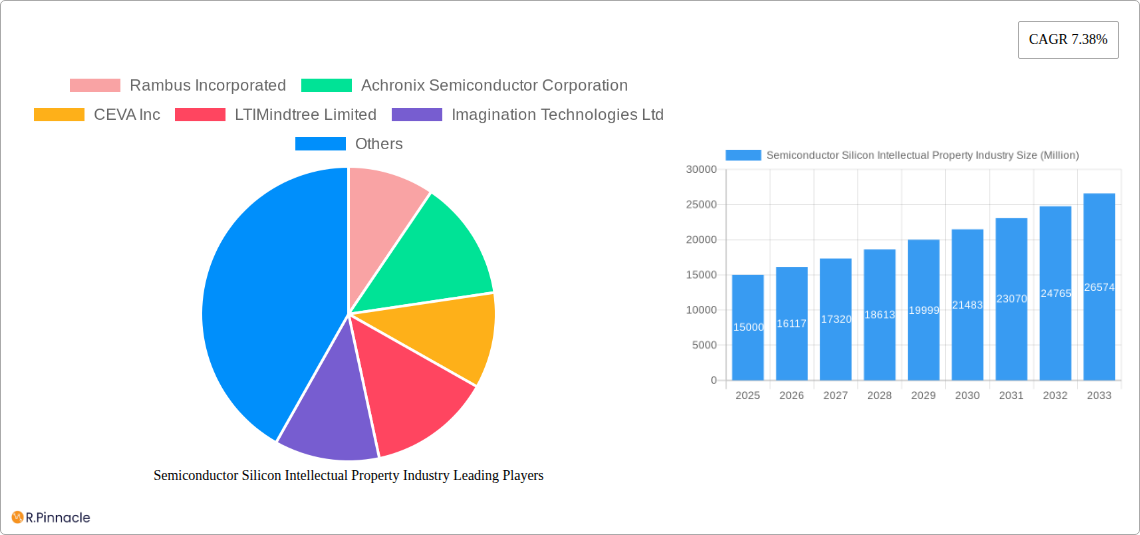
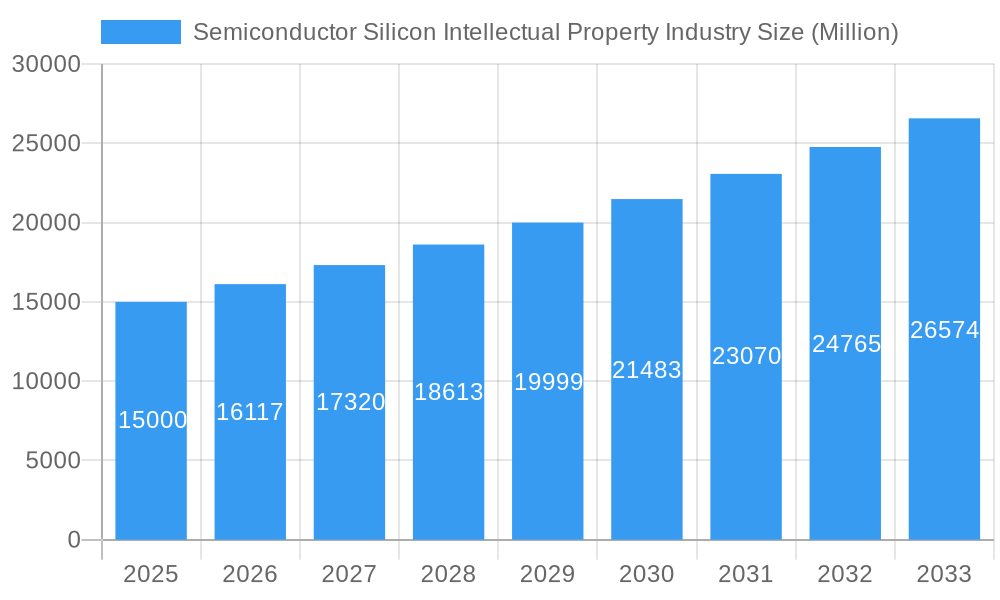
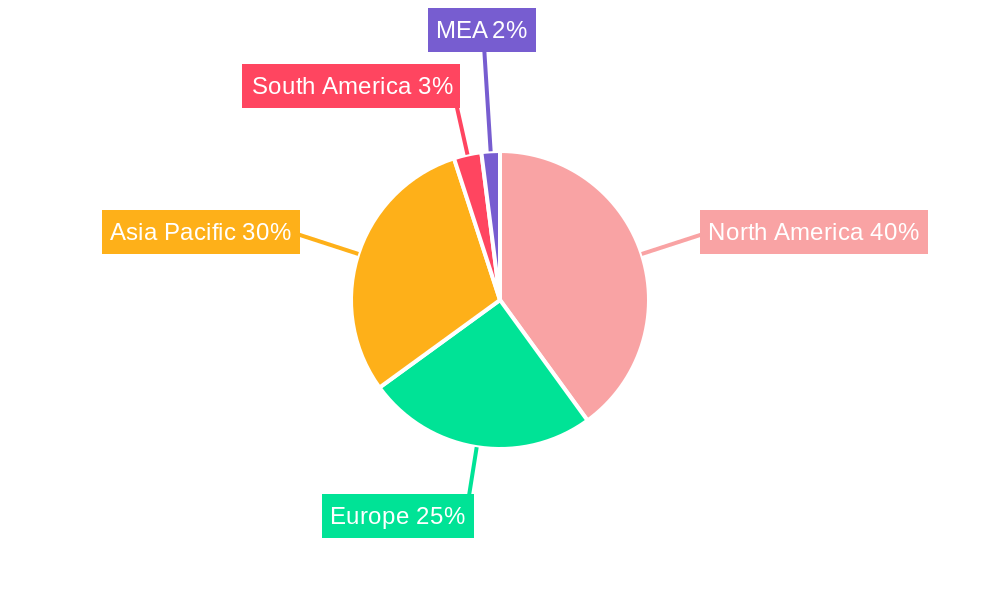
Semiconductor Silicon Intellectual Property Industry Market Size (In Billion)
Continued innovation in semiconductor design methodologies and the emergence of novel applications requiring specialized IP will sustain the market's upward trajectory. Challenges include the complexities of IP licensing and royalty negotiations, the significant investment required for advanced IP development and integration, and the inherent cyclical nature of the semiconductor industry. Geographically, North America and Asia Pacific are dominant markets, mirroring the concentration of leading semiconductor design and manufacturing facilities. Europe also represents a substantial market, while emerging economies in South America and the Middle East & Africa are anticipated to experience moderate yet consistent growth, supported by increasing infrastructure investments and technological progress. The long-term outlook for the Semiconductor Silicon IP market is highly positive, offering significant opportunities for both established and new entrants across diverse segments and regions.
Semiconductor Silicon Intellectual Property Industry Company Market Share
Semiconductor Silicon Intellectual Property Industry Report: 2019-2033
This comprehensive report provides a detailed analysis of the Semiconductor Silicon Intellectual Property (IP) industry, offering invaluable insights for industry professionals, investors, and strategic decision-makers. Covering the period 2019-2033, with a focus on 2025, this report examines market dynamics, competitive landscapes, and future growth potential. The global market is projected to reach xx Million by 2033.
Semiconductor Silicon Intellectual Property Industry Market Structure & Innovation Trends
The Semiconductor Silicon IP market exhibits a moderately concentrated structure, with several dominant players holding significant market share. Key players such as Synopsys Inc. and Cadence Design Systems Inc. command substantial portions of the market, while numerous smaller companies contribute to a competitive landscape. Market share estimations for 2025 suggest Synopsys holds approximately 25% and Cadence around 20%, with the remaining share distributed amongst other players. Innovation is driven by the relentless demand for higher performance, lower power consumption, and smaller chip sizes in electronics.
Regulatory frameworks, particularly concerning intellectual property rights and data security, significantly impact market operations. Product substitutes, primarily in the form of open-source IP and custom-designed solutions, pose a competitive challenge. End-user demographics are increasingly diverse, spanning consumer electronics, automotive, and industrial sectors. M&A activity is frequent, with deal values reaching into the hundreds of Millions annually. Recent notable acquisitions include CEVA Inc.’s acquisition of VisiSonics' spatial audio business in 2023, highlighting the ongoing consolidation within the sector. The average M&A deal value in the last 5 years has been approximately xx Million.
Semiconductor Silicon Intellectual Property Industry Market Dynamics & Trends
The Semiconductor Silicon IP market is experiencing robust growth, driven by several key factors. The increasing demand for sophisticated electronic devices across various end-user verticals is a significant catalyst. Technological advancements, such as the development of advanced node chips (5nm, 3nm, and beyond), necessitate high-quality IP solutions. Furthermore, the rising adoption of artificial intelligence (AI) and machine learning (ML) technologies fuels demand for specialized IP, accelerating market expansion. Consumer preferences shift towards more powerful, energy-efficient, and feature-rich devices, thereby stimulating the development and adoption of advanced semiconductor IP. The competitive dynamics involve ongoing innovation, strategic partnerships, and acquisitions, shaping market leadership. The Compound Annual Growth Rate (CAGR) for the forecast period (2025-2033) is estimated at xx%, with market penetration expected to reach xx% by 2033.
Dominant Regions & Segments in Semiconductor Silicon Intellectual Property Industry
By Revenue Type: The licensing segment currently dominates the revenue structure, accounting for approximately 60% of total revenue. Royalty and service revenue contribute significantly as well.
By IP Type: Processor IP accounts for the largest segment, followed by wired and wireless interface IP. Other IP types, including memory controllers and security IP, are also growing rapidly. The processor IP segment is projected to maintain its dominance due to its critical role in various electronic devices.
By End-user Vertical: The consumer electronics sector currently leads, driven by the proliferation of smartphones, wearables, and other consumer devices. The automotive and industrial sectors are experiencing rapid growth, fueled by the increasing adoption of advanced driver-assistance systems (ADAS) and automation in manufacturing processes.
The Asia-Pacific region, particularly countries like China, South Korea, and Taiwan, currently holds a leading position in terms of market size and growth. This is attributed to robust semiconductor manufacturing capabilities, supportive government policies, and a large consumer base. North America also represents a substantial market, with a high concentration of IP providers and technology innovation. Key drivers include a highly developed technological infrastructure, a strong intellectual property protection regime, and a large pool of skilled engineers.
Semiconductor Silicon Intellectual Property Industry Product Innovations
Recent innovations focus on AI-powered design automation tools (like Synopsys.ai), enhancing efficiency and reducing design time. Improvements in power efficiency and the development of specialized IP for AI/ML applications are key competitive advantages. The market is witnessing a growing trend towards platform-based IP solutions, simplifying integration and reducing development costs. This enhances market fit by catering to the rising need for faster development cycles and lower costs.
Report Scope & Segmentation Analysis
This report segments the market by revenue type (License, Royalty, Services), IP type (Processor IP, Wired and Wireless Interface IP, Other IP Types), and end-user vertical (Consumer Electronics, Computers and Peripherals, Automobile, Industrial, Other End-user Verticals). Each segment is analyzed based on its size, growth projections, and competitive dynamics. Market sizes are provided for the historical period (2019-2024), base year (2025), and forecast period (2025-2033).
Key Drivers of Semiconductor Silicon Intellectual Property Industry Growth
Technological advancements in semiconductor technology, including the development of advanced nodes, are a significant growth driver. Increasing demand for sophisticated electronics across diverse end-user applications further boosts growth. Favorable government policies and investments in the semiconductor industry also contribute significantly to market expansion. The ongoing adoption of AI and ML in various applications further fuels market demand for specialized IP.
Challenges in the Semiconductor Silicon Intellectual Property Industry Sector
Intellectual property protection remains a significant challenge, with risks of infringement and unauthorized use. Supply chain disruptions and geopolitical factors can negatively impact IP availability and manufacturing. Intense competition from established players and emerging startups poses a continuous threat. The increasing complexity of semiconductor designs adds to the development costs and time-to-market challenges.
Emerging Opportunities in Semiconductor Silicon Intellectual Property Industry
The growing Internet of Things (IoT) market presents a vast opportunity, requiring specialized IP solutions for connectivity and data processing. The development of advanced automotive technologies, including ADAS and autonomous driving, is generating significant demand. The increasing adoption of AI and ML across various sectors necessitates the development of specialized IP. New markets in areas like healthcare, renewable energy and aerospace are showing potential growth.
Leading Players in the Semiconductor Silicon Intellectual Property Industry Market
- Rambus Incorporated
- Achronix Semiconductor Corporation
- CEVA Inc
- LTIMindtree Limited
- Imagination Technologies Ltd
- Fujitsu Ltd
- Andes Technology Corporation
- Faraday Technology Corporation
- MIPS Tech LLC
- Digital Media Professionals
- Synopsys Inc
- Cadence Design Systems Inc
- eMemory Technology Inc
- MediaTek Inc
- VeriSilicon Holdings Co Ltd
- ARM Ltd (SoftBank )
Key Developments in Semiconductor Silicon Intellectual Property Industry Industry
- May 2023: CEVA Inc. acquired RealSpace 3D Spatial Audio business from VisiSonicsCorporation, strengthening its position in wearables.
- March 2023: Synopsys launched Synopsys.ai, an AI-powered electronic design automation suite, significantly accelerating chip design.
Future Outlook for Semiconductor Silicon Intellectual Property Industry Market
The Semiconductor Silicon IP market is poised for continued robust growth, driven by technological advancements, increasing demand from diverse end-user verticals, and the expansion of new applications like AI and IoT. Strategic partnerships, acquisitions, and the development of innovative IP solutions will be crucial for success in this dynamic and competitive market. The market's future potential is significant, particularly in emerging applications and regions.
Semiconductor Silicon Intellectual Property Industry Segmentation
-
1. Revenue Type
- 1.1. License
- 1.2. Royalty
- 1.3. Services
-
2. IP Type
- 2.1. Processor IP
- 2.2. Wired and Wireless Interface IP
- 2.3. Other IP Types
-
3. End-user Vertical
- 3.1. Consumer Electronics
- 3.2. Computers and Peripherals
- 3.3. Automobile
- 3.4. Industrial
- 3.5. Other End-user Verticals
Semiconductor Silicon Intellectual Property Industry Segmentation By Geography
-
1. North America
- 1.1. United States
- 1.2. Canada
-
2. Europe
- 2.1. United Kingdom
- 2.2. Germany
- 2.3. France
-
3. Asia
- 3.1. China
- 3.2. Taiwan
- 3.3. Japan
- 3.4. South Korea
- 3.5. India
- 3.6. Australia and New Zealand
- 4. Latin America
- 5. Middle East and Africa
Semiconductor Silicon Intellectual Property Industry Regional Market Share
Geographic Coverage of Semiconductor Silicon Intellectual Property Industry
Semiconductor Silicon Intellectual Property Industry REPORT HIGHLIGHTS
| Aspects | Details |
|---|---|
| Study Period | 2020-2034 |
| Base Year | 2025 |
| Estimated Year | 2026 |
| Forecast Period | 2026-2034 |
| Historical Period | 2020-2025 |
| Growth Rate | CAGR of 13.9% from 2020-2034 |
| Segmentation |
|
Table of Contents
- 1. Introduction
- 1.1. Research Scope
- 1.2. Market Segmentation
- 1.3. Research Objective
- 1.4. Definitions and Assumptions
- 2. Executive Summary
- 2.1. Market Snapshot
- 3. Market Dynamics
- 3.1. Market Drivers
- 3.2. Market Restrains
- 3.3. Market Trends
- 3.4. Market Opportunities
- 4. Market Factor Analysis
- 4.1. Porters Five Forces
- 4.1.1. Bargaining Power of Suppliers
- 4.1.2. Bargaining Power of Buyers
- 4.1.3. Threat of New Entrants
- 4.1.4. Threat of Substitutes
- 4.1.5. Competitive Rivalry
- 4.2. PESTEL analysis
- 4.3. BCG Analysis
- 4.3.1. Stars (High Growth, High Market Share)
- 4.3.2. Cash Cows (Low Growth, High Market Share)
- 4.3.3. Question Mark (High Growth, Low Market Share)
- 4.3.4. Dogs (Low Growth, Low Market Share)
- 4.4. Ansoff Matrix Analysis
- 4.5. Supply Chain Analysis
- 4.6. Regulatory Landscape
- 4.7. Current Market Potential and Opportunity Assessment (TAM–SAM–SOM Framework)
- 4.8. PRI Analyst Note
- 4.1. Porters Five Forces
- 5. Market Analysis, Insights and Forecast 2021-2033
- 5.1. Market Analysis, Insights and Forecast - by Revenue Type
- 5.1.1. License
- 5.1.2. Royalty
- 5.1.3. Services
- 5.2. Market Analysis, Insights and Forecast - by IP Type
- 5.2.1. Processor IP
- 5.2.2. Wired and Wireless Interface IP
- 5.2.3. Other IP Types
- 5.3. Market Analysis, Insights and Forecast - by End-user Vertical
- 5.3.1. Consumer Electronics
- 5.3.2. Computers and Peripherals
- 5.3.3. Automobile
- 5.3.4. Industrial
- 5.3.5. Other End-user Verticals
- 5.4. Market Analysis, Insights and Forecast - by Region
- 5.4.1. North America
- 5.4.2. Europe
- 5.4.3. Asia
- 5.4.4. Latin America
- 5.4.5. Middle East and Africa
- 5.1. Market Analysis, Insights and Forecast - by Revenue Type
- 6. Global Semiconductor Silicon Intellectual Property Industry Analysis, Insights and Forecast, 2021-2033
- 6.1. Market Analysis, Insights and Forecast - by Revenue Type
- 6.1.1. License
- 6.1.2. Royalty
- 6.1.3. Services
- 6.2. Market Analysis, Insights and Forecast - by IP Type
- 6.2.1. Processor IP
- 6.2.2. Wired and Wireless Interface IP
- 6.2.3. Other IP Types
- 6.3. Market Analysis, Insights and Forecast - by End-user Vertical
- 6.3.1. Consumer Electronics
- 6.3.2. Computers and Peripherals
- 6.3.3. Automobile
- 6.3.4. Industrial
- 6.3.5. Other End-user Verticals
- 6.1. Market Analysis, Insights and Forecast - by Revenue Type
- 7. North America Semiconductor Silicon Intellectual Property Industry Analysis, Insights and Forecast, 2020-2032
- 7.1. Market Analysis, Insights and Forecast - by Revenue Type
- 7.1.1. License
- 7.1.2. Royalty
- 7.1.3. Services
- 7.2. Market Analysis, Insights and Forecast - by IP Type
- 7.2.1. Processor IP
- 7.2.2. Wired and Wireless Interface IP
- 7.2.3. Other IP Types
- 7.3. Market Analysis, Insights and Forecast - by End-user Vertical
- 7.3.1. Consumer Electronics
- 7.3.2. Computers and Peripherals
- 7.3.3. Automobile
- 7.3.4. Industrial
- 7.3.5. Other End-user Verticals
- 7.1. Market Analysis, Insights and Forecast - by Revenue Type
- 8. Europe Semiconductor Silicon Intellectual Property Industry Analysis, Insights and Forecast, 2020-2032
- 8.1. Market Analysis, Insights and Forecast - by Revenue Type
- 8.1.1. License
- 8.1.2. Royalty
- 8.1.3. Services
- 8.2. Market Analysis, Insights and Forecast - by IP Type
- 8.2.1. Processor IP
- 8.2.2. Wired and Wireless Interface IP
- 8.2.3. Other IP Types
- 8.3. Market Analysis, Insights and Forecast - by End-user Vertical
- 8.3.1. Consumer Electronics
- 8.3.2. Computers and Peripherals
- 8.3.3. Automobile
- 8.3.4. Industrial
- 8.3.5. Other End-user Verticals
- 8.1. Market Analysis, Insights and Forecast - by Revenue Type
- 9. Asia Semiconductor Silicon Intellectual Property Industry Analysis, Insights and Forecast, 2020-2032
- 9.1. Market Analysis, Insights and Forecast - by Revenue Type
- 9.1.1. License
- 9.1.2. Royalty
- 9.1.3. Services
- 9.2. Market Analysis, Insights and Forecast - by IP Type
- 9.2.1. Processor IP
- 9.2.2. Wired and Wireless Interface IP
- 9.2.3. Other IP Types
- 9.3. Market Analysis, Insights and Forecast - by End-user Vertical
- 9.3.1. Consumer Electronics
- 9.3.2. Computers and Peripherals
- 9.3.3. Automobile
- 9.3.4. Industrial
- 9.3.5. Other End-user Verticals
- 9.1. Market Analysis, Insights and Forecast - by Revenue Type
- 10. Latin America Semiconductor Silicon Intellectual Property Industry Analysis, Insights and Forecast, 2020-2032
- 10.1. Market Analysis, Insights and Forecast - by Revenue Type
- 10.1.1. License
- 10.1.2. Royalty
- 10.1.3. Services
- 10.2. Market Analysis, Insights and Forecast - by IP Type
- 10.2.1. Processor IP
- 10.2.2. Wired and Wireless Interface IP
- 10.2.3. Other IP Types
- 10.3. Market Analysis, Insights and Forecast - by End-user Vertical
- 10.3.1. Consumer Electronics
- 10.3.2. Computers and Peripherals
- 10.3.3. Automobile
- 10.3.4. Industrial
- 10.3.5. Other End-user Verticals
- 10.1. Market Analysis, Insights and Forecast - by Revenue Type
- 11. Middle East and Africa Semiconductor Silicon Intellectual Property Industry Analysis, Insights and Forecast, 2020-2032
- 11.1. Market Analysis, Insights and Forecast - by Revenue Type
- 11.1.1. License
- 11.1.2. Royalty
- 11.1.3. Services
- 11.2. Market Analysis, Insights and Forecast - by IP Type
- 11.2.1. Processor IP
- 11.2.2. Wired and Wireless Interface IP
- 11.2.3. Other IP Types
- 11.3. Market Analysis, Insights and Forecast - by End-user Vertical
- 11.3.1. Consumer Electronics
- 11.3.2. Computers and Peripherals
- 11.3.3. Automobile
- 11.3.4. Industrial
- 11.3.5. Other End-user Verticals
- 11.1. Market Analysis, Insights and Forecast - by Revenue Type
- 12. Competitive Analysis
- 12.1. Company Profiles
- 12.1.1 Rambus Incorporated
- 12.1.1.1. Company Overview
- 12.1.1.2. Products
- 12.1.1.3. Company Financials
- 12.1.1.4. SWOT Analysis
- 12.1.2 Achronix Semiconductor Corporation
- 12.1.2.1. Company Overview
- 12.1.2.2. Products
- 12.1.2.3. Company Financials
- 12.1.2.4. SWOT Analysis
- 12.1.3 CEVA Inc
- 12.1.3.1. Company Overview
- 12.1.3.2. Products
- 12.1.3.3. Company Financials
- 12.1.3.4. SWOT Analysis
- 12.1.4 LTIMindtree Limited
- 12.1.4.1. Company Overview
- 12.1.4.2. Products
- 12.1.4.3. Company Financials
- 12.1.4.4. SWOT Analysis
- 12.1.5 Imagination Technologies Ltd
- 12.1.5.1. Company Overview
- 12.1.5.2. Products
- 12.1.5.3. Company Financials
- 12.1.5.4. SWOT Analysis
- 12.1.6 Fujitsu Ltd
- 12.1.6.1. Company Overview
- 12.1.6.2. Products
- 12.1.6.3. Company Financials
- 12.1.6.4. SWOT Analysis
- 12.1.7 Andes Technology Corporation
- 12.1.7.1. Company Overview
- 12.1.7.2. Products
- 12.1.7.3. Company Financials
- 12.1.7.4. SWOT Analysis
- 12.1.8 Faraday Technology Corporation
- 12.1.8.1. Company Overview
- 12.1.8.2. Products
- 12.1.8.3. Company Financials
- 12.1.8.4. SWOT Analysis
- 12.1.9 MIPS Tech LLC
- 12.1.9.1. Company Overview
- 12.1.9.2. Products
- 12.1.9.3. Company Financials
- 12.1.9.4. SWOT Analysis
- 12.1.10 Digital Media Professionals
- 12.1.10.1. Company Overview
- 12.1.10.2. Products
- 12.1.10.3. Company Financials
- 12.1.10.4. SWOT Analysis
- 12.1.11 Synopsys Inc
- 12.1.11.1. Company Overview
- 12.1.11.2. Products
- 12.1.11.3. Company Financials
- 12.1.11.4. SWOT Analysis
- 12.1.12 Cadence Design Systems Inc
- 12.1.12.1. Company Overview
- 12.1.12.2. Products
- 12.1.12.3. Company Financials
- 12.1.12.4. SWOT Analysis
- 12.1.13 eMemory Technology Inc
- 12.1.13.1. Company Overview
- 12.1.13.2. Products
- 12.1.13.3. Company Financials
- 12.1.13.4. SWOT Analysis
- 12.1.14 MediaTek Inc
- 12.1.14.1. Company Overview
- 12.1.14.2. Products
- 12.1.14.3. Company Financials
- 12.1.14.4. SWOT Analysis
- 12.1.15 VeriSilicon Holdings Co Ltd
- 12.1.15.1. Company Overview
- 12.1.15.2. Products
- 12.1.15.3. Company Financials
- 12.1.15.4. SWOT Analysis
- 12.1.16 ARM Ltd (SoftBank )
- 12.1.16.1. Company Overview
- 12.1.16.2. Products
- 12.1.16.3. Company Financials
- 12.1.16.4. SWOT Analysis
- 12.1.1 Rambus Incorporated
- 12.2. Market Entropy
- 12.2.1 Company's Key Areas Served
- 12.2.2 Recent Developments
- 12.3. Company Market Share Analysis 2025
- 12.3.1 Top 5 Companies Market Share Analysis
- 12.3.2 Top 3 Companies Market Share Analysis
- 12.4. List of Potential Customers
- 13. Research Methodology
List of Figures
- Figure 1: Global Semiconductor Silicon Intellectual Property Industry Revenue Breakdown (billion, %) by Region 2025 & 2033
- Figure 2: North America Semiconductor Silicon Intellectual Property Industry Revenue (billion), by Revenue Type 2025 & 2033
- Figure 3: North America Semiconductor Silicon Intellectual Property Industry Revenue Share (%), by Revenue Type 2025 & 2033
- Figure 4: North America Semiconductor Silicon Intellectual Property Industry Revenue (billion), by IP Type 2025 & 2033
- Figure 5: North America Semiconductor Silicon Intellectual Property Industry Revenue Share (%), by IP Type 2025 & 2033
- Figure 6: North America Semiconductor Silicon Intellectual Property Industry Revenue (billion), by End-user Vertical 2025 & 2033
- Figure 7: North America Semiconductor Silicon Intellectual Property Industry Revenue Share (%), by End-user Vertical 2025 & 2033
- Figure 8: North America Semiconductor Silicon Intellectual Property Industry Revenue (billion), by Country 2025 & 2033
- Figure 9: North America Semiconductor Silicon Intellectual Property Industry Revenue Share (%), by Country 2025 & 2033
- Figure 10: Europe Semiconductor Silicon Intellectual Property Industry Revenue (billion), by Revenue Type 2025 & 2033
- Figure 11: Europe Semiconductor Silicon Intellectual Property Industry Revenue Share (%), by Revenue Type 2025 & 2033
- Figure 12: Europe Semiconductor Silicon Intellectual Property Industry Revenue (billion), by IP Type 2025 & 2033
- Figure 13: Europe Semiconductor Silicon Intellectual Property Industry Revenue Share (%), by IP Type 2025 & 2033
- Figure 14: Europe Semiconductor Silicon Intellectual Property Industry Revenue (billion), by End-user Vertical 2025 & 2033
- Figure 15: Europe Semiconductor Silicon Intellectual Property Industry Revenue Share (%), by End-user Vertical 2025 & 2033
- Figure 16: Europe Semiconductor Silicon Intellectual Property Industry Revenue (billion), by Country 2025 & 2033
- Figure 17: Europe Semiconductor Silicon Intellectual Property Industry Revenue Share (%), by Country 2025 & 2033
- Figure 18: Asia Semiconductor Silicon Intellectual Property Industry Revenue (billion), by Revenue Type 2025 & 2033
- Figure 19: Asia Semiconductor Silicon Intellectual Property Industry Revenue Share (%), by Revenue Type 2025 & 2033
- Figure 20: Asia Semiconductor Silicon Intellectual Property Industry Revenue (billion), by IP Type 2025 & 2033
- Figure 21: Asia Semiconductor Silicon Intellectual Property Industry Revenue Share (%), by IP Type 2025 & 2033
- Figure 22: Asia Semiconductor Silicon Intellectual Property Industry Revenue (billion), by End-user Vertical 2025 & 2033
- Figure 23: Asia Semiconductor Silicon Intellectual Property Industry Revenue Share (%), by End-user Vertical 2025 & 2033
- Figure 24: Asia Semiconductor Silicon Intellectual Property Industry Revenue (billion), by Country 2025 & 2033
- Figure 25: Asia Semiconductor Silicon Intellectual Property Industry Revenue Share (%), by Country 2025 & 2033
- Figure 26: Latin America Semiconductor Silicon Intellectual Property Industry Revenue (billion), by Revenue Type 2025 & 2033
- Figure 27: Latin America Semiconductor Silicon Intellectual Property Industry Revenue Share (%), by Revenue Type 2025 & 2033
- Figure 28: Latin America Semiconductor Silicon Intellectual Property Industry Revenue (billion), by IP Type 2025 & 2033
- Figure 29: Latin America Semiconductor Silicon Intellectual Property Industry Revenue Share (%), by IP Type 2025 & 2033
- Figure 30: Latin America Semiconductor Silicon Intellectual Property Industry Revenue (billion), by End-user Vertical 2025 & 2033
- Figure 31: Latin America Semiconductor Silicon Intellectual Property Industry Revenue Share (%), by End-user Vertical 2025 & 2033
- Figure 32: Latin America Semiconductor Silicon Intellectual Property Industry Revenue (billion), by Country 2025 & 2033
- Figure 33: Latin America Semiconductor Silicon Intellectual Property Industry Revenue Share (%), by Country 2025 & 2033
- Figure 34: Middle East and Africa Semiconductor Silicon Intellectual Property Industry Revenue (billion), by Revenue Type 2025 & 2033
- Figure 35: Middle East and Africa Semiconductor Silicon Intellectual Property Industry Revenue Share (%), by Revenue Type 2025 & 2033
- Figure 36: Middle East and Africa Semiconductor Silicon Intellectual Property Industry Revenue (billion), by IP Type 2025 & 2033
- Figure 37: Middle East and Africa Semiconductor Silicon Intellectual Property Industry Revenue Share (%), by IP Type 2025 & 2033
- Figure 38: Middle East and Africa Semiconductor Silicon Intellectual Property Industry Revenue (billion), by End-user Vertical 2025 & 2033
- Figure 39: Middle East and Africa Semiconductor Silicon Intellectual Property Industry Revenue Share (%), by End-user Vertical 2025 & 2033
- Figure 40: Middle East and Africa Semiconductor Silicon Intellectual Property Industry Revenue (billion), by Country 2025 & 2033
- Figure 41: Middle East and Africa Semiconductor Silicon Intellectual Property Industry Revenue Share (%), by Country 2025 & 2033
List of Tables
- Table 1: Global Semiconductor Silicon Intellectual Property Industry Revenue billion Forecast, by Revenue Type 2020 & 2033
- Table 2: Global Semiconductor Silicon Intellectual Property Industry Revenue billion Forecast, by IP Type 2020 & 2033
- Table 3: Global Semiconductor Silicon Intellectual Property Industry Revenue billion Forecast, by End-user Vertical 2020 & 2033
- Table 4: Global Semiconductor Silicon Intellectual Property Industry Revenue billion Forecast, by Region 2020 & 2033
- Table 5: Global Semiconductor Silicon Intellectual Property Industry Revenue billion Forecast, by Revenue Type 2020 & 2033
- Table 6: Global Semiconductor Silicon Intellectual Property Industry Revenue billion Forecast, by IP Type 2020 & 2033
- Table 7: Global Semiconductor Silicon Intellectual Property Industry Revenue billion Forecast, by End-user Vertical 2020 & 2033
- Table 8: Global Semiconductor Silicon Intellectual Property Industry Revenue billion Forecast, by Country 2020 & 2033
- Table 9: United States Semiconductor Silicon Intellectual Property Industry Revenue (billion) Forecast, by Application 2020 & 2033
- Table 10: Canada Semiconductor Silicon Intellectual Property Industry Revenue (billion) Forecast, by Application 2020 & 2033
- Table 11: Global Semiconductor Silicon Intellectual Property Industry Revenue billion Forecast, by Revenue Type 2020 & 2033
- Table 12: Global Semiconductor Silicon Intellectual Property Industry Revenue billion Forecast, by IP Type 2020 & 2033
- Table 13: Global Semiconductor Silicon Intellectual Property Industry Revenue billion Forecast, by End-user Vertical 2020 & 2033
- Table 14: Global Semiconductor Silicon Intellectual Property Industry Revenue billion Forecast, by Country 2020 & 2033
- Table 15: United Kingdom Semiconductor Silicon Intellectual Property Industry Revenue (billion) Forecast, by Application 2020 & 2033
- Table 16: Germany Semiconductor Silicon Intellectual Property Industry Revenue (billion) Forecast, by Application 2020 & 2033
- Table 17: France Semiconductor Silicon Intellectual Property Industry Revenue (billion) Forecast, by Application 2020 & 2033
- Table 18: Global Semiconductor Silicon Intellectual Property Industry Revenue billion Forecast, by Revenue Type 2020 & 2033
- Table 19: Global Semiconductor Silicon Intellectual Property Industry Revenue billion Forecast, by IP Type 2020 & 2033
- Table 20: Global Semiconductor Silicon Intellectual Property Industry Revenue billion Forecast, by End-user Vertical 2020 & 2033
- Table 21: Global Semiconductor Silicon Intellectual Property Industry Revenue billion Forecast, by Country 2020 & 2033
- Table 22: China Semiconductor Silicon Intellectual Property Industry Revenue (billion) Forecast, by Application 2020 & 2033
- Table 23: Taiwan Semiconductor Silicon Intellectual Property Industry Revenue (billion) Forecast, by Application 2020 & 2033
- Table 24: Japan Semiconductor Silicon Intellectual Property Industry Revenue (billion) Forecast, by Application 2020 & 2033
- Table 25: South Korea Semiconductor Silicon Intellectual Property Industry Revenue (billion) Forecast, by Application 2020 & 2033
- Table 26: India Semiconductor Silicon Intellectual Property Industry Revenue (billion) Forecast, by Application 2020 & 2033
- Table 27: Australia and New Zealand Semiconductor Silicon Intellectual Property Industry Revenue (billion) Forecast, by Application 2020 & 2033
- Table 28: Global Semiconductor Silicon Intellectual Property Industry Revenue billion Forecast, by Revenue Type 2020 & 2033
- Table 29: Global Semiconductor Silicon Intellectual Property Industry Revenue billion Forecast, by IP Type 2020 & 2033
- Table 30: Global Semiconductor Silicon Intellectual Property Industry Revenue billion Forecast, by End-user Vertical 2020 & 2033
- Table 31: Global Semiconductor Silicon Intellectual Property Industry Revenue billion Forecast, by Country 2020 & 2033
- Table 32: Global Semiconductor Silicon Intellectual Property Industry Revenue billion Forecast, by Revenue Type 2020 & 2033
- Table 33: Global Semiconductor Silicon Intellectual Property Industry Revenue billion Forecast, by IP Type 2020 & 2033
- Table 34: Global Semiconductor Silicon Intellectual Property Industry Revenue billion Forecast, by End-user Vertical 2020 & 2033
- Table 35: Global Semiconductor Silicon Intellectual Property Industry Revenue billion Forecast, by Country 2020 & 2033
Frequently Asked Questions
1. What is the projected Compound Annual Growth Rate (CAGR) of the Semiconductor Silicon Intellectual Property Industry?
The projected CAGR is approximately 13.9%.
2. Which companies are prominent players in the Semiconductor Silicon Intellectual Property Industry?
Key companies in the market include Rambus Incorporated, Achronix Semiconductor Corporation, CEVA Inc, LTIMindtree Limited, Imagination Technologies Ltd, Fujitsu Ltd, Andes Technology Corporation, Faraday Technology Corporation, MIPS Tech LLC, Digital Media Professionals, Synopsys Inc, Cadence Design Systems Inc, eMemory Technology Inc, MediaTek Inc, VeriSilicon Holdings Co Ltd, ARM Ltd (SoftBank ).
3. What are the main segments of the Semiconductor Silicon Intellectual Property Industry?
The market segments include Revenue Type, IP Type, End-user Vertical.
4. Can you provide details about the market size?
The market size is estimated to be USD 7.9 billion as of 2022.
5. What are some drivers contributing to market growth?
Growing Demand for Connected Devices; Growing Demand for Modern SoC Designs.
6. What are the notable trends driving market growth?
Consumer Electronics to be the Largest End-user Vertical.
7. Are there any restraints impacting market growth?
IP Business Model and Economies of Scale.
8. Can you provide examples of recent developments in the market?
May 2023: CEVA Inc. announced the acquisition of the RealSpace 3D Spatial Audio business, technology, and patents from VisiSonicsCorporation. Based in Maryland, close to CEVA's sensor fusion R&D development center, the VisiSonicsspatial audio R&D team and software expand the Company's application software portfolio for embedded systems, bolstering CEVA's strong market position in wearables, where spatial audio is fast becoming a must-have component.
9. What pricing options are available for accessing the report?
Pricing options include single-user, multi-user, and enterprise licenses priced at USD 4750, USD 5250, and USD 8750 respectively.
10. Is the market size provided in terms of value or volume?
The market size is provided in terms of value, measured in billion.
11. Are there any specific market keywords associated with the report?
Yes, the market keyword associated with the report is "Semiconductor Silicon Intellectual Property Industry," which aids in identifying and referencing the specific market segment covered.
12. How do I determine which pricing option suits my needs best?
The pricing options vary based on user requirements and access needs. Individual users may opt for single-user licenses, while businesses requiring broader access may choose multi-user or enterprise licenses for cost-effective access to the report.
13. Are there any additional resources or data provided in the Semiconductor Silicon Intellectual Property Industry report?
While the report offers comprehensive insights, it's advisable to review the specific contents or supplementary materials provided to ascertain if additional resources or data are available.
14. How can I stay updated on further developments or reports in the Semiconductor Silicon Intellectual Property Industry?
To stay informed about further developments, trends, and reports in the Semiconductor Silicon Intellectual Property Industry, consider subscribing to industry newsletters, following relevant companies and organizations, or regularly checking reputable industry news sources and publications.
Methodology
Step 1 - Identification of Relevant Samples Size from Population Database


Step 2 - Approaches for Defining Global Market Size (Value, Volume* & Price*)

Note*: In applicable scenarios
Step 3 - Data Sources
Primary Research
- Web Analytics
- Survey Reports
- Research Institute
- Latest Research Reports
- Opinion Leaders
Secondary Research
- Annual Reports
- White Paper
- Latest Press Release
- Industry Association
- Paid Database
- Investor Presentations

Step 4 - Data Triangulation
Involves using different sources of information in order to increase the validity of a study
These sources are likely to be stakeholders in a program - participants, other researchers, program staff, other community members, and so on.
Then we put all data in single framework & apply various statistical tools to find out the dynamic on the market.
During the analysis stage, feedback from the stakeholder groups would be compared to determine areas of agreement as well as areas of divergence