

Key Insights
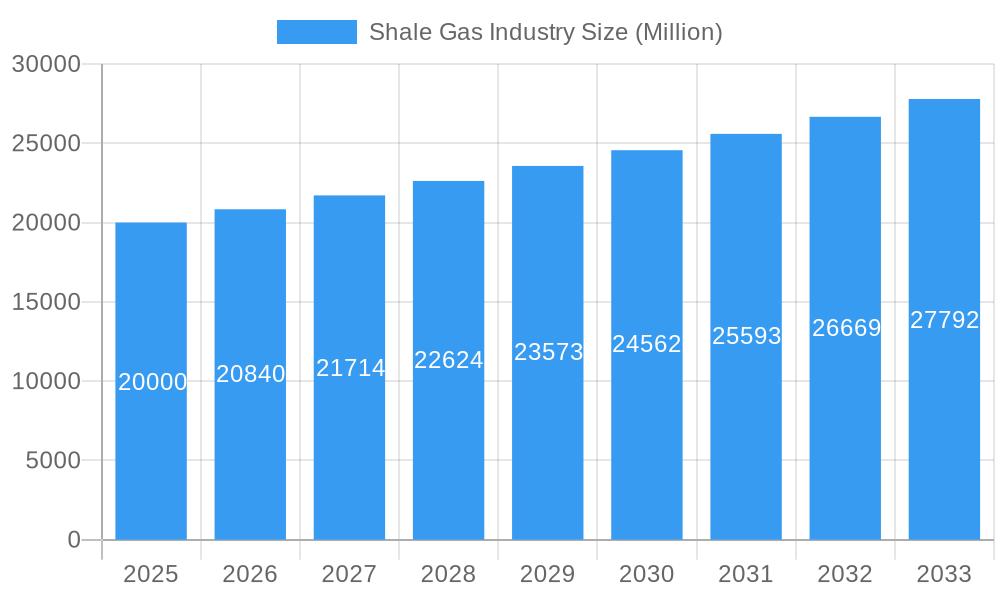
The global shale gas market is poised for significant expansion, driven by escalating energy requirements and a strategic emphasis on energy self-sufficiency. The market, currently valued at an estimated $100 billion in the base year 2025, is projected to achieve a compound annual growth rate (CAGR) of 11.6% between 2025 and 2033. This growth trajectory is underpinned by several critical drivers. Firstly, innovations in hydraulic fracturing and horizontal drilling techniques have substantially lowered extraction expenses and enhanced production efficiency, solidifying shale gas's position as a competitive energy alternative. Secondly, governmental initiatives promoting domestic energy generation and reducing dependence on foreign energy imports are a key catalyst for industry expansion, particularly in North America. Lastly, increasing demand for natural gas across power generation, industrial applications, and residential heating sectors is fueling consumption growth. Despite environmental considerations and regulatory challenges, continuous technological advancements and a heightened focus on sustainable energy practices are effectively mitigating these risks.
Shale Gas Industry Market Size (In Billion)
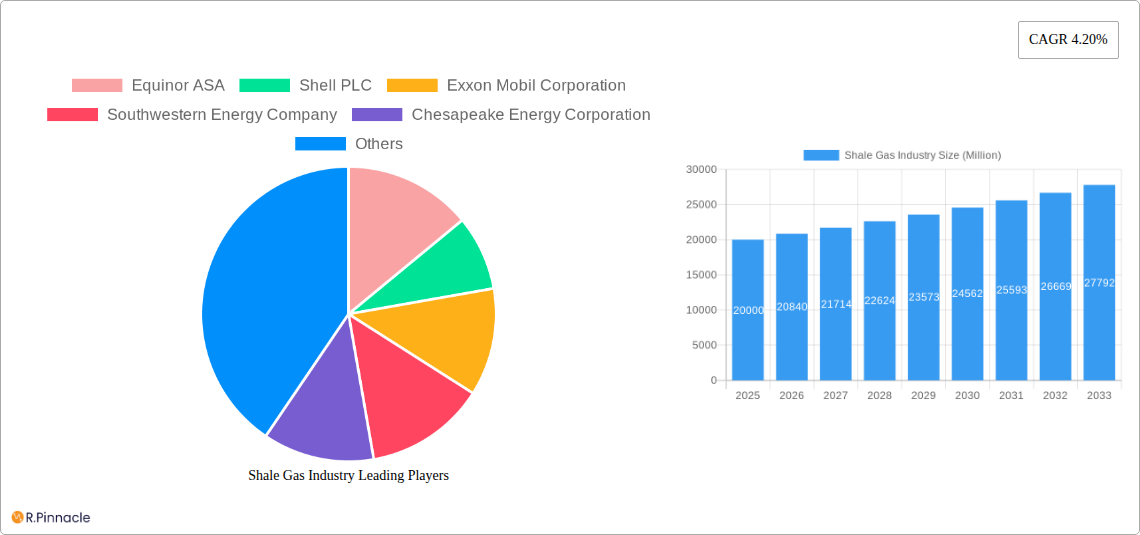
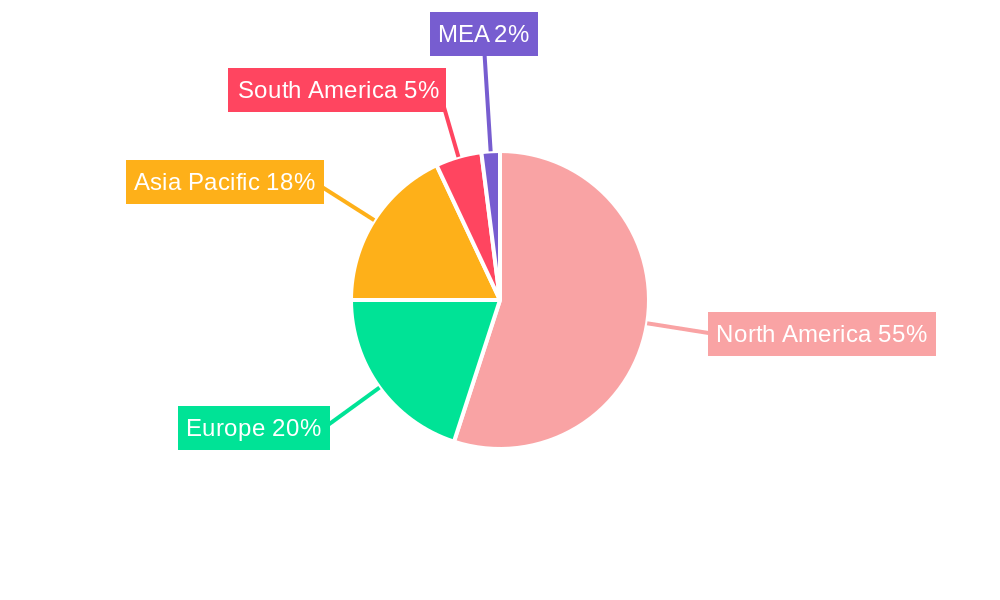
The shale gas market exhibits segmentation by type, including shale gas and tight gas, and by application, encompassing power generation, industrial, residential, commercial, and transportation sectors. North America, with the United States at its forefront, currently commands the market share due to its abundant shale gas reserves and sophisticated extraction technologies. However, the Asia-Pacific region, propelled by the substantial energy demands of China and India, is anticipated to experience robust growth in the forthcoming years. Europe, while possessing considerable reserves, navigates more stringent environmental regulations and slower market adoption compared to North America. Leading market participants, such as Equinor ASA, Shell PLC, and Exxon Mobil Corporation, are making strategic investments in exploration, production, and technological development to maintain their competitive advantage. The competitive arena is characterized by dynamism, with ongoing mergers and acquisitions actively shaping the industry's structure and fostering further innovation within the shale gas sector. The forecast period (2025-2033) indicates sustained expansion, with potential fluctuations influenced by geopolitical dynamics, technological breakthroughs, and evolving regulatory landscapes.
Shale Gas Industry Company Market Share
Shale Gas Industry Market Report: 2019-2033
This comprehensive report provides an in-depth analysis of the global shale gas industry, offering valuable insights for industry professionals, investors, and policymakers. Covering the period from 2019 to 2033, with a focus on 2025, this report meticulously examines market dynamics, technological advancements, key players, and future growth prospects. The report leverages robust data and analysis to deliver actionable strategies for navigating this dynamic market.
Study Period: 2019-2033; Base Year: 2025; Estimated Year: 2025; Forecast Period: 2025-2033; Historical Period: 2019-2024
Shale Gas Industry Market Structure & Innovation Trends
This section analyzes the competitive landscape of the shale gas industry, encompassing market concentration, innovation drivers, regulatory frameworks, substitute products, end-user demographics, and mergers & acquisitions (M&A) activity. The global shale gas market is estimated to be worth xx Million in 2025 and is projected to reach xx Million by 2033, exhibiting a CAGR of xx%.
- Market Concentration: The industry is characterized by a relatively concentrated market structure, with key players like Equinor ASA, Shell PLC, Exxon Mobil Corporation, and Chevron Corporation holding significant market share. The top 6 players account for approximately xx% of the market.
- Innovation Drivers: Technological advancements in hydraulic fracturing, horizontal drilling, and data analytics are driving efficiency gains and cost reductions, stimulating industry growth. R&D investment within the sector totals xx Million annually.
- Regulatory Frameworks: Government regulations regarding environmental impact, methane emissions, and land use significantly influence industry operations. Variations in regulatory stringency across regions lead to differing market dynamics.
- Product Substitutes: Renewable energy sources like solar and wind power pose a growing competitive threat, particularly in power generation applications. However, shale gas continues to offer a cost-competitive advantage in certain regions.
- End-User Demographics: The primary end-users are power generation companies (xx%), industrial users (xx%), and residential consumers (xx%). The industrial sector displays the most significant growth potential, with an anticipated CAGR of xx% from 2025-2033.
- M&A Activity: The shale gas industry has witnessed substantial M&A activity in recent years, with deals exceeding xx Million in value in 2024. This consolidation trend is expected to continue as companies strive for economies of scale and portfolio diversification.
Shale Gas Industry Market Dynamics & Trends
This section explores the key market drivers and trends shaping the shale gas industry. The industry's growth trajectory is influenced by factors such as fluctuating energy prices, technological advancements, evolving consumer preferences, and the increasing demand for energy in developing economies. The market is projected to experience significant growth driven by increasing global energy demand and the continuing competitiveness of shale gas.
(Paragraph detailing market growth drivers, technological disruptions, consumer preferences, competitive dynamics, specific metrics like CAGR, and market penetration will be included here. This section will be approximately 600 words.)
Dominant Regions & Segments in Shale Gas Industry
This section identifies the leading regions and segments within the shale gas industry. Both shale gas and tight gas extraction are crucial to this market, though shale gas currently represents the larger share. By application, the power generation sector accounts for the largest percentage of gas consumption, followed by industrial, residential, commercial, and transportation sectors. This section analyzes the dominance of these key areas, including influencing factors such as economic policies and infrastructural development.
Leading Regions: North America (primarily the United States) currently holds the dominant position in shale gas production, driven by abundant reserves, supportive government policies, and robust infrastructure. However, China and Australia are emerging as significant players. (Further details on regional dominance will be provided here, including factors that contribute to market performance in these areas.)
Leading Segments: (Details on the leading segments by type and application will be provided here. Key drivers such as economic policies, government regulations, and infrastructural development will be outlined with bullet points for each segment.)
(This section will be approximately 600 words, including detailed analysis of regional and segmental dominance)
Shale Gas Industry Product Innovations
(This section will provide a summary of product developments, applications, and competitive advantages, emphasizing technological trends and market fit. Approximately 100-150 words.)
Report Scope & Segmentation Analysis
This report comprehensively analyzes the shale gas market based on the following segmentations:
- By Type: Shale gas and Tight gas. (Growth projections, market sizes, and competitive dynamics for each type will be included here. Approximately 50-75 words per segment.)
- By Application: Power generation, Industrial, Residential, Commercial, and Transportation. (Growth projections, market sizes, and competitive dynamics for each application will be included here. Approximately 50-75 words per segment.)
Key Drivers of Shale Gas Industry Growth
(This section will outline growth drivers, focusing on technological, economic, and regulatory factors with specific examples. Approximately 150 words.)
Challenges in the Shale Gas Industry Sector
(This section will discuss barriers and restraints, addressing regulatory hurdles, supply chain issues, and competitive pressures with quantifiable impacts. Approximately 150 words.)
Emerging Opportunities in Shale Gas Industry
(This section will highlight emerging trends and opportunities, focusing on new markets, technologies, or consumer preferences. Approximately 150 words.)
Leading Players in the Shale Gas Industry Market
- Equinor ASA
- Shell PLC
- Exxon Mobil Corporation
- Southwestern Energy Company
- Chesapeake Energy Corporation
- PetroChina Company Limited
- EQT Corporation
- Chevron Corporation
- ConocoPhillips Company
- Pioneer Natural Resources
- China Petroleum & Chemical Corporation (SINOPEC)
- Antero Resources Corp
- Repsol SA
Key Developments in Shale Gas Industry
- December 2023: The UK government announced a new package of actions to support shale gas development, including a Shale Environmental Regulator and a Planning Brokerage Service.
- August 2023: Falcon Oil & Gas and Tamboran Resources discovered a substantial potential presence of dry gas in Australia’s Beetaloo sub-basin.
- October 2022: Sinopec made a significant shale gas discovery in the Sichuan basin, aiming for 100 billion cubic meters per annum of gas production.
Future Outlook for Shale Gas Industry Market
(This section will summarize growth accelerators, focusing on future market potential and strategic opportunities. Approximately 150 words.)
Shale Gas Industry Segmentation
- 1. Production Analysis
- 2. Consumption Analysis
- 3. Import Market Analysis (Value & Volume)
- 4. Export Market Analysis (Value & Volume)
- 5. Price Trend Analysis
Shale Gas Industry Segmentation By Geography
-
1. North America
- 1.1. United States
- 1.2. Canada
- 1.3. Rest of North America
-
2. South America
- 2.1. Brazil
- 2.2. Argentina
- 2.3. Chile
- 2.4. Colombia
- 2.5. Rest of South America
-
3. Asia Pacific
- 3.1. China
- 3.2. India
- 3.3. Japan
- 3.4. Australia
- 3.5. Malaysia
- 3.6. Thailand
- 3.7. Indonesia
- 3.8. Vietnam
- 3.9. Rest of Asia Pacific
-
4. Europe
- 4.1. Germany
- 4.2. France
- 4.3. United Kingdom
- 4.4. Italy
- 4.5. Spain
- 4.6. NORDIC
- 4.7. Turkey
- 4.8. Russia
- 4.9. Rest of Europe
-
5. Middle East and Africa
- 5.1. United Arab Emirates
- 5.2. Saudi Arabia
- 5.3. Qatar
- 5.4. South Africa
- 5.5. Nigeria
- 5.6. Egypt
Shale Gas Industry Regional Market Share
Geographic Coverage of Shale Gas Industry
Shale Gas Industry REPORT HIGHLIGHTS
| Aspects | Details |
|---|---|
| Study Period | 2020-2034 |
| Base Year | 2025 |
| Estimated Year | 2026 |
| Forecast Period | 2026-2034 |
| Historical Period | 2020-2025 |
| Growth Rate | CAGR of 11.6% from 2020-2034 |
| Segmentation |
|
Table of Contents
- 1. Introduction
- 1.1. Research Scope
- 1.2. Market Segmentation
- 1.3. Research Objective
- 1.4. Definitions and Assumptions
- 2. Executive Summary
- 2.1. Market Snapshot
- 3. Market Dynamics
- 3.1. Market Drivers
- 3.2. Market Restrains
- 3.3. Market Trends
- 3.4. Market Opportunities
- 4. Market Factor Analysis
- 4.1. Porters Five Forces
- 4.1.1. Bargaining Power of Suppliers
- 4.1.2. Bargaining Power of Buyers
- 4.1.3. Threat of New Entrants
- 4.1.4. Threat of Substitutes
- 4.1.5. Competitive Rivalry
- 4.2. PESTEL analysis
- 4.3. BCG Analysis
- 4.3.1. Stars (High Growth, High Market Share)
- 4.3.2. Cash Cows (Low Growth, High Market Share)
- 4.3.3. Question Mark (High Growth, Low Market Share)
- 4.3.4. Dogs (Low Growth, Low Market Share)
- 4.4. Ansoff Matrix Analysis
- 4.5. Supply Chain Analysis
- 4.6. Regulatory Landscape
- 4.7. Current Market Potential and Opportunity Assessment (TAM–SAM–SOM Framework)
- 4.8. PRI Analyst Note
- 4.1. Porters Five Forces
- 5. Market Analysis, Insights and Forecast 2021-2033
- 5.1. Market Analysis, Insights and Forecast - by Production Analysis
- 5.2. Market Analysis, Insights and Forecast - by Consumption Analysis
- 5.3. Market Analysis, Insights and Forecast - by Import Market Analysis (Value & Volume)
- 5.4. Market Analysis, Insights and Forecast - by Export Market Analysis (Value & Volume)
- 5.5. Market Analysis, Insights and Forecast - by Price Trend Analysis
- 5.6. Market Analysis, Insights and Forecast - by Region
- 5.6.1. North America
- 5.6.2. South America
- 5.6.3. Asia Pacific
- 5.6.4. Europe
- 5.6.5. Middle East and Africa
- 6. Global Shale Gas Industry Analysis, Insights and Forecast, 2021-2033
- 6.1. Market Analysis, Insights and Forecast - by Production Analysis
- 6.2. Market Analysis, Insights and Forecast - by Consumption Analysis
- 6.3. Market Analysis, Insights and Forecast - by Import Market Analysis (Value & Volume)
- 6.4. Market Analysis, Insights and Forecast - by Export Market Analysis (Value & Volume)
- 6.5. Market Analysis, Insights and Forecast - by Price Trend Analysis
- 7. North America Shale Gas Industry Analysis, Insights and Forecast, 2020-2032
- 7.1. Market Analysis, Insights and Forecast - by Production Analysis
- 7.2. Market Analysis, Insights and Forecast - by Consumption Analysis
- 7.3. Market Analysis, Insights and Forecast - by Import Market Analysis (Value & Volume)
- 7.4. Market Analysis, Insights and Forecast - by Export Market Analysis (Value & Volume)
- 7.5. Market Analysis, Insights and Forecast - by Price Trend Analysis
- 8. South America Shale Gas Industry Analysis, Insights and Forecast, 2020-2032
- 8.1. Market Analysis, Insights and Forecast - by Production Analysis
- 8.2. Market Analysis, Insights and Forecast - by Consumption Analysis
- 8.3. Market Analysis, Insights and Forecast - by Import Market Analysis (Value & Volume)
- 8.4. Market Analysis, Insights and Forecast - by Export Market Analysis (Value & Volume)
- 8.5. Market Analysis, Insights and Forecast - by Price Trend Analysis
- 9. Asia Pacific Shale Gas Industry Analysis, Insights and Forecast, 2020-2032
- 9.1. Market Analysis, Insights and Forecast - by Production Analysis
- 9.2. Market Analysis, Insights and Forecast - by Consumption Analysis
- 9.3. Market Analysis, Insights and Forecast - by Import Market Analysis (Value & Volume)
- 9.4. Market Analysis, Insights and Forecast - by Export Market Analysis (Value & Volume)
- 9.5. Market Analysis, Insights and Forecast - by Price Trend Analysis
- 10. Europe Shale Gas Industry Analysis, Insights and Forecast, 2020-2032
- 10.1. Market Analysis, Insights and Forecast - by Production Analysis
- 10.2. Market Analysis, Insights and Forecast - by Consumption Analysis
- 10.3. Market Analysis, Insights and Forecast - by Import Market Analysis (Value & Volume)
- 10.4. Market Analysis, Insights and Forecast - by Export Market Analysis (Value & Volume)
- 10.5. Market Analysis, Insights and Forecast - by Price Trend Analysis
- 11. Middle East and Africa Shale Gas Industry Analysis, Insights and Forecast, 2020-2032
- 11.1. Market Analysis, Insights and Forecast - by Production Analysis
- 11.2. Market Analysis, Insights and Forecast - by Consumption Analysis
- 11.3. Market Analysis, Insights and Forecast - by Import Market Analysis (Value & Volume)
- 11.4. Market Analysis, Insights and Forecast - by Export Market Analysis (Value & Volume)
- 11.5. Market Analysis, Insights and Forecast - by Price Trend Analysis
- 12. Competitive Analysis
- 12.1. Company Profiles
- 12.1.1 Equinor ASA
- 12.1.1.1. Company Overview
- 12.1.1.2. Products
- 12.1.1.3. Company Financials
- 12.1.1.4. SWOT Analysis
- 12.1.2 Shell PLC
- 12.1.2.1. Company Overview
- 12.1.2.2. Products
- 12.1.2.3. Company Financials
- 12.1.2.4. SWOT Analysis
- 12.1.3 Exxon Mobil Corporation
- 12.1.3.1. Company Overview
- 12.1.3.2. Products
- 12.1.3.3. Company Financials
- 12.1.3.4. SWOT Analysis
- 12.1.4 Southwestern Energy Company
- 12.1.4.1. Company Overview
- 12.1.4.2. Products
- 12.1.4.3. Company Financials
- 12.1.4.4. SWOT Analysis
- 12.1.5 Chesapeake Energy Corporation
- 12.1.5.1. Company Overview
- 12.1.5.2. Products
- 12.1.5.3. Company Financials
- 12.1.5.4. SWOT Analysis
- 12.1.6 PetroChina Company Limited
- 12.1.6.1. Company Overview
- 12.1.6.2. Products
- 12.1.6.3. Company Financials
- 12.1.6.4. SWOT Analysis
- 12.1.7 EQT Corporation
- 12.1.7.1. Company Overview
- 12.1.7.2. Products
- 12.1.7.3. Company Financials
- 12.1.7.4. SWOT Analysis
- 12.1.8 Chevron Corporation
- 12.1.8.1. Company Overview
- 12.1.8.2. Products
- 12.1.8.3. Company Financials
- 12.1.8.4. SWOT Analysis
- 12.1.9 ConocoPhillips Company
- 12.1.9.1. Company Overview
- 12.1.9.2. Products
- 12.1.9.3. Company Financials
- 12.1.9.4. SWOT Analysis
- 12.1.10 Pioneer Natural Resources*List Not Exhaustive 6 4 Market Player Ranking
- 12.1.10.1. Company Overview
- 12.1.10.2. Products
- 12.1.10.3. Company Financials
- 12.1.10.4. SWOT Analysis
- 12.1.11 China Petroleum & Chemical Corporation (SINOPEC)
- 12.1.11.1. Company Overview
- 12.1.11.2. Products
- 12.1.11.3. Company Financials
- 12.1.11.4. SWOT Analysis
- 12.1.12 Antero Resources Corp
- 12.1.12.1. Company Overview
- 12.1.12.2. Products
- 12.1.12.3. Company Financials
- 12.1.12.4. SWOT Analysis
- 12.1.13 Repsol SA
- 12.1.13.1. Company Overview
- 12.1.13.2. Products
- 12.1.13.3. Company Financials
- 12.1.13.4. SWOT Analysis
- 12.1.1 Equinor ASA
- 12.2. Market Entropy
- 12.2.1 Company's Key Areas Served
- 12.2.2 Recent Developments
- 12.3. Company Market Share Analysis 2025
- 12.3.1 Top 5 Companies Market Share Analysis
- 12.3.2 Top 3 Companies Market Share Analysis
- 12.4. List of Potential Customers
- 13. Research Methodology
List of Figures
- Figure 1: Global Shale Gas Industry Revenue Breakdown (billion, %) by Region 2025 & 2033
- Figure 2: Global Shale Gas Industry Volume Breakdown (Trillion, %) by Region 2025 & 2033
- Figure 3: North America Shale Gas Industry Revenue (billion), by Production Analysis 2025 & 2033
- Figure 4: North America Shale Gas Industry Volume (Trillion), by Production Analysis 2025 & 2033
- Figure 5: North America Shale Gas Industry Revenue Share (%), by Production Analysis 2025 & 2033
- Figure 6: North America Shale Gas Industry Volume Share (%), by Production Analysis 2025 & 2033
- Figure 7: North America Shale Gas Industry Revenue (billion), by Consumption Analysis 2025 & 2033
- Figure 8: North America Shale Gas Industry Volume (Trillion), by Consumption Analysis 2025 & 2033
- Figure 9: North America Shale Gas Industry Revenue Share (%), by Consumption Analysis 2025 & 2033
- Figure 10: North America Shale Gas Industry Volume Share (%), by Consumption Analysis 2025 & 2033
- Figure 11: North America Shale Gas Industry Revenue (billion), by Import Market Analysis (Value & Volume) 2025 & 2033
- Figure 12: North America Shale Gas Industry Volume (Trillion), by Import Market Analysis (Value & Volume) 2025 & 2033
- Figure 13: North America Shale Gas Industry Revenue Share (%), by Import Market Analysis (Value & Volume) 2025 & 2033
- Figure 14: North America Shale Gas Industry Volume Share (%), by Import Market Analysis (Value & Volume) 2025 & 2033
- Figure 15: North America Shale Gas Industry Revenue (billion), by Export Market Analysis (Value & Volume) 2025 & 2033
- Figure 16: North America Shale Gas Industry Volume (Trillion), by Export Market Analysis (Value & Volume) 2025 & 2033
- Figure 17: North America Shale Gas Industry Revenue Share (%), by Export Market Analysis (Value & Volume) 2025 & 2033
- Figure 18: North America Shale Gas Industry Volume Share (%), by Export Market Analysis (Value & Volume) 2025 & 2033
- Figure 19: North America Shale Gas Industry Revenue (billion), by Price Trend Analysis 2025 & 2033
- Figure 20: North America Shale Gas Industry Volume (Trillion), by Price Trend Analysis 2025 & 2033
- Figure 21: North America Shale Gas Industry Revenue Share (%), by Price Trend Analysis 2025 & 2033
- Figure 22: North America Shale Gas Industry Volume Share (%), by Price Trend Analysis 2025 & 2033
- Figure 23: North America Shale Gas Industry Revenue (billion), by Country 2025 & 2033
- Figure 24: North America Shale Gas Industry Volume (Trillion), by Country 2025 & 2033
- Figure 25: North America Shale Gas Industry Revenue Share (%), by Country 2025 & 2033
- Figure 26: North America Shale Gas Industry Volume Share (%), by Country 2025 & 2033
- Figure 27: South America Shale Gas Industry Revenue (billion), by Production Analysis 2025 & 2033
- Figure 28: South America Shale Gas Industry Volume (Trillion), by Production Analysis 2025 & 2033
- Figure 29: South America Shale Gas Industry Revenue Share (%), by Production Analysis 2025 & 2033
- Figure 30: South America Shale Gas Industry Volume Share (%), by Production Analysis 2025 & 2033
- Figure 31: South America Shale Gas Industry Revenue (billion), by Consumption Analysis 2025 & 2033
- Figure 32: South America Shale Gas Industry Volume (Trillion), by Consumption Analysis 2025 & 2033
- Figure 33: South America Shale Gas Industry Revenue Share (%), by Consumption Analysis 2025 & 2033
- Figure 34: South America Shale Gas Industry Volume Share (%), by Consumption Analysis 2025 & 2033
- Figure 35: South America Shale Gas Industry Revenue (billion), by Import Market Analysis (Value & Volume) 2025 & 2033
- Figure 36: South America Shale Gas Industry Volume (Trillion), by Import Market Analysis (Value & Volume) 2025 & 2033
- Figure 37: South America Shale Gas Industry Revenue Share (%), by Import Market Analysis (Value & Volume) 2025 & 2033
- Figure 38: South America Shale Gas Industry Volume Share (%), by Import Market Analysis (Value & Volume) 2025 & 2033
- Figure 39: South America Shale Gas Industry Revenue (billion), by Export Market Analysis (Value & Volume) 2025 & 2033
- Figure 40: South America Shale Gas Industry Volume (Trillion), by Export Market Analysis (Value & Volume) 2025 & 2033
- Figure 41: South America Shale Gas Industry Revenue Share (%), by Export Market Analysis (Value & Volume) 2025 & 2033
- Figure 42: South America Shale Gas Industry Volume Share (%), by Export Market Analysis (Value & Volume) 2025 & 2033
- Figure 43: South America Shale Gas Industry Revenue (billion), by Price Trend Analysis 2025 & 2033
- Figure 44: South America Shale Gas Industry Volume (Trillion), by Price Trend Analysis 2025 & 2033
- Figure 45: South America Shale Gas Industry Revenue Share (%), by Price Trend Analysis 2025 & 2033
- Figure 46: South America Shale Gas Industry Volume Share (%), by Price Trend Analysis 2025 & 2033
- Figure 47: South America Shale Gas Industry Revenue (billion), by Country 2025 & 2033
- Figure 48: South America Shale Gas Industry Volume (Trillion), by Country 2025 & 2033
- Figure 49: South America Shale Gas Industry Revenue Share (%), by Country 2025 & 2033
- Figure 50: South America Shale Gas Industry Volume Share (%), by Country 2025 & 2033
- Figure 51: Asia Pacific Shale Gas Industry Revenue (billion), by Production Analysis 2025 & 2033
- Figure 52: Asia Pacific Shale Gas Industry Volume (Trillion), by Production Analysis 2025 & 2033
- Figure 53: Asia Pacific Shale Gas Industry Revenue Share (%), by Production Analysis 2025 & 2033
- Figure 54: Asia Pacific Shale Gas Industry Volume Share (%), by Production Analysis 2025 & 2033
- Figure 55: Asia Pacific Shale Gas Industry Revenue (billion), by Consumption Analysis 2025 & 2033
- Figure 56: Asia Pacific Shale Gas Industry Volume (Trillion), by Consumption Analysis 2025 & 2033
- Figure 57: Asia Pacific Shale Gas Industry Revenue Share (%), by Consumption Analysis 2025 & 2033
- Figure 58: Asia Pacific Shale Gas Industry Volume Share (%), by Consumption Analysis 2025 & 2033
- Figure 59: Asia Pacific Shale Gas Industry Revenue (billion), by Import Market Analysis (Value & Volume) 2025 & 2033
- Figure 60: Asia Pacific Shale Gas Industry Volume (Trillion), by Import Market Analysis (Value & Volume) 2025 & 2033
- Figure 61: Asia Pacific Shale Gas Industry Revenue Share (%), by Import Market Analysis (Value & Volume) 2025 & 2033
- Figure 62: Asia Pacific Shale Gas Industry Volume Share (%), by Import Market Analysis (Value & Volume) 2025 & 2033
- Figure 63: Asia Pacific Shale Gas Industry Revenue (billion), by Export Market Analysis (Value & Volume) 2025 & 2033
- Figure 64: Asia Pacific Shale Gas Industry Volume (Trillion), by Export Market Analysis (Value & Volume) 2025 & 2033
- Figure 65: Asia Pacific Shale Gas Industry Revenue Share (%), by Export Market Analysis (Value & Volume) 2025 & 2033
- Figure 66: Asia Pacific Shale Gas Industry Volume Share (%), by Export Market Analysis (Value & Volume) 2025 & 2033
- Figure 67: Asia Pacific Shale Gas Industry Revenue (billion), by Price Trend Analysis 2025 & 2033
- Figure 68: Asia Pacific Shale Gas Industry Volume (Trillion), by Price Trend Analysis 2025 & 2033
- Figure 69: Asia Pacific Shale Gas Industry Revenue Share (%), by Price Trend Analysis 2025 & 2033
- Figure 70: Asia Pacific Shale Gas Industry Volume Share (%), by Price Trend Analysis 2025 & 2033
- Figure 71: Asia Pacific Shale Gas Industry Revenue (billion), by Country 2025 & 2033
- Figure 72: Asia Pacific Shale Gas Industry Volume (Trillion), by Country 2025 & 2033
- Figure 73: Asia Pacific Shale Gas Industry Revenue Share (%), by Country 2025 & 2033
- Figure 74: Asia Pacific Shale Gas Industry Volume Share (%), by Country 2025 & 2033
- Figure 75: Europe Shale Gas Industry Revenue (billion), by Production Analysis 2025 & 2033
- Figure 76: Europe Shale Gas Industry Volume (Trillion), by Production Analysis 2025 & 2033
- Figure 77: Europe Shale Gas Industry Revenue Share (%), by Production Analysis 2025 & 2033
- Figure 78: Europe Shale Gas Industry Volume Share (%), by Production Analysis 2025 & 2033
- Figure 79: Europe Shale Gas Industry Revenue (billion), by Consumption Analysis 2025 & 2033
- Figure 80: Europe Shale Gas Industry Volume (Trillion), by Consumption Analysis 2025 & 2033
- Figure 81: Europe Shale Gas Industry Revenue Share (%), by Consumption Analysis 2025 & 2033
- Figure 82: Europe Shale Gas Industry Volume Share (%), by Consumption Analysis 2025 & 2033
- Figure 83: Europe Shale Gas Industry Revenue (billion), by Import Market Analysis (Value & Volume) 2025 & 2033
- Figure 84: Europe Shale Gas Industry Volume (Trillion), by Import Market Analysis (Value & Volume) 2025 & 2033
- Figure 85: Europe Shale Gas Industry Revenue Share (%), by Import Market Analysis (Value & Volume) 2025 & 2033
- Figure 86: Europe Shale Gas Industry Volume Share (%), by Import Market Analysis (Value & Volume) 2025 & 2033
- Figure 87: Europe Shale Gas Industry Revenue (billion), by Export Market Analysis (Value & Volume) 2025 & 2033
- Figure 88: Europe Shale Gas Industry Volume (Trillion), by Export Market Analysis (Value & Volume) 2025 & 2033
- Figure 89: Europe Shale Gas Industry Revenue Share (%), by Export Market Analysis (Value & Volume) 2025 & 2033
- Figure 90: Europe Shale Gas Industry Volume Share (%), by Export Market Analysis (Value & Volume) 2025 & 2033
- Figure 91: Europe Shale Gas Industry Revenue (billion), by Price Trend Analysis 2025 & 2033
- Figure 92: Europe Shale Gas Industry Volume (Trillion), by Price Trend Analysis 2025 & 2033
- Figure 93: Europe Shale Gas Industry Revenue Share (%), by Price Trend Analysis 2025 & 2033
- Figure 94: Europe Shale Gas Industry Volume Share (%), by Price Trend Analysis 2025 & 2033
- Figure 95: Europe Shale Gas Industry Revenue (billion), by Country 2025 & 2033
- Figure 96: Europe Shale Gas Industry Volume (Trillion), by Country 2025 & 2033
- Figure 97: Europe Shale Gas Industry Revenue Share (%), by Country 2025 & 2033
- Figure 98: Europe Shale Gas Industry Volume Share (%), by Country 2025 & 2033
- Figure 99: Middle East and Africa Shale Gas Industry Revenue (billion), by Production Analysis 2025 & 2033
- Figure 100: Middle East and Africa Shale Gas Industry Volume (Trillion), by Production Analysis 2025 & 2033
- Figure 101: Middle East and Africa Shale Gas Industry Revenue Share (%), by Production Analysis 2025 & 2033
- Figure 102: Middle East and Africa Shale Gas Industry Volume Share (%), by Production Analysis 2025 & 2033
- Figure 103: Middle East and Africa Shale Gas Industry Revenue (billion), by Consumption Analysis 2025 & 2033
- Figure 104: Middle East and Africa Shale Gas Industry Volume (Trillion), by Consumption Analysis 2025 & 2033
- Figure 105: Middle East and Africa Shale Gas Industry Revenue Share (%), by Consumption Analysis 2025 & 2033
- Figure 106: Middle East and Africa Shale Gas Industry Volume Share (%), by Consumption Analysis 2025 & 2033
- Figure 107: Middle East and Africa Shale Gas Industry Revenue (billion), by Import Market Analysis (Value & Volume) 2025 & 2033
- Figure 108: Middle East and Africa Shale Gas Industry Volume (Trillion), by Import Market Analysis (Value & Volume) 2025 & 2033
- Figure 109: Middle East and Africa Shale Gas Industry Revenue Share (%), by Import Market Analysis (Value & Volume) 2025 & 2033
- Figure 110: Middle East and Africa Shale Gas Industry Volume Share (%), by Import Market Analysis (Value & Volume) 2025 & 2033
- Figure 111: Middle East and Africa Shale Gas Industry Revenue (billion), by Export Market Analysis (Value & Volume) 2025 & 2033
- Figure 112: Middle East and Africa Shale Gas Industry Volume (Trillion), by Export Market Analysis (Value & Volume) 2025 & 2033
- Figure 113: Middle East and Africa Shale Gas Industry Revenue Share (%), by Export Market Analysis (Value & Volume) 2025 & 2033
- Figure 114: Middle East and Africa Shale Gas Industry Volume Share (%), by Export Market Analysis (Value & Volume) 2025 & 2033
- Figure 115: Middle East and Africa Shale Gas Industry Revenue (billion), by Price Trend Analysis 2025 & 2033
- Figure 116: Middle East and Africa Shale Gas Industry Volume (Trillion), by Price Trend Analysis 2025 & 2033
- Figure 117: Middle East and Africa Shale Gas Industry Revenue Share (%), by Price Trend Analysis 2025 & 2033
- Figure 118: Middle East and Africa Shale Gas Industry Volume Share (%), by Price Trend Analysis 2025 & 2033
- Figure 119: Middle East and Africa Shale Gas Industry Revenue (billion), by Country 2025 & 2033
- Figure 120: Middle East and Africa Shale Gas Industry Volume (Trillion), by Country 2025 & 2033
- Figure 121: Middle East and Africa Shale Gas Industry Revenue Share (%), by Country 2025 & 2033
- Figure 122: Middle East and Africa Shale Gas Industry Volume Share (%), by Country 2025 & 2033
List of Tables
- Table 1: Global Shale Gas Industry Revenue billion Forecast, by Production Analysis 2020 & 2033
- Table 2: Global Shale Gas Industry Volume Trillion Forecast, by Production Analysis 2020 & 2033
- Table 3: Global Shale Gas Industry Revenue billion Forecast, by Consumption Analysis 2020 & 2033
- Table 4: Global Shale Gas Industry Volume Trillion Forecast, by Consumption Analysis 2020 & 2033
- Table 5: Global Shale Gas Industry Revenue billion Forecast, by Import Market Analysis (Value & Volume) 2020 & 2033
- Table 6: Global Shale Gas Industry Volume Trillion Forecast, by Import Market Analysis (Value & Volume) 2020 & 2033
- Table 7: Global Shale Gas Industry Revenue billion Forecast, by Export Market Analysis (Value & Volume) 2020 & 2033
- Table 8: Global Shale Gas Industry Volume Trillion Forecast, by Export Market Analysis (Value & Volume) 2020 & 2033
- Table 9: Global Shale Gas Industry Revenue billion Forecast, by Price Trend Analysis 2020 & 2033
- Table 10: Global Shale Gas Industry Volume Trillion Forecast, by Price Trend Analysis 2020 & 2033
- Table 11: Global Shale Gas Industry Revenue billion Forecast, by Region 2020 & 2033
- Table 12: Global Shale Gas Industry Volume Trillion Forecast, by Region 2020 & 2033
- Table 13: Global Shale Gas Industry Revenue billion Forecast, by Production Analysis 2020 & 2033
- Table 14: Global Shale Gas Industry Volume Trillion Forecast, by Production Analysis 2020 & 2033
- Table 15: Global Shale Gas Industry Revenue billion Forecast, by Consumption Analysis 2020 & 2033
- Table 16: Global Shale Gas Industry Volume Trillion Forecast, by Consumption Analysis 2020 & 2033
- Table 17: Global Shale Gas Industry Revenue billion Forecast, by Import Market Analysis (Value & Volume) 2020 & 2033
- Table 18: Global Shale Gas Industry Volume Trillion Forecast, by Import Market Analysis (Value & Volume) 2020 & 2033
- Table 19: Global Shale Gas Industry Revenue billion Forecast, by Export Market Analysis (Value & Volume) 2020 & 2033
- Table 20: Global Shale Gas Industry Volume Trillion Forecast, by Export Market Analysis (Value & Volume) 2020 & 2033
- Table 21: Global Shale Gas Industry Revenue billion Forecast, by Price Trend Analysis 2020 & 2033
- Table 22: Global Shale Gas Industry Volume Trillion Forecast, by Price Trend Analysis 2020 & 2033
- Table 23: Global Shale Gas Industry Revenue billion Forecast, by Country 2020 & 2033
- Table 24: Global Shale Gas Industry Volume Trillion Forecast, by Country 2020 & 2033
- Table 25: United States Shale Gas Industry Revenue (billion) Forecast, by Application 2020 & 2033
- Table 26: United States Shale Gas Industry Volume (Trillion) Forecast, by Application 2020 & 2033
- Table 27: Canada Shale Gas Industry Revenue (billion) Forecast, by Application 2020 & 2033
- Table 28: Canada Shale Gas Industry Volume (Trillion) Forecast, by Application 2020 & 2033
- Table 29: Rest of North America Shale Gas Industry Revenue (billion) Forecast, by Application 2020 & 2033
- Table 30: Rest of North America Shale Gas Industry Volume (Trillion) Forecast, by Application 2020 & 2033
- Table 31: Global Shale Gas Industry Revenue billion Forecast, by Production Analysis 2020 & 2033
- Table 32: Global Shale Gas Industry Volume Trillion Forecast, by Production Analysis 2020 & 2033
- Table 33: Global Shale Gas Industry Revenue billion Forecast, by Consumption Analysis 2020 & 2033
- Table 34: Global Shale Gas Industry Volume Trillion Forecast, by Consumption Analysis 2020 & 2033
- Table 35: Global Shale Gas Industry Revenue billion Forecast, by Import Market Analysis (Value & Volume) 2020 & 2033
- Table 36: Global Shale Gas Industry Volume Trillion Forecast, by Import Market Analysis (Value & Volume) 2020 & 2033
- Table 37: Global Shale Gas Industry Revenue billion Forecast, by Export Market Analysis (Value & Volume) 2020 & 2033
- Table 38: Global Shale Gas Industry Volume Trillion Forecast, by Export Market Analysis (Value & Volume) 2020 & 2033
- Table 39: Global Shale Gas Industry Revenue billion Forecast, by Price Trend Analysis 2020 & 2033
- Table 40: Global Shale Gas Industry Volume Trillion Forecast, by Price Trend Analysis 2020 & 2033
- Table 41: Global Shale Gas Industry Revenue billion Forecast, by Country 2020 & 2033
- Table 42: Global Shale Gas Industry Volume Trillion Forecast, by Country 2020 & 2033
- Table 43: Brazil Shale Gas Industry Revenue (billion) Forecast, by Application 2020 & 2033
- Table 44: Brazil Shale Gas Industry Volume (Trillion) Forecast, by Application 2020 & 2033
- Table 45: Argentina Shale Gas Industry Revenue (billion) Forecast, by Application 2020 & 2033
- Table 46: Argentina Shale Gas Industry Volume (Trillion) Forecast, by Application 2020 & 2033
- Table 47: Chile Shale Gas Industry Revenue (billion) Forecast, by Application 2020 & 2033
- Table 48: Chile Shale Gas Industry Volume (Trillion) Forecast, by Application 2020 & 2033
- Table 49: Colombia Shale Gas Industry Revenue (billion) Forecast, by Application 2020 & 2033
- Table 50: Colombia Shale Gas Industry Volume (Trillion) Forecast, by Application 2020 & 2033
- Table 51: Rest of South America Shale Gas Industry Revenue (billion) Forecast, by Application 2020 & 2033
- Table 52: Rest of South America Shale Gas Industry Volume (Trillion) Forecast, by Application 2020 & 2033
- Table 53: Global Shale Gas Industry Revenue billion Forecast, by Production Analysis 2020 & 2033
- Table 54: Global Shale Gas Industry Volume Trillion Forecast, by Production Analysis 2020 & 2033
- Table 55: Global Shale Gas Industry Revenue billion Forecast, by Consumption Analysis 2020 & 2033
- Table 56: Global Shale Gas Industry Volume Trillion Forecast, by Consumption Analysis 2020 & 2033
- Table 57: Global Shale Gas Industry Revenue billion Forecast, by Import Market Analysis (Value & Volume) 2020 & 2033
- Table 58: Global Shale Gas Industry Volume Trillion Forecast, by Import Market Analysis (Value & Volume) 2020 & 2033
- Table 59: Global Shale Gas Industry Revenue billion Forecast, by Export Market Analysis (Value & Volume) 2020 & 2033
- Table 60: Global Shale Gas Industry Volume Trillion Forecast, by Export Market Analysis (Value & Volume) 2020 & 2033
- Table 61: Global Shale Gas Industry Revenue billion Forecast, by Price Trend Analysis 2020 & 2033
- Table 62: Global Shale Gas Industry Volume Trillion Forecast, by Price Trend Analysis 2020 & 2033
- Table 63: Global Shale Gas Industry Revenue billion Forecast, by Country 2020 & 2033
- Table 64: Global Shale Gas Industry Volume Trillion Forecast, by Country 2020 & 2033
- Table 65: China Shale Gas Industry Revenue (billion) Forecast, by Application 2020 & 2033
- Table 66: China Shale Gas Industry Volume (Trillion) Forecast, by Application 2020 & 2033
- Table 67: India Shale Gas Industry Revenue (billion) Forecast, by Application 2020 & 2033
- Table 68: India Shale Gas Industry Volume (Trillion) Forecast, by Application 2020 & 2033
- Table 69: Japan Shale Gas Industry Revenue (billion) Forecast, by Application 2020 & 2033
- Table 70: Japan Shale Gas Industry Volume (Trillion) Forecast, by Application 2020 & 2033
- Table 71: Australia Shale Gas Industry Revenue (billion) Forecast, by Application 2020 & 2033
- Table 72: Australia Shale Gas Industry Volume (Trillion) Forecast, by Application 2020 & 2033
- Table 73: Malaysia Shale Gas Industry Revenue (billion) Forecast, by Application 2020 & 2033
- Table 74: Malaysia Shale Gas Industry Volume (Trillion) Forecast, by Application 2020 & 2033
- Table 75: Thailand Shale Gas Industry Revenue (billion) Forecast, by Application 2020 & 2033
- Table 76: Thailand Shale Gas Industry Volume (Trillion) Forecast, by Application 2020 & 2033
- Table 77: Indonesia Shale Gas Industry Revenue (billion) Forecast, by Application 2020 & 2033
- Table 78: Indonesia Shale Gas Industry Volume (Trillion) Forecast, by Application 2020 & 2033
- Table 79: Vietnam Shale Gas Industry Revenue (billion) Forecast, by Application 2020 & 2033
- Table 80: Vietnam Shale Gas Industry Volume (Trillion) Forecast, by Application 2020 & 2033
- Table 81: Rest of Asia Pacific Shale Gas Industry Revenue (billion) Forecast, by Application 2020 & 2033
- Table 82: Rest of Asia Pacific Shale Gas Industry Volume (Trillion) Forecast, by Application 2020 & 2033
- Table 83: Global Shale Gas Industry Revenue billion Forecast, by Production Analysis 2020 & 2033
- Table 84: Global Shale Gas Industry Volume Trillion Forecast, by Production Analysis 2020 & 2033
- Table 85: Global Shale Gas Industry Revenue billion Forecast, by Consumption Analysis 2020 & 2033
- Table 86: Global Shale Gas Industry Volume Trillion Forecast, by Consumption Analysis 2020 & 2033
- Table 87: Global Shale Gas Industry Revenue billion Forecast, by Import Market Analysis (Value & Volume) 2020 & 2033
- Table 88: Global Shale Gas Industry Volume Trillion Forecast, by Import Market Analysis (Value & Volume) 2020 & 2033
- Table 89: Global Shale Gas Industry Revenue billion Forecast, by Export Market Analysis (Value & Volume) 2020 & 2033
- Table 90: Global Shale Gas Industry Volume Trillion Forecast, by Export Market Analysis (Value & Volume) 2020 & 2033
- Table 91: Global Shale Gas Industry Revenue billion Forecast, by Price Trend Analysis 2020 & 2033
- Table 92: Global Shale Gas Industry Volume Trillion Forecast, by Price Trend Analysis 2020 & 2033
- Table 93: Global Shale Gas Industry Revenue billion Forecast, by Country 2020 & 2033
- Table 94: Global Shale Gas Industry Volume Trillion Forecast, by Country 2020 & 2033
- Table 95: Germany Shale Gas Industry Revenue (billion) Forecast, by Application 2020 & 2033
- Table 96: Germany Shale Gas Industry Volume (Trillion) Forecast, by Application 2020 & 2033
- Table 97: France Shale Gas Industry Revenue (billion) Forecast, by Application 2020 & 2033
- Table 98: France Shale Gas Industry Volume (Trillion) Forecast, by Application 2020 & 2033
- Table 99: United Kingdom Shale Gas Industry Revenue (billion) Forecast, by Application 2020 & 2033
- Table 100: United Kingdom Shale Gas Industry Volume (Trillion) Forecast, by Application 2020 & 2033
- Table 101: Italy Shale Gas Industry Revenue (billion) Forecast, by Application 2020 & 2033
- Table 102: Italy Shale Gas Industry Volume (Trillion) Forecast, by Application 2020 & 2033
- Table 103: Spain Shale Gas Industry Revenue (billion) Forecast, by Application 2020 & 2033
- Table 104: Spain Shale Gas Industry Volume (Trillion) Forecast, by Application 2020 & 2033
- Table 105: NORDIC Shale Gas Industry Revenue (billion) Forecast, by Application 2020 & 2033
- Table 106: NORDIC Shale Gas Industry Volume (Trillion) Forecast, by Application 2020 & 2033
- Table 107: Turkey Shale Gas Industry Revenue (billion) Forecast, by Application 2020 & 2033
- Table 108: Turkey Shale Gas Industry Volume (Trillion) Forecast, by Application 2020 & 2033
- Table 109: Russia Shale Gas Industry Revenue (billion) Forecast, by Application 2020 & 2033
- Table 110: Russia Shale Gas Industry Volume (Trillion) Forecast, by Application 2020 & 2033
- Table 111: Rest of Europe Shale Gas Industry Revenue (billion) Forecast, by Application 2020 & 2033
- Table 112: Rest of Europe Shale Gas Industry Volume (Trillion) Forecast, by Application 2020 & 2033
- Table 113: Global Shale Gas Industry Revenue billion Forecast, by Production Analysis 2020 & 2033
- Table 114: Global Shale Gas Industry Volume Trillion Forecast, by Production Analysis 2020 & 2033
- Table 115: Global Shale Gas Industry Revenue billion Forecast, by Consumption Analysis 2020 & 2033
- Table 116: Global Shale Gas Industry Volume Trillion Forecast, by Consumption Analysis 2020 & 2033
- Table 117: Global Shale Gas Industry Revenue billion Forecast, by Import Market Analysis (Value & Volume) 2020 & 2033
- Table 118: Global Shale Gas Industry Volume Trillion Forecast, by Import Market Analysis (Value & Volume) 2020 & 2033
- Table 119: Global Shale Gas Industry Revenue billion Forecast, by Export Market Analysis (Value & Volume) 2020 & 2033
- Table 120: Global Shale Gas Industry Volume Trillion Forecast, by Export Market Analysis (Value & Volume) 2020 & 2033
- Table 121: Global Shale Gas Industry Revenue billion Forecast, by Price Trend Analysis 2020 & 2033
- Table 122: Global Shale Gas Industry Volume Trillion Forecast, by Price Trend Analysis 2020 & 2033
- Table 123: Global Shale Gas Industry Revenue billion Forecast, by Country 2020 & 2033
- Table 124: Global Shale Gas Industry Volume Trillion Forecast, by Country 2020 & 2033
- Table 125: United Arab Emirates Shale Gas Industry Revenue (billion) Forecast, by Application 2020 & 2033
- Table 126: United Arab Emirates Shale Gas Industry Volume (Trillion) Forecast, by Application 2020 & 2033
- Table 127: Saudi Arabia Shale Gas Industry Revenue (billion) Forecast, by Application 2020 & 2033
- Table 128: Saudi Arabia Shale Gas Industry Volume (Trillion) Forecast, by Application 2020 & 2033
- Table 129: Qatar Shale Gas Industry Revenue (billion) Forecast, by Application 2020 & 2033
- Table 130: Qatar Shale Gas Industry Volume (Trillion) Forecast, by Application 2020 & 2033
- Table 131: South Africa Shale Gas Industry Revenue (billion) Forecast, by Application 2020 & 2033
- Table 132: South Africa Shale Gas Industry Volume (Trillion) Forecast, by Application 2020 & 2033
- Table 133: Nigeria Shale Gas Industry Revenue (billion) Forecast, by Application 2020 & 2033
- Table 134: Nigeria Shale Gas Industry Volume (Trillion) Forecast, by Application 2020 & 2033
- Table 135: Egypt Shale Gas Industry Revenue (billion) Forecast, by Application 2020 & 2033
- Table 136: Egypt Shale Gas Industry Volume (Trillion) Forecast, by Application 2020 & 2033
Frequently Asked Questions
1. What is the projected Compound Annual Growth Rate (CAGR) of the Shale Gas Industry?
The projected CAGR is approximately 11.6%.
2. Which companies are prominent players in the Shale Gas Industry?
Key companies in the market include Equinor ASA, Shell PLC, Exxon Mobil Corporation, Southwestern Energy Company, Chesapeake Energy Corporation, PetroChina Company Limited, EQT Corporation, Chevron Corporation, ConocoPhillips Company, Pioneer Natural Resources*List Not Exhaustive 6 4 Market Player Ranking, China Petroleum & Chemical Corporation (SINOPEC), Antero Resources Corp, Repsol SA.
3. What are the main segments of the Shale Gas Industry?
The market segments include Production Analysis, Consumption Analysis, Import Market Analysis (Value & Volume), Export Market Analysis (Value & Volume), Price Trend Analysis.
4. Can you provide details about the market size?
The market size is estimated to be USD 100 billion as of 2022.
5. What are some drivers contributing to market growth?
4.; Proven Shale Gas Reserves 4.; Technological Advancement in Horizontal Drilling and Hydraulic Fracturing.
6. What are the notable trends driving market growth?
Increasing Environmental Concerns to Restrain the Market.
7. Are there any restraints impacting market growth?
4.; High Exploration Cost.
8. Can you provide examples of recent developments in the market?
In December 2023, the United Kingdom government announced a new package of actions to deliver on the government's manifesto affirmation to continue endowing the development of shale gas. The package comprises setting up a Shale Environmental Regulator and a new Planning Brokerage Service to focus exclusively on the planning process.
9. What pricing options are available for accessing the report?
Pricing options include single-user, multi-user, and enterprise licenses priced at USD 4750, USD 5250, and USD 8750 respectively.
10. Is the market size provided in terms of value or volume?
The market size is provided in terms of value, measured in billion and volume, measured in Trillion.
11. Are there any specific market keywords associated with the report?
Yes, the market keyword associated with the report is "Shale Gas Industry," which aids in identifying and referencing the specific market segment covered.
12. How do I determine which pricing option suits my needs best?
The pricing options vary based on user requirements and access needs. Individual users may opt for single-user licenses, while businesses requiring broader access may choose multi-user or enterprise licenses for cost-effective access to the report.
13. Are there any additional resources or data provided in the Shale Gas Industry report?
While the report offers comprehensive insights, it's advisable to review the specific contents or supplementary materials provided to ascertain if additional resources or data are available.
14. How can I stay updated on further developments or reports in the Shale Gas Industry?
To stay informed about further developments, trends, and reports in the Shale Gas Industry, consider subscribing to industry newsletters, following relevant companies and organizations, or regularly checking reputable industry news sources and publications.
Methodology
Step 1 - Identification of Relevant Samples Size from Population Database


Step 2 - Approaches for Defining Global Market Size (Value, Volume* & Price*)

Note*: In applicable scenarios
Step 3 - Data Sources
Primary Research
- Web Analytics
- Survey Reports
- Research Institute
- Latest Research Reports
- Opinion Leaders
Secondary Research
- Annual Reports
- White Paper
- Latest Press Release
- Industry Association
- Paid Database
- Investor Presentations

Step 4 - Data Triangulation
Involves using different sources of information in order to increase the validity of a study
These sources are likely to be stakeholders in a program - participants, other researchers, program staff, other community members, and so on.
Then we put all data in single framework & apply various statistical tools to find out the dynamic on the market.
During the analysis stage, feedback from the stakeholder groups would be compared to determine areas of agreement as well as areas of divergence