
Key Insights
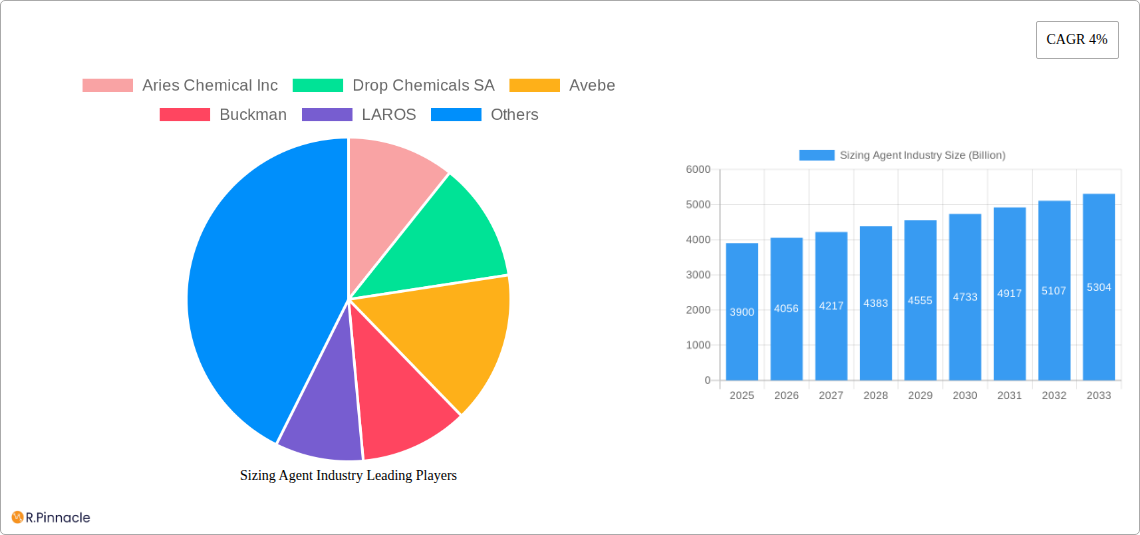
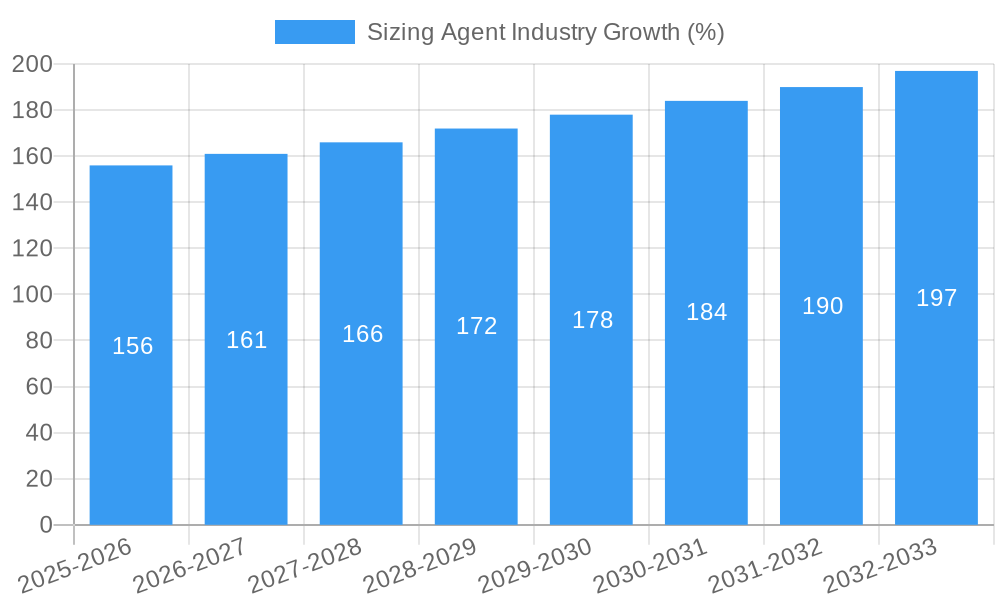
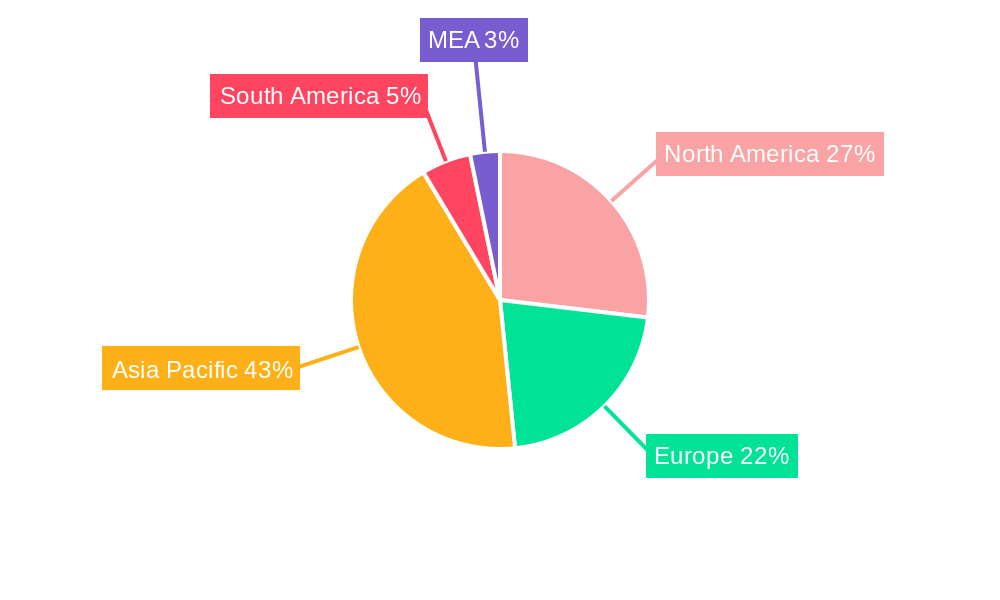
The global sizing agent market, valued at $3.9 billion in 2025, is projected to experience robust growth, driven by a compound annual growth rate (CAGR) of 4% from 2025 to 2033. This expansion is fueled by several key factors. The burgeoning textile and paper industries, particularly in developing economies like India and China, significantly contribute to demand. Increasing consumer demand for high-quality paper products and textiles necessitates the use of efficient sizing agents to enhance their strength, printability, and overall performance. Furthermore, the rising adoption of advanced sizing techniques, offering superior properties compared to conventional methods, is another crucial driver. Growth is also spurred by the increasing focus on sustainable and eco-friendly sizing agents derived from natural sources, aligning with growing environmental concerns within various industries including cosmetics and food processing. The market's segmentation across application (textiles, paper, cosmetics, food, construction, pharmaceuticals), type (natural, synthetic), technique (conventional, advanced), and form (liquid, powder, paste, granules) offers diverse growth opportunities for manufacturers. Regional variations in growth rates are expected, with Asia-Pacific likely to lead due to its rapidly industrializing economies and expanding manufacturing sectors.
However, the market faces certain restraints. Fluctuations in raw material prices, particularly for natural-based sizing agents, can impact production costs and profitability. Stricter environmental regulations regarding the use of certain chemical sizing agents could potentially limit market expansion in specific segments. Competition among established players and emerging companies necessitates continuous innovation and the development of superior, cost-effective, and environmentally responsible products to maintain market share. Despite these challenges, the overall outlook for the sizing agent market remains positive, driven by the expanding applications across various industries and the ongoing drive for enhanced product quality and sustainability. The market's substantial growth potential offers significant opportunities for both established and emerging players alike.
Sizing Agent Industry: A Comprehensive Market Report (2019-2033)
This in-depth report provides a comprehensive analysis of the global sizing agent industry, offering invaluable insights for industry professionals, investors, and strategic decision-makers. Valued at $XX Billion in 2025, the market is projected to experience significant growth, reaching $XX Billion by 2033, exhibiting a CAGR of XX% during the forecast period (2025-2033). The report covers the historical period (2019-2024), with 2025 serving as the base year and estimated year.
Sizing Agent Industry Market Structure & Innovation Trends
This section analyzes the competitive landscape of the sizing agent market, focusing on market concentration, innovation drivers, regulatory frameworks, and M&A activities. The market exhibits a moderately concentrated structure, with key players such as Aries Chemical Inc, Drop Chemicals SA, Avebe, Buckman, LAROS, Refnol Resins & Chemicals Ltd, Eco Polychem Pvt Ltd, Huixian Tiankai Paper Making Agent Co Ltd, Angel Starch & Food Private Limited, Harima Chemicals Group Inc, Associated Chemical, Finor Piplaj Chemical Limited, MATANGI INTERNATIONAL, Solenis, and Mare SpA holding significant market share. The combined market share of the top five players is estimated at XX%.
- Market Concentration: XX% held by top 5 players in 2025.
- Innovation Drivers: Growing demand for sustainable and high-performance sizing agents, advancements in material science, and stringent environmental regulations are driving innovation.
- Regulatory Frameworks: Varying regulations across regions impact the adoption of certain sizing agent types.
- Product Substitutes: Bio-based and biodegradable sizing agents are emerging as substitutes for conventional synthetic options.
- End-user Demographics: The textile & fiber industry remains a dominant end-user segment, followed by paper & paperboard and the cosmetics industry.
- M&A Activities: The past five years have witnessed XX Billion in M&A deals, indicating a trend of consolidation within the industry. Key deals included [mention specific notable M&A deals if data is available, otherwise, state "Data unavailable"].
Sizing Agent Industry Market Dynamics & Trends
The global sizing agent market is experiencing robust growth, driven by several key factors. Increasing demand from various end-use industries, particularly in emerging economies, fuels market expansion. Technological advancements in sizing agent formulations are improving product efficiency and performance. Consumer preferences are shifting towards sustainable and eco-friendly sizing agents, leading to increased demand for natural and biodegradable options. The competitive dynamics are characterized by both established players and emerging companies striving for market share through product innovation and strategic partnerships. The market is witnessing a growing trend toward advanced sizing techniques offering enhanced performance characteristics.
Dominant Regions & Segments in Sizing Agent Industry
The Asia-Pacific region dominates the global sizing agent market due to rapid industrialization and growth in end-use sectors like textiles and paper. Within applications, the Textile & Fiber segment holds the largest market share, driven by the booming textile industry in several regions. The Synthetic type segment enjoys greater adoption due to its cost-effectiveness and performance advantages. Conventional sizing techniques still represent the largest share, though Advanced Sizing techniques are gaining traction due to their superior properties. Liquid form is the most preferred form, owing to its ease of handling and application.
- Key Drivers for Asia-Pacific Dominance:
- Rapid industrialization and economic growth.
- Expanding textile and paper industries.
- Favorable government policies supporting manufacturing.
- Increasing disposable incomes leading to greater consumption.
Sizing Agent Industry Product Innovations
Recent years have seen significant innovations in sizing agent technology, including the development of bio-based and biodegradable sizing agents, aimed at addressing environmental concerns. Advanced sizing techniques, such as nano-sizing and micro-encapsulation, are improving the performance and efficiency of sizing agents, leading to superior product quality and reduced costs. These innovations cater to the growing demand for sustainable and high-performance sizing agents across various applications, improving market fit and competitive advantage.
Report Scope & Segmentation Analysis
This report offers a detailed segmentation analysis of the sizing agent market based on application (Textile & Fiber, Paper & Paperboard, Cosmetics, Food & Beverage, Construction, Pharmaceuticals, Cosmetics & Personal Care, Others), type (Natural, Synthetic), technique (Conventional Sizing, Advanced Sizing), and form (Liquid, Powder, Paste, Granules). Each segment's growth projections, market size, and competitive dynamics are thoroughly examined, providing insights into the evolving market landscape. For example, the Textile & Fiber segment is projected to exhibit strong growth driven by increasing textile production.
Key Drivers of Sizing Agent Industry Growth
The Sizing Agent industry's growth is driven by several factors. The increasing demand for high-performance materials in various industries necessitates efficient sizing agents. Advancements in sizing agent technology continuously improve their effectiveness. Stringent environmental regulations are pushing the adoption of eco-friendly and sustainable sizing agents, accelerating market expansion. Economic growth in developing countries also fuels demand for these crucial processing aids.
Challenges in the Sizing Agent Industry Sector
The sizing agent industry faces several challenges, including fluctuating raw material prices, which impact production costs and profitability. Stringent environmental regulations necessitate investments in eco-friendly technologies, adding to operational expenses. Intense competition among established players and emerging companies exerts significant pressure on pricing and profitability. Supply chain disruptions due to geopolitical factors and pandemics can also affect market stability. The impact of these factors is estimated to be a XX% reduction in growth in specific instances.
Emerging Opportunities in Sizing Agent Industry
The market presents several promising opportunities. The growing demand for sustainable and biodegradable sizing agents presents a key opportunity for manufacturers. Advancements in nanotechnology and other advanced technologies can lead to the development of innovative sizing agents with enhanced properties. Expansion into emerging markets, particularly in developing countries, offers significant growth potential. Strategic collaborations and partnerships can leverage technological advancements and market access.
Leading Players in the Sizing Agent Industry Market
- Aries Chemical Inc
- Drop Chemicals SA
- Avebe
- Buckman
- LAROS
- Refnol Resins & Chemicals Ltd
- Eco Polychem Pvt Ltd
- Huixian Tiankai Paper Making Agent Co Ltd
- Angel Starch & Food Private Limited
- Harima Chemicals Group Inc
- Associated Chemical
- Finor Piplaj Chemical Limited
- MATANGI INTERNATIONAL
- Solenis
- Mare SpA
Key Developments in Sizing Agent Industry
- 2022 Q4: [Insert specific development with impact description, if data is available; otherwise, state “Data unavailable.”]
- 2023 Q1: [Insert specific development with impact description, if data is available; otherwise, state “Data unavailable.”]
- 2023 Q3: [Insert specific development with impact description, if data is available; otherwise, state “Data unavailable.”]
Future Outlook for Sizing Agent Industry Market
The future of the sizing agent industry appears bright, driven by continuous innovation and increasing demand from various end-use sectors. The market is expected to witness robust growth, propelled by the adoption of sustainable and high-performance sizing agents. Strategic collaborations, technological advancements, and expansion into new markets are set to shape the future landscape of this dynamic industry. Opportunities abound for companies that embrace innovation and sustainability, positioning themselves for substantial growth.
Sizing Agent Industry Segmentation
-
1. Type
- 1.1. Natural
- 1.2. Synthetic
-
2. Application
- 2.1. Textiles
- 2.2. Paper and Paper Board
- 2.3. Food and Beverage
- 2.4. Other Applications
Sizing Agent Industry Segmentation By Geography
-
1. Asia Pacific
- 1.1. China
- 1.2. India
- 1.3. Japan
- 1.4. South Korea
- 1.5. Rest of Asia Pacific
-
2. North America
- 2.1. United States
- 2.2. Canada
- 2.3. Mexico
-
3. Europe
- 3.1. Germany
- 3.2. United Kingdom
- 3.3. Italy
- 3.4. France
- 3.5. Rest of Europe
-
4. South America
- 4.1. Brazil
- 4.2. Argentina
- 4.3. Rest of South America
-
5. Middle East and Africa
- 5.1. Saudi Arabia
- 5.2. South Africa
- 5.3. Rest of Middle East and Africa
Sizing Agent Industry REPORT HIGHLIGHTS
| Aspects | Details |
|---|---|
| Study Period | 2019-2033 |
| Base Year | 2024 |
| Estimated Year | 2025 |
| Forecast Period | 2025-2033 |
| Historical Period | 2019-2024 |
| Growth Rate | CAGR of 4% from 2019-2033 |
| Segmentation |
|
Table of Contents
- 1. Introduction
- 1.1. Research Scope
- 1.2. Market Segmentation
- 1.3. Research Methodology
- 1.4. Definitions and Assumptions
- 2. Executive Summary
- 2.1. Introduction
- 3. Market Dynamics
- 3.1. Introduction
- 3.2. Market Drivers
- 3.2.1. ; Growing Demand from the Textile Industry; Increasing Demand from the Paper Manufacturing Industries
- 3.3. Market Restrains
- 3.3.1. ; Stringent Environmental Regulations; Unfavorable Conditions Arising Due to the COVID-19 Outbreak
- 3.4. Market Trends
- 3.4.1. Growing Demand from the Textile Manufacturing Industry
- 4. Market Factor Analysis
- 4.1. Porters Five Forces
- 4.2. Supply/Value Chain
- 4.3. PESTEL analysis
- 4.4. Market Entropy
- 4.5. Patent/Trademark Analysis
- 5. Global Sizing Agent Industry Analysis, Insights and Forecast, 2019-2031
- 5.1. Market Analysis, Insights and Forecast - by Type
- 5.1.1. Natural
- 5.1.2. Synthetic
- 5.2. Market Analysis, Insights and Forecast - by Application
- 5.2.1. Textiles
- 5.2.2. Paper and Paper Board
- 5.2.3. Food and Beverage
- 5.2.4. Other Applications
- 5.3. Market Analysis, Insights and Forecast - by Region
- 5.3.1. Asia Pacific
- 5.3.2. North America
- 5.3.3. Europe
- 5.3.4. South America
- 5.3.5. Middle East and Africa
- 5.1. Market Analysis, Insights and Forecast - by Type
- 6. Asia Pacific Sizing Agent Industry Analysis, Insights and Forecast, 2019-2031
- 6.1. Market Analysis, Insights and Forecast - by Type
- 6.1.1. Natural
- 6.1.2. Synthetic
- 6.2. Market Analysis, Insights and Forecast - by Application
- 6.2.1. Textiles
- 6.2.2. Paper and Paper Board
- 6.2.3. Food and Beverage
- 6.2.4. Other Applications
- 6.1. Market Analysis, Insights and Forecast - by Type
- 7. North America Sizing Agent Industry Analysis, Insights and Forecast, 2019-2031
- 7.1. Market Analysis, Insights and Forecast - by Type
- 7.1.1. Natural
- 7.1.2. Synthetic
- 7.2. Market Analysis, Insights and Forecast - by Application
- 7.2.1. Textiles
- 7.2.2. Paper and Paper Board
- 7.2.3. Food and Beverage
- 7.2.4. Other Applications
- 7.1. Market Analysis, Insights and Forecast - by Type
- 8. Europe Sizing Agent Industry Analysis, Insights and Forecast, 2019-2031
- 8.1. Market Analysis, Insights and Forecast - by Type
- 8.1.1. Natural
- 8.1.2. Synthetic
- 8.2. Market Analysis, Insights and Forecast - by Application
- 8.2.1. Textiles
- 8.2.2. Paper and Paper Board
- 8.2.3. Food and Beverage
- 8.2.4. Other Applications
- 8.1. Market Analysis, Insights and Forecast - by Type
- 9. South America Sizing Agent Industry Analysis, Insights and Forecast, 2019-2031
- 9.1. Market Analysis, Insights and Forecast - by Type
- 9.1.1. Natural
- 9.1.2. Synthetic
- 9.2. Market Analysis, Insights and Forecast - by Application
- 9.2.1. Textiles
- 9.2.2. Paper and Paper Board
- 9.2.3. Food and Beverage
- 9.2.4. Other Applications
- 9.1. Market Analysis, Insights and Forecast - by Type
- 10. Middle East and Africa Sizing Agent Industry Analysis, Insights and Forecast, 2019-2031
- 10.1. Market Analysis, Insights and Forecast - by Type
- 10.1.1. Natural
- 10.1.2. Synthetic
- 10.2. Market Analysis, Insights and Forecast - by Application
- 10.2.1. Textiles
- 10.2.2. Paper and Paper Board
- 10.2.3. Food and Beverage
- 10.2.4. Other Applications
- 10.1. Market Analysis, Insights and Forecast - by Type
- 11. North America Sizing Agent Industry Analysis, Insights and Forecast, 2019-2031
- 11.1. Market Analysis, Insights and Forecast - By Country/Sub-region
- 11.1.1 United States
- 11.1.2 Canada
- 11.1.3 Mexico
- 12. Europe Sizing Agent Industry Analysis, Insights and Forecast, 2019-2031
- 12.1. Market Analysis, Insights and Forecast - By Country/Sub-region
- 12.1.1 Germany
- 12.1.2 France
- 12.1.3 Italy
- 12.1.4 United Kingdom
- 12.1.5 Netherlands
- 12.1.6 Rest of Europe
- 13. Asia Pacific Sizing Agent Industry Analysis, Insights and Forecast, 2019-2031
- 13.1. Market Analysis, Insights and Forecast - By Country/Sub-region
- 13.1.1 China
- 13.1.2 Japan
- 13.1.3 India
- 13.1.4 South Korea
- 13.1.5 Taiwan
- 13.1.6 Australia
- 13.1.7 Rest of Asia-Pacific
- 14. South America Sizing Agent Industry Analysis, Insights and Forecast, 2019-2031
- 14.1. Market Analysis, Insights and Forecast - By Country/Sub-region
- 14.1.1 Brazil
- 14.1.2 Argentina
- 14.1.3 Rest of South America
- 15. MEA Sizing Agent Industry Analysis, Insights and Forecast, 2019-2031
- 15.1. Market Analysis, Insights and Forecast - By Country/Sub-region
- 15.1.1 Middle East
- 15.1.2 Africa
- 16. Competitive Analysis
- 16.1. Global Market Share Analysis 2024
- 16.2. Company Profiles
- 16.2.1 Aries Chemical Inc
- 16.2.1.1. Overview
- 16.2.1.2. Products
- 16.2.1.3. SWOT Analysis
- 16.2.1.4. Recent Developments
- 16.2.1.5. Financials (Based on Availability)
- 16.2.2 Drop Chemicals SA
- 16.2.2.1. Overview
- 16.2.2.2. Products
- 16.2.2.3. SWOT Analysis
- 16.2.2.4. Recent Developments
- 16.2.2.5. Financials (Based on Availability)
- 16.2.3 Avebe
- 16.2.3.1. Overview
- 16.2.3.2. Products
- 16.2.3.3. SWOT Analysis
- 16.2.3.4. Recent Developments
- 16.2.3.5. Financials (Based on Availability)
- 16.2.4 Buckman
- 16.2.4.1. Overview
- 16.2.4.2. Products
- 16.2.4.3. SWOT Analysis
- 16.2.4.4. Recent Developments
- 16.2.4.5. Financials (Based on Availability)
- 16.2.5 LAROS
- 16.2.5.1. Overview
- 16.2.5.2. Products
- 16.2.5.3. SWOT Analysis
- 16.2.5.4. Recent Developments
- 16.2.5.5. Financials (Based on Availability)
- 16.2.6 Refnol Resins & Chemicals Ltd
- 16.2.6.1. Overview
- 16.2.6.2. Products
- 16.2.6.3. SWOT Analysis
- 16.2.6.4. Recent Developments
- 16.2.6.5. Financials (Based on Availability)
- 16.2.7 Eco Polychem Pvt Ltd
- 16.2.7.1. Overview
- 16.2.7.2. Products
- 16.2.7.3. SWOT Analysis
- 16.2.7.4. Recent Developments
- 16.2.7.5. Financials (Based on Availability)
- 16.2.8 Huixian Tiankai Paper Making Agent Co Ltd
- 16.2.8.1. Overview
- 16.2.8.2. Products
- 16.2.8.3. SWOT Analysis
- 16.2.8.4. Recent Developments
- 16.2.8.5. Financials (Based on Availability)
- 16.2.9 Angel Starch & Food Private Limited
- 16.2.9.1. Overview
- 16.2.9.2. Products
- 16.2.9.3. SWOT Analysis
- 16.2.9.4. Recent Developments
- 16.2.9.5. Financials (Based on Availability)
- 16.2.10 Harima Chemicals Group Inc
- 16.2.10.1. Overview
- 16.2.10.2. Products
- 16.2.10.3. SWOT Analysis
- 16.2.10.4. Recent Developments
- 16.2.10.5. Financials (Based on Availability)
- 16.2.11 Associated Chemical
- 16.2.11.1. Overview
- 16.2.11.2. Products
- 16.2.11.3. SWOT Analysis
- 16.2.11.4. Recent Developments
- 16.2.11.5. Financials (Based on Availability)
- 16.2.12 Finor Piplaj Chemical Limited
- 16.2.12.1. Overview
- 16.2.12.2. Products
- 16.2.12.3. SWOT Analysis
- 16.2.12.4. Recent Developments
- 16.2.12.5. Financials (Based on Availability)
- 16.2.13 MATANGI INTERNATIONAL
- 16.2.13.1. Overview
- 16.2.13.2. Products
- 16.2.13.3. SWOT Analysis
- 16.2.13.4. Recent Developments
- 16.2.13.5. Financials (Based on Availability)
- 16.2.14 Solenis
- 16.2.14.1. Overview
- 16.2.14.2. Products
- 16.2.14.3. SWOT Analysis
- 16.2.14.4. Recent Developments
- 16.2.14.5. Financials (Based on Availability)
- 16.2.15 Mare SpA
- 16.2.15.1. Overview
- 16.2.15.2. Products
- 16.2.15.3. SWOT Analysis
- 16.2.15.4. Recent Developments
- 16.2.15.5. Financials (Based on Availability)
- 16.2.1 Aries Chemical Inc
List of Figures
- Figure 1: Global Sizing Agent Industry Revenue Breakdown (Billion, %) by Region 2024 & 2032
- Figure 2: Global Sizing Agent Industry Volume Breakdown (K Tons, %) by Region 2024 & 2032
- Figure 3: North America Sizing Agent Industry Revenue (Billion), by Country 2024 & 2032
- Figure 4: North America Sizing Agent Industry Volume (K Tons), by Country 2024 & 2032
- Figure 5: North America Sizing Agent Industry Revenue Share (%), by Country 2024 & 2032
- Figure 6: North America Sizing Agent Industry Volume Share (%), by Country 2024 & 2032
- Figure 7: Europe Sizing Agent Industry Revenue (Billion), by Country 2024 & 2032
- Figure 8: Europe Sizing Agent Industry Volume (K Tons), by Country 2024 & 2032
- Figure 9: Europe Sizing Agent Industry Revenue Share (%), by Country 2024 & 2032
- Figure 10: Europe Sizing Agent Industry Volume Share (%), by Country 2024 & 2032
- Figure 11: Asia Pacific Sizing Agent Industry Revenue (Billion), by Country 2024 & 2032
- Figure 12: Asia Pacific Sizing Agent Industry Volume (K Tons), by Country 2024 & 2032
- Figure 13: Asia Pacific Sizing Agent Industry Revenue Share (%), by Country 2024 & 2032
- Figure 14: Asia Pacific Sizing Agent Industry Volume Share (%), by Country 2024 & 2032
- Figure 15: South America Sizing Agent Industry Revenue (Billion), by Country 2024 & 2032
- Figure 16: South America Sizing Agent Industry Volume (K Tons), by Country 2024 & 2032
- Figure 17: South America Sizing Agent Industry Revenue Share (%), by Country 2024 & 2032
- Figure 18: South America Sizing Agent Industry Volume Share (%), by Country 2024 & 2032
- Figure 19: MEA Sizing Agent Industry Revenue (Billion), by Country 2024 & 2032
- Figure 20: MEA Sizing Agent Industry Volume (K Tons), by Country 2024 & 2032
- Figure 21: MEA Sizing Agent Industry Revenue Share (%), by Country 2024 & 2032
- Figure 22: MEA Sizing Agent Industry Volume Share (%), by Country 2024 & 2032
- Figure 23: Asia Pacific Sizing Agent Industry Revenue (Billion), by Type 2024 & 2032
- Figure 24: Asia Pacific Sizing Agent Industry Volume (K Tons), by Type 2024 & 2032
- Figure 25: Asia Pacific Sizing Agent Industry Revenue Share (%), by Type 2024 & 2032
- Figure 26: Asia Pacific Sizing Agent Industry Volume Share (%), by Type 2024 & 2032
- Figure 27: Asia Pacific Sizing Agent Industry Revenue (Billion), by Application 2024 & 2032
- Figure 28: Asia Pacific Sizing Agent Industry Volume (K Tons), by Application 2024 & 2032
- Figure 29: Asia Pacific Sizing Agent Industry Revenue Share (%), by Application 2024 & 2032
- Figure 30: Asia Pacific Sizing Agent Industry Volume Share (%), by Application 2024 & 2032
- Figure 31: Asia Pacific Sizing Agent Industry Revenue (Billion), by Country 2024 & 2032
- Figure 32: Asia Pacific Sizing Agent Industry Volume (K Tons), by Country 2024 & 2032
- Figure 33: Asia Pacific Sizing Agent Industry Revenue Share (%), by Country 2024 & 2032
- Figure 34: Asia Pacific Sizing Agent Industry Volume Share (%), by Country 2024 & 2032
- Figure 35: North America Sizing Agent Industry Revenue (Billion), by Type 2024 & 2032
- Figure 36: North America Sizing Agent Industry Volume (K Tons), by Type 2024 & 2032
- Figure 37: North America Sizing Agent Industry Revenue Share (%), by Type 2024 & 2032
- Figure 38: North America Sizing Agent Industry Volume Share (%), by Type 2024 & 2032
- Figure 39: North America Sizing Agent Industry Revenue (Billion), by Application 2024 & 2032
- Figure 40: North America Sizing Agent Industry Volume (K Tons), by Application 2024 & 2032
- Figure 41: North America Sizing Agent Industry Revenue Share (%), by Application 2024 & 2032
- Figure 42: North America Sizing Agent Industry Volume Share (%), by Application 2024 & 2032
- Figure 43: North America Sizing Agent Industry Revenue (Billion), by Country 2024 & 2032
- Figure 44: North America Sizing Agent Industry Volume (K Tons), by Country 2024 & 2032
- Figure 45: North America Sizing Agent Industry Revenue Share (%), by Country 2024 & 2032
- Figure 46: North America Sizing Agent Industry Volume Share (%), by Country 2024 & 2032
- Figure 47: Europe Sizing Agent Industry Revenue (Billion), by Type 2024 & 2032
- Figure 48: Europe Sizing Agent Industry Volume (K Tons), by Type 2024 & 2032
- Figure 49: Europe Sizing Agent Industry Revenue Share (%), by Type 2024 & 2032
- Figure 50: Europe Sizing Agent Industry Volume Share (%), by Type 2024 & 2032
- Figure 51: Europe Sizing Agent Industry Revenue (Billion), by Application 2024 & 2032
- Figure 52: Europe Sizing Agent Industry Volume (K Tons), by Application 2024 & 2032
- Figure 53: Europe Sizing Agent Industry Revenue Share (%), by Application 2024 & 2032
- Figure 54: Europe Sizing Agent Industry Volume Share (%), by Application 2024 & 2032
- Figure 55: Europe Sizing Agent Industry Revenue (Billion), by Country 2024 & 2032
- Figure 56: Europe Sizing Agent Industry Volume (K Tons), by Country 2024 & 2032
- Figure 57: Europe Sizing Agent Industry Revenue Share (%), by Country 2024 & 2032
- Figure 58: Europe Sizing Agent Industry Volume Share (%), by Country 2024 & 2032
- Figure 59: South America Sizing Agent Industry Revenue (Billion), by Type 2024 & 2032
- Figure 60: South America Sizing Agent Industry Volume (K Tons), by Type 2024 & 2032
- Figure 61: South America Sizing Agent Industry Revenue Share (%), by Type 2024 & 2032
- Figure 62: South America Sizing Agent Industry Volume Share (%), by Type 2024 & 2032
- Figure 63: South America Sizing Agent Industry Revenue (Billion), by Application 2024 & 2032
- Figure 64: South America Sizing Agent Industry Volume (K Tons), by Application 2024 & 2032
- Figure 65: South America Sizing Agent Industry Revenue Share (%), by Application 2024 & 2032
- Figure 66: South America Sizing Agent Industry Volume Share (%), by Application 2024 & 2032
- Figure 67: South America Sizing Agent Industry Revenue (Billion), by Country 2024 & 2032
- Figure 68: South America Sizing Agent Industry Volume (K Tons), by Country 2024 & 2032
- Figure 69: South America Sizing Agent Industry Revenue Share (%), by Country 2024 & 2032
- Figure 70: South America Sizing Agent Industry Volume Share (%), by Country 2024 & 2032
- Figure 71: Middle East and Africa Sizing Agent Industry Revenue (Billion), by Type 2024 & 2032
- Figure 72: Middle East and Africa Sizing Agent Industry Volume (K Tons), by Type 2024 & 2032
- Figure 73: Middle East and Africa Sizing Agent Industry Revenue Share (%), by Type 2024 & 2032
- Figure 74: Middle East and Africa Sizing Agent Industry Volume Share (%), by Type 2024 & 2032
- Figure 75: Middle East and Africa Sizing Agent Industry Revenue (Billion), by Application 2024 & 2032
- Figure 76: Middle East and Africa Sizing Agent Industry Volume (K Tons), by Application 2024 & 2032
- Figure 77: Middle East and Africa Sizing Agent Industry Revenue Share (%), by Application 2024 & 2032
- Figure 78: Middle East and Africa Sizing Agent Industry Volume Share (%), by Application 2024 & 2032
- Figure 79: Middle East and Africa Sizing Agent Industry Revenue (Billion), by Country 2024 & 2032
- Figure 80: Middle East and Africa Sizing Agent Industry Volume (K Tons), by Country 2024 & 2032
- Figure 81: Middle East and Africa Sizing Agent Industry Revenue Share (%), by Country 2024 & 2032
- Figure 82: Middle East and Africa Sizing Agent Industry Volume Share (%), by Country 2024 & 2032
List of Tables
- Table 1: Global Sizing Agent Industry Revenue Billion Forecast, by Region 2019 & 2032
- Table 2: Global Sizing Agent Industry Volume K Tons Forecast, by Region 2019 & 2032
- Table 3: Global Sizing Agent Industry Revenue Billion Forecast, by Type 2019 & 2032
- Table 4: Global Sizing Agent Industry Volume K Tons Forecast, by Type 2019 & 2032
- Table 5: Global Sizing Agent Industry Revenue Billion Forecast, by Application 2019 & 2032
- Table 6: Global Sizing Agent Industry Volume K Tons Forecast, by Application 2019 & 2032
- Table 7: Global Sizing Agent Industry Revenue Billion Forecast, by Region 2019 & 2032
- Table 8: Global Sizing Agent Industry Volume K Tons Forecast, by Region 2019 & 2032
- Table 9: Global Sizing Agent Industry Revenue Billion Forecast, by Country 2019 & 2032
- Table 10: Global Sizing Agent Industry Volume K Tons Forecast, by Country 2019 & 2032
- Table 11: United States Sizing Agent Industry Revenue (Billion) Forecast, by Application 2019 & 2032
- Table 12: United States Sizing Agent Industry Volume (K Tons) Forecast, by Application 2019 & 2032
- Table 13: Canada Sizing Agent Industry Revenue (Billion) Forecast, by Application 2019 & 2032
- Table 14: Canada Sizing Agent Industry Volume (K Tons) Forecast, by Application 2019 & 2032
- Table 15: Mexico Sizing Agent Industry Revenue (Billion) Forecast, by Application 2019 & 2032
- Table 16: Mexico Sizing Agent Industry Volume (K Tons) Forecast, by Application 2019 & 2032
- Table 17: Global Sizing Agent Industry Revenue Billion Forecast, by Country 2019 & 2032
- Table 18: Global Sizing Agent Industry Volume K Tons Forecast, by Country 2019 & 2032
- Table 19: Germany Sizing Agent Industry Revenue (Billion) Forecast, by Application 2019 & 2032
- Table 20: Germany Sizing Agent Industry Volume (K Tons) Forecast, by Application 2019 & 2032
- Table 21: France Sizing Agent Industry Revenue (Billion) Forecast, by Application 2019 & 2032
- Table 22: France Sizing Agent Industry Volume (K Tons) Forecast, by Application 2019 & 2032
- Table 23: Italy Sizing Agent Industry Revenue (Billion) Forecast, by Application 2019 & 2032
- Table 24: Italy Sizing Agent Industry Volume (K Tons) Forecast, by Application 2019 & 2032
- Table 25: United Kingdom Sizing Agent Industry Revenue (Billion) Forecast, by Application 2019 & 2032
- Table 26: United Kingdom Sizing Agent Industry Volume (K Tons) Forecast, by Application 2019 & 2032
- Table 27: Netherlands Sizing Agent Industry Revenue (Billion) Forecast, by Application 2019 & 2032
- Table 28: Netherlands Sizing Agent Industry Volume (K Tons) Forecast, by Application 2019 & 2032
- Table 29: Rest of Europe Sizing Agent Industry Revenue (Billion) Forecast, by Application 2019 & 2032
- Table 30: Rest of Europe Sizing Agent Industry Volume (K Tons) Forecast, by Application 2019 & 2032
- Table 31: Global Sizing Agent Industry Revenue Billion Forecast, by Country 2019 & 2032
- Table 32: Global Sizing Agent Industry Volume K Tons Forecast, by Country 2019 & 2032
- Table 33: China Sizing Agent Industry Revenue (Billion) Forecast, by Application 2019 & 2032
- Table 34: China Sizing Agent Industry Volume (K Tons) Forecast, by Application 2019 & 2032
- Table 35: Japan Sizing Agent Industry Revenue (Billion) Forecast, by Application 2019 & 2032
- Table 36: Japan Sizing Agent Industry Volume (K Tons) Forecast, by Application 2019 & 2032
- Table 37: India Sizing Agent Industry Revenue (Billion) Forecast, by Application 2019 & 2032
- Table 38: India Sizing Agent Industry Volume (K Tons) Forecast, by Application 2019 & 2032
- Table 39: South Korea Sizing Agent Industry Revenue (Billion) Forecast, by Application 2019 & 2032
- Table 40: South Korea Sizing Agent Industry Volume (K Tons) Forecast, by Application 2019 & 2032
- Table 41: Taiwan Sizing Agent Industry Revenue (Billion) Forecast, by Application 2019 & 2032
- Table 42: Taiwan Sizing Agent Industry Volume (K Tons) Forecast, by Application 2019 & 2032
- Table 43: Australia Sizing Agent Industry Revenue (Billion) Forecast, by Application 2019 & 2032
- Table 44: Australia Sizing Agent Industry Volume (K Tons) Forecast, by Application 2019 & 2032
- Table 45: Rest of Asia-Pacific Sizing Agent Industry Revenue (Billion) Forecast, by Application 2019 & 2032
- Table 46: Rest of Asia-Pacific Sizing Agent Industry Volume (K Tons) Forecast, by Application 2019 & 2032
- Table 47: Global Sizing Agent Industry Revenue Billion Forecast, by Country 2019 & 2032
- Table 48: Global Sizing Agent Industry Volume K Tons Forecast, by Country 2019 & 2032
- Table 49: Brazil Sizing Agent Industry Revenue (Billion) Forecast, by Application 2019 & 2032
- Table 50: Brazil Sizing Agent Industry Volume (K Tons) Forecast, by Application 2019 & 2032
- Table 51: Argentina Sizing Agent Industry Revenue (Billion) Forecast, by Application 2019 & 2032
- Table 52: Argentina Sizing Agent Industry Volume (K Tons) Forecast, by Application 2019 & 2032
- Table 53: Rest of South America Sizing Agent Industry Revenue (Billion) Forecast, by Application 2019 & 2032
- Table 54: Rest of South America Sizing Agent Industry Volume (K Tons) Forecast, by Application 2019 & 2032
- Table 55: Global Sizing Agent Industry Revenue Billion Forecast, by Country 2019 & 2032
- Table 56: Global Sizing Agent Industry Volume K Tons Forecast, by Country 2019 & 2032
- Table 57: Middle East Sizing Agent Industry Revenue (Billion) Forecast, by Application 2019 & 2032
- Table 58: Middle East Sizing Agent Industry Volume (K Tons) Forecast, by Application 2019 & 2032
- Table 59: Africa Sizing Agent Industry Revenue (Billion) Forecast, by Application 2019 & 2032
- Table 60: Africa Sizing Agent Industry Volume (K Tons) Forecast, by Application 2019 & 2032
- Table 61: Global Sizing Agent Industry Revenue Billion Forecast, by Type 2019 & 2032
- Table 62: Global Sizing Agent Industry Volume K Tons Forecast, by Type 2019 & 2032
- Table 63: Global Sizing Agent Industry Revenue Billion Forecast, by Application 2019 & 2032
- Table 64: Global Sizing Agent Industry Volume K Tons Forecast, by Application 2019 & 2032
- Table 65: Global Sizing Agent Industry Revenue Billion Forecast, by Country 2019 & 2032
- Table 66: Global Sizing Agent Industry Volume K Tons Forecast, by Country 2019 & 2032
- Table 67: China Sizing Agent Industry Revenue (Billion) Forecast, by Application 2019 & 2032
- Table 68: China Sizing Agent Industry Volume (K Tons) Forecast, by Application 2019 & 2032
- Table 69: India Sizing Agent Industry Revenue (Billion) Forecast, by Application 2019 & 2032
- Table 70: India Sizing Agent Industry Volume (K Tons) Forecast, by Application 2019 & 2032
- Table 71: Japan Sizing Agent Industry Revenue (Billion) Forecast, by Application 2019 & 2032
- Table 72: Japan Sizing Agent Industry Volume (K Tons) Forecast, by Application 2019 & 2032
- Table 73: South Korea Sizing Agent Industry Revenue (Billion) Forecast, by Application 2019 & 2032
- Table 74: South Korea Sizing Agent Industry Volume (K Tons) Forecast, by Application 2019 & 2032
- Table 75: Rest of Asia Pacific Sizing Agent Industry Revenue (Billion) Forecast, by Application 2019 & 2032
- Table 76: Rest of Asia Pacific Sizing Agent Industry Volume (K Tons) Forecast, by Application 2019 & 2032
- Table 77: Global Sizing Agent Industry Revenue Billion Forecast, by Type 2019 & 2032
- Table 78: Global Sizing Agent Industry Volume K Tons Forecast, by Type 2019 & 2032
- Table 79: Global Sizing Agent Industry Revenue Billion Forecast, by Application 2019 & 2032
- Table 80: Global Sizing Agent Industry Volume K Tons Forecast, by Application 2019 & 2032
- Table 81: Global Sizing Agent Industry Revenue Billion Forecast, by Country 2019 & 2032
- Table 82: Global Sizing Agent Industry Volume K Tons Forecast, by Country 2019 & 2032
- Table 83: United States Sizing Agent Industry Revenue (Billion) Forecast, by Application 2019 & 2032
- Table 84: United States Sizing Agent Industry Volume (K Tons) Forecast, by Application 2019 & 2032
- Table 85: Canada Sizing Agent Industry Revenue (Billion) Forecast, by Application 2019 & 2032
- Table 86: Canada Sizing Agent Industry Volume (K Tons) Forecast, by Application 2019 & 2032
- Table 87: Mexico Sizing Agent Industry Revenue (Billion) Forecast, by Application 2019 & 2032
- Table 88: Mexico Sizing Agent Industry Volume (K Tons) Forecast, by Application 2019 & 2032
- Table 89: Global Sizing Agent Industry Revenue Billion Forecast, by Type 2019 & 2032
- Table 90: Global Sizing Agent Industry Volume K Tons Forecast, by Type 2019 & 2032
- Table 91: Global Sizing Agent Industry Revenue Billion Forecast, by Application 2019 & 2032
- Table 92: Global Sizing Agent Industry Volume K Tons Forecast, by Application 2019 & 2032
- Table 93: Global Sizing Agent Industry Revenue Billion Forecast, by Country 2019 & 2032
- Table 94: Global Sizing Agent Industry Volume K Tons Forecast, by Country 2019 & 2032
- Table 95: Germany Sizing Agent Industry Revenue (Billion) Forecast, by Application 2019 & 2032
- Table 96: Germany Sizing Agent Industry Volume (K Tons) Forecast, by Application 2019 & 2032
- Table 97: United Kingdom Sizing Agent Industry Revenue (Billion) Forecast, by Application 2019 & 2032
- Table 98: United Kingdom Sizing Agent Industry Volume (K Tons) Forecast, by Application 2019 & 2032
- Table 99: Italy Sizing Agent Industry Revenue (Billion) Forecast, by Application 2019 & 2032
- Table 100: Italy Sizing Agent Industry Volume (K Tons) Forecast, by Application 2019 & 2032
- Table 101: France Sizing Agent Industry Revenue (Billion) Forecast, by Application 2019 & 2032
- Table 102: France Sizing Agent Industry Volume (K Tons) Forecast, by Application 2019 & 2032
- Table 103: Rest of Europe Sizing Agent Industry Revenue (Billion) Forecast, by Application 2019 & 2032
- Table 104: Rest of Europe Sizing Agent Industry Volume (K Tons) Forecast, by Application 2019 & 2032
- Table 105: Global Sizing Agent Industry Revenue Billion Forecast, by Type 2019 & 2032
- Table 106: Global Sizing Agent Industry Volume K Tons Forecast, by Type 2019 & 2032
- Table 107: Global Sizing Agent Industry Revenue Billion Forecast, by Application 2019 & 2032
- Table 108: Global Sizing Agent Industry Volume K Tons Forecast, by Application 2019 & 2032
- Table 109: Global Sizing Agent Industry Revenue Billion Forecast, by Country 2019 & 2032
- Table 110: Global Sizing Agent Industry Volume K Tons Forecast, by Country 2019 & 2032
- Table 111: Brazil Sizing Agent Industry Revenue (Billion) Forecast, by Application 2019 & 2032
- Table 112: Brazil Sizing Agent Industry Volume (K Tons) Forecast, by Application 2019 & 2032
- Table 113: Argentina Sizing Agent Industry Revenue (Billion) Forecast, by Application 2019 & 2032
- Table 114: Argentina Sizing Agent Industry Volume (K Tons) Forecast, by Application 2019 & 2032
- Table 115: Rest of South America Sizing Agent Industry Revenue (Billion) Forecast, by Application 2019 & 2032
- Table 116: Rest of South America Sizing Agent Industry Volume (K Tons) Forecast, by Application 2019 & 2032
- Table 117: Global Sizing Agent Industry Revenue Billion Forecast, by Type 2019 & 2032
- Table 118: Global Sizing Agent Industry Volume K Tons Forecast, by Type 2019 & 2032
- Table 119: Global Sizing Agent Industry Revenue Billion Forecast, by Application 2019 & 2032
- Table 120: Global Sizing Agent Industry Volume K Tons Forecast, by Application 2019 & 2032
- Table 121: Global Sizing Agent Industry Revenue Billion Forecast, by Country 2019 & 2032
- Table 122: Global Sizing Agent Industry Volume K Tons Forecast, by Country 2019 & 2032
- Table 123: Saudi Arabia Sizing Agent Industry Revenue (Billion) Forecast, by Application 2019 & 2032
- Table 124: Saudi Arabia Sizing Agent Industry Volume (K Tons) Forecast, by Application 2019 & 2032
- Table 125: South Africa Sizing Agent Industry Revenue (Billion) Forecast, by Application 2019 & 2032
- Table 126: South Africa Sizing Agent Industry Volume (K Tons) Forecast, by Application 2019 & 2032
- Table 127: Rest of Middle East and Africa Sizing Agent Industry Revenue (Billion) Forecast, by Application 2019 & 2032
- Table 128: Rest of Middle East and Africa Sizing Agent Industry Volume (K Tons) Forecast, by Application 2019 & 2032
Frequently Asked Questions
1. What is the projected Compound Annual Growth Rate (CAGR) of the Sizing Agent Industry?
The projected CAGR is approximately 4%.
2. Which companies are prominent players in the Sizing Agent Industry?
Key companies in the market include Aries Chemical Inc, Drop Chemicals SA, Avebe, Buckman, LAROS, Refnol Resins & Chemicals Ltd, Eco Polychem Pvt Ltd, Huixian Tiankai Paper Making Agent Co Ltd, Angel Starch & Food Private Limited, Harima Chemicals Group Inc, Associated Chemical, Finor Piplaj Chemical Limited, MATANGI INTERNATIONAL, Solenis, Mare SpA.
3. What are the main segments of the Sizing Agent Industry?
The market segments include Type, Application.
4. Can you provide details about the market size?
The market size is estimated to be USD 3.9 Billion as of 2022.
5. What are some drivers contributing to market growth?
; Growing Demand from the Textile Industry; Increasing Demand from the Paper Manufacturing Industries.
6. What are the notable trends driving market growth?
Growing Demand from the Textile Manufacturing Industry.
7. Are there any restraints impacting market growth?
; Stringent Environmental Regulations; Unfavorable Conditions Arising Due to the COVID-19 Outbreak.
8. Can you provide examples of recent developments in the market?
N/A
9. What pricing options are available for accessing the report?
Pricing options include single-user, multi-user, and enterprise licenses priced at USD 4750, USD 5250, and USD 8750 respectively.
10. Is the market size provided in terms of value or volume?
The market size is provided in terms of value, measured in Billion and volume, measured in K Tons.
11. Are there any specific market keywords associated with the report?
Yes, the market keyword associated with the report is "Sizing Agent Industry," which aids in identifying and referencing the specific market segment covered.
12. How do I determine which pricing option suits my needs best?
The pricing options vary based on user requirements and access needs. Individual users may opt for single-user licenses, while businesses requiring broader access may choose multi-user or enterprise licenses for cost-effective access to the report.
13. Are there any additional resources or data provided in the Sizing Agent Industry report?
While the report offers comprehensive insights, it's advisable to review the specific contents or supplementary materials provided to ascertain if additional resources or data are available.
14. How can I stay updated on further developments or reports in the Sizing Agent Industry?
To stay informed about further developments, trends, and reports in the Sizing Agent Industry, consider subscribing to industry newsletters, following relevant companies and organizations, or regularly checking reputable industry news sources and publications.
Methodology
Step 1 - Identification of Relevant Samples Size from Population Database


Step 2 - Approaches for Defining Global Market Size (Value, Volume* & Price*)

Note*: In applicable scenarios
Step 3 - Data Sources
Primary Research
- Web Analytics
- Survey Reports
- Research Institute
- Latest Research Reports
- Opinion Leaders
Secondary Research
- Annual Reports
- White Paper
- Latest Press Release
- Industry Association
- Paid Database
- Investor Presentations

Step 4 - Data Triangulation
Involves using different sources of information in order to increase the validity of a study
These sources are likely to be stakeholders in a program - participants, other researchers, program staff, other community members, and so on.
Then we put all data in single framework & apply various statistical tools to find out the dynamic on the market.
During the analysis stage, feedback from the stakeholder groups would be compared to determine areas of agreement as well as areas of divergence


