Key Insights
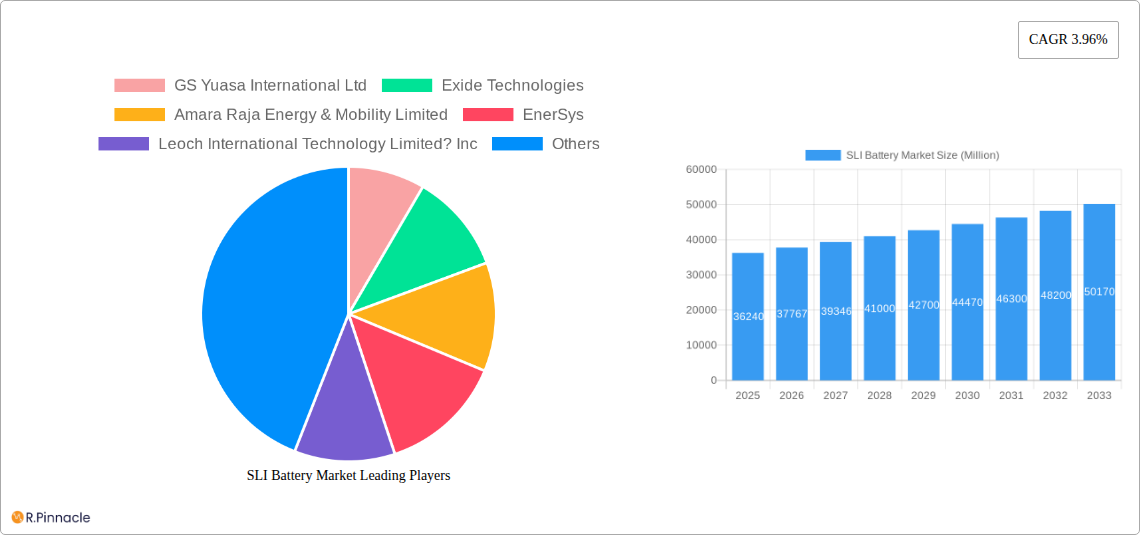
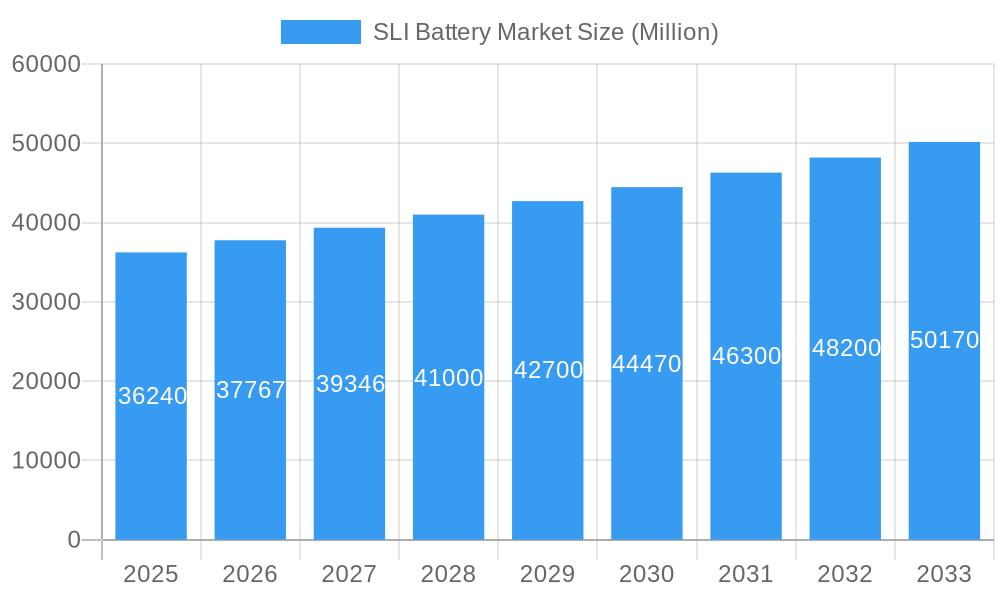
The global Starter, Lighting, and Ignition (SLI) battery market, valued at $36.24 billion in 2025, is projected to experience steady growth, driven primarily by the expanding automotive sector and increasing demand for replacement batteries. A compound annual growth rate (CAGR) of 3.96% from 2025 to 2033 indicates a substantial market expansion over the forecast period. Key growth drivers include the rising sales of passenger and commercial vehicles globally, particularly in developing economies with expanding middle classes and increasing vehicle ownership. Furthermore, advancements in battery technology, such as the development of enhanced lead-acid batteries and the gradual introduction of advanced battery chemistries like lithium-ion in specific SLI applications (e.g., hybrid vehicles), are contributing to market growth. However, fluctuating raw material prices, particularly lead, and environmental concerns related to lead-acid battery disposal pose significant challenges to market expansion. The market is segmented by battery type (lead-acid, lithium-ion, others), vehicle type (passenger cars, commercial vehicles, motorcycles), and region. Major players like GS Yuasa, Exide Technologies, and Clarios are engaged in intense competition, focusing on technological innovation, cost optimization, and geographic expansion to maintain market share. The increasing adoption of electric and hybrid vehicles may present both opportunities and challenges as the market transitions towards alternative battery technologies. The market is expected to see continued consolidation among manufacturers as companies seek economies of scale and broader product portfolios.
SLI Battery Market Market Size (In Billion)
The historical period (2019-2024) likely showed similar growth trends, albeit potentially influenced by economic fluctuations and disruptions such as supply chain issues. The forecast period (2025-2033) anticipates continued growth, though the CAGR might slightly moderate in the latter years due to market saturation in developed regions and the evolving landscape of vehicle electrification. Regional variations are expected, with developing markets exhibiting higher growth rates compared to mature markets. The competitive landscape will remain dynamic, with existing players focusing on enhancing product performance, improving manufacturing efficiency, and expanding their distribution networks. New entrants might emerge, particularly in niche segments or regions, driving further innovation and competition.
SLI Battery Market Company Market Share
SLI Battery Market Report: 2019-2033 Forecast
This comprehensive report provides a detailed analysis of the SLI (Starting, Lighting, and Ignition) battery market, offering invaluable insights for industry professionals, investors, and strategic decision-makers. The study period covers 2019-2033, with 2025 as the base and estimated year. We project significant growth opportunities, driven by technological advancements and evolving market dynamics. This report is crucial for understanding the current landscape and navigating the future of the SLI battery industry.
SLI Battery Market Market Structure & Innovation Trends
The SLI battery market exhibits a moderately consolidated structure, with several key players commanding significant market share. GS Yuasa International Ltd, Exide Technologies, Amara Raja Energy & Mobility Limited, EnerSys, Leoch International Technology Limited, East Penn Manufacturing Company, C&D Technologies Inc, Clarios International Inc, Trojan Battery Company, and Crown Battery Manufacturing Company are among the leading players. However, the market also includes numerous smaller regional players and niche specialists. Market share analysis reveals a competitive landscape with some companies holding over xx% market share and the remainder distributed among a larger number of competitors. M&A activity has been moderate, with recent deals focused on expanding geographic reach and product portfolios. The average deal value in the last five years is estimated at xx Million. Innovation in the SLI battery market is driven by:
- Technological advancements: Focus on improving battery life, performance, and safety features. This includes the development of advanced VRLA (Valve Regulated Lead Acid) technologies and exploring alternative battery chemistries.
- Stringent environmental regulations: Growing emphasis on recycling and sustainable manufacturing practices is reshaping the industry. This is driving investment in advanced recycling technologies and the use of eco-friendly materials.
- Product differentiation: Companies are focusing on developing specialized batteries for specific applications, catering to diverse customer needs.
SLI Battery Market Market Dynamics & Trends
The SLI battery market is experiencing steady growth, driven by increasing vehicle ownership globally and the expanding demand for replacement batteries. The market's CAGR during the forecast period (2025-2033) is projected at xx%. Key growth drivers include:
- Rising automotive sales: Growth in the automotive industry is a significant driver for SLI battery demand, particularly in developing economies.
- Increasing replacement demand: The lifespan of SLI batteries is finite, leading to a continuous replacement market.
- Technological improvements: Enhanced battery performance, lifespan, and safety features are driving adoption.
- Expanding applications: Beyond automotive, the SLI battery market finds applications in various sectors such as motorcycles, heavy machinery, and power backup systems, adding to market volume.
- Price fluctuations of raw materials: The price volatility of lead and other raw materials directly impacts production costs and market profitability.
Competitive dynamics remain intense, with leading players focusing on innovation, cost optimization, and strategic partnerships to maintain their market positions. Market penetration is highest in developed regions but is steadily increasing in developing markets.
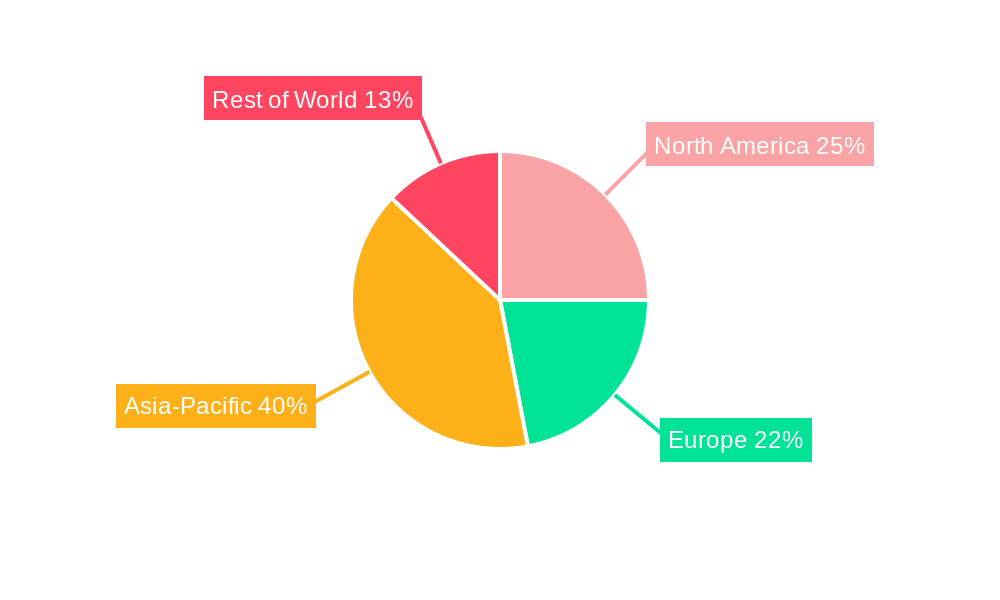
Dominant Regions & Segments in SLI Battery Market
The Asia-Pacific region currently holds the dominant position in the SLI battery market.
- Key Drivers:
- Rapid economic growth and increasing vehicle ownership.
- Government initiatives supporting the automotive industry.
- Developing infrastructure.
- Significant manufacturing base.
This dominance is anticipated to continue throughout the forecast period. However, other regions such as North America and Europe are also witnessing growth, driven by factors such as increasing demand for high-performance batteries and the adoption of advanced technologies. The automotive segment holds the largest share of the market, owing to the extensive use of SLI batteries in vehicles. Other significant segments include industrial applications (heavy machinery, power backup systems) and motorcycles.
SLI Battery Market Product Innovations
Recent innovations in SLI batteries focus on improving performance, extending lifespan, enhancing safety, and promoting environmental sustainability. Schaeffler's launch of the TruPower 2W VRLA battery in June 2023 exemplifies this trend, showcasing advancements in battery technology to meet market demands for improved efficiency and safety. The development of advanced VRLA technologies along with efforts towards enhanced recyclability are key aspects of product development.
Report Scope & Segmentation Analysis
This report segments the SLI battery market by:
- Battery Type: VRLA, flooded, other. Each segment shows varied growth projections, influenced by technological advancements and cost-effectiveness.
- Vehicle Type: Passenger cars, commercial vehicles, motorcycles, others. This segmentation reveals varying demand and growth rates, influenced by the specific needs of each type of vehicle.
- Region: North America, Europe, Asia-Pacific, Rest of the World. This geographical analysis sheds light on regional variations in market size, growth drivers, and competitive dynamics.
Key Drivers of SLI Battery Market Growth
The SLI battery market's growth is propelled by:
- Rising global automotive production and sales.
- Increasing demand for replacement batteries due to finite lifespan.
- Technological advancements enhancing battery performance, life, and safety.
- Expansion into diverse application sectors.
- Government regulations promoting sustainable battery manufacturing and recycling.
Challenges in the SLI Battery Market Sector
The SLI battery market faces several challenges:
- Fluctuating raw material prices (lead) impacting production costs.
- Stringent environmental regulations requiring enhanced recycling and waste management.
- Intense competition among established players and emerging entrants.
- Supply chain disruptions and geopolitical uncertainties.
- Customer preference shift towards alternative battery technologies (e.g., lithium-ion).
Emerging Opportunities in SLI Battery Market
Significant opportunities exist for SLI battery manufacturers:
- Growing demand in developing economies.
- Development of high-performance batteries for specialized applications.
- Focus on sustainable and eco-friendly manufacturing processes.
- Integration of smart technologies and advanced analytics for enhanced battery management.
- Strategic partnerships and collaborations to expand market reach and access new technologies.
Leading Players in the SLI Battery Market Market
- GS Yuasa International Ltd
- Exide Technologies
- Amara Raja Energy & Mobility Limited
- EnerSys
- Leoch International Technology Limited
- East Penn Manufacturing Company
- C&D Technologies Inc
- Clarios International Inc
- Trojan Battery Company
- Crown Battery Manufacturing Company
(List Not Exhaustive)
Further details on other prominent companies would be included in the full report.
Key Developments in SLI Battery Market Industry
- June 2023: Schaeffler launched its ‘TruPower 2W’ VRLA automotive battery, signifying advancements in battery technology.
- January 2024: India's MoEFCC released an SOP for lead-acid battery recycling, aiming to regulate waste management and minimize environmental risks. This highlights growing regulatory scrutiny and the importance of sustainable practices within the industry.
Future Outlook for SLI Battery Market Market
The SLI battery market is poised for continued growth, driven by increasing vehicle ownership, particularly in emerging markets. Technological advancements, focusing on enhanced performance, lifespan, and safety, will continue to shape the market. Companies that embrace sustainability initiatives and adapt to evolving regulatory landscapes will be best positioned for success. The market's future potential is substantial, especially with the ongoing exploration of next-generation battery technologies.
SLI Battery Market Segmentation
-
1. Type
- 1.1. Flooded Battery
- 1.2. VRLA Battery
- 1.3. EBF Battery
-
2. End-User
- 2.1. Automotive
- 2.2. Others
SLI Battery Market Segmentation By Geography
-
1. North America
- 1.1. United States
- 1.2. Canada
- 1.3. Rest of North America
-
2. Europe
- 2.1. Germany
- 2.2. United Kingdom
- 2.3. France
- 2.4. Italy
- 2.5. Spain
- 2.6. Nordic
- 2.7. Russia
- 2.8. Rest of Europe
-
3. Asia Pacific
- 3.1. China
- 3.2. India
- 3.3. Japan
- 3.4. South Korea
- 3.5. Thailand
- 3.6. Malaysia
- 3.7. Indonesia
- 3.8. Vietnam
- 3.9. Rest of Asia Pacific
-
4. Middle East and Africa
- 4.1. Saudi Arabia
- 4.2. United Arab Emirates
- 4.3. South Africa
- 4.4. Egypt
- 4.5. Nigeria
- 4.6. Qatar
- 4.7. Rest of Middle East and Africa
-
5. South America
- 5.1. Brazil
- 5.2. Argentina
- 5.3. Chile
- 5.4. Rest of South America
SLI Battery Market Regional Market Share
Geographic Coverage of SLI Battery Market
SLI Battery Market REPORT HIGHLIGHTS
| Aspects | Details |
|---|---|
| Study Period | 2020-2034 |
| Base Year | 2025 |
| Estimated Year | 2026 |
| Forecast Period | 2026-2034 |
| Historical Period | 2020-2025 |
| Growth Rate | CAGR of 3.96% from 2020-2034 |
| Segmentation |
|
Table of Contents
- 1. Introduction
- 1.1. Research Scope
- 1.2. Market Segmentation
- 1.3. Research Objective
- 1.4. Definitions and Assumptions
- 2. Executive Summary
- 2.1. Market Snapshot
- 3. Market Dynamics
- 3.1. Market Drivers
- 3.2. Market Restrains
- 3.3. Market Trends
- 3.4. Market Opportunities
- 4. Market Factor Analysis
- 4.1. Porters Five Forces
- 4.1.1. Bargaining Power of Suppliers
- 4.1.2. Bargaining Power of Buyers
- 4.1.3. Threat of New Entrants
- 4.1.4. Threat of Substitutes
- 4.1.5. Competitive Rivalry
- 4.2. PESTEL analysis
- 4.3. BCG Analysis
- 4.3.1. Stars (High Growth, High Market Share)
- 4.3.2. Cash Cows (Low Growth, High Market Share)
- 4.3.3. Question Mark (High Growth, Low Market Share)
- 4.3.4. Dogs (Low Growth, Low Market Share)
- 4.4. Ansoff Matrix Analysis
- 4.5. Supply Chain Analysis
- 4.6. Regulatory Landscape
- 4.7. Current Market Potential and Opportunity Assessment (TAM–SAM–SOM Framework)
- 4.8. PRI Analyst Note
- 4.1. Porters Five Forces
- 5. Market Analysis, Insights and Forecast 2021-2033
- 5.1. Market Analysis, Insights and Forecast - by Type
- 5.1.1. Flooded Battery
- 5.1.2. VRLA Battery
- 5.1.3. EBF Battery
- 5.2. Market Analysis, Insights and Forecast - by End-User
- 5.2.1. Automotive
- 5.2.2. Others
- 5.3. Market Analysis, Insights and Forecast - by Region
- 5.3.1. North America
- 5.3.2. Europe
- 5.3.3. Asia Pacific
- 5.3.4. Middle East and Africa
- 5.3.5. South America
- 5.1. Market Analysis, Insights and Forecast - by Type
- 6. Global SLI Battery Market Analysis, Insights and Forecast, 2021-2033
- 6.1. Market Analysis, Insights and Forecast - by Type
- 6.1.1. Flooded Battery
- 6.1.2. VRLA Battery
- 6.1.3. EBF Battery
- 6.2. Market Analysis, Insights and Forecast - by End-User
- 6.2.1. Automotive
- 6.2.2. Others
- 6.1. Market Analysis, Insights and Forecast - by Type
- 7. North America SLI Battery Market Analysis, Insights and Forecast, 2020-2032
- 7.1. Market Analysis, Insights and Forecast - by Type
- 7.1.1. Flooded Battery
- 7.1.2. VRLA Battery
- 7.1.3. EBF Battery
- 7.2. Market Analysis, Insights and Forecast - by End-User
- 7.2.1. Automotive
- 7.2.2. Others
- 7.1. Market Analysis, Insights and Forecast - by Type
- 8. Europe SLI Battery Market Analysis, Insights and Forecast, 2020-2032
- 8.1. Market Analysis, Insights and Forecast - by Type
- 8.1.1. Flooded Battery
- 8.1.2. VRLA Battery
- 8.1.3. EBF Battery
- 8.2. Market Analysis, Insights and Forecast - by End-User
- 8.2.1. Automotive
- 8.2.2. Others
- 8.1. Market Analysis, Insights and Forecast - by Type
- 9. Asia Pacific SLI Battery Market Analysis, Insights and Forecast, 2020-2032
- 9.1. Market Analysis, Insights and Forecast - by Type
- 9.1.1. Flooded Battery
- 9.1.2. VRLA Battery
- 9.1.3. EBF Battery
- 9.2. Market Analysis, Insights and Forecast - by End-User
- 9.2.1. Automotive
- 9.2.2. Others
- 9.1. Market Analysis, Insights and Forecast - by Type
- 10. Middle East and Africa SLI Battery Market Analysis, Insights and Forecast, 2020-2032
- 10.1. Market Analysis, Insights and Forecast - by Type
- 10.1.1. Flooded Battery
- 10.1.2. VRLA Battery
- 10.1.3. EBF Battery
- 10.2. Market Analysis, Insights and Forecast - by End-User
- 10.2.1. Automotive
- 10.2.2. Others
- 10.1. Market Analysis, Insights and Forecast - by Type
- 11. South America SLI Battery Market Analysis, Insights and Forecast, 2020-2032
- 11.1. Market Analysis, Insights and Forecast - by Type
- 11.1.1. Flooded Battery
- 11.1.2. VRLA Battery
- 11.1.3. EBF Battery
- 11.2. Market Analysis, Insights and Forecast - by End-User
- 11.2.1. Automotive
- 11.2.2. Others
- 11.1. Market Analysis, Insights and Forecast - by Type
- 12. Competitive Analysis
- 12.1. Company Profiles
- 12.1.1 GS Yuasa International Ltd
- 12.1.1.1. Company Overview
- 12.1.1.2. Products
- 12.1.1.3. Company Financials
- 12.1.1.4. SWOT Analysis
- 12.1.2 Exide Technologies
- 12.1.2.1. Company Overview
- 12.1.2.2. Products
- 12.1.2.3. Company Financials
- 12.1.2.4. SWOT Analysis
- 12.1.3 Amara Raja Energy & Mobility Limited
- 12.1.3.1. Company Overview
- 12.1.3.2. Products
- 12.1.3.3. Company Financials
- 12.1.3.4. SWOT Analysis
- 12.1.4 EnerSys
- 12.1.4.1. Company Overview
- 12.1.4.2. Products
- 12.1.4.3. Company Financials
- 12.1.4.4. SWOT Analysis
- 12.1.5 Leoch International Technology Limited? Inc
- 12.1.5.1. Company Overview
- 12.1.5.2. Products
- 12.1.5.3. Company Financials
- 12.1.5.4. SWOT Analysis
- 12.1.6 East Penn Manufacturing Company
- 12.1.6.1. Company Overview
- 12.1.6.2. Products
- 12.1.6.3. Company Financials
- 12.1.6.4. SWOT Analysis
- 12.1.7 C&D Technologies Inc ?
- 12.1.7.1. Company Overview
- 12.1.7.2. Products
- 12.1.7.3. Company Financials
- 12.1.7.4. SWOT Analysis
- 12.1.8 Clarios International Inc ?
- 12.1.8.1. Company Overview
- 12.1.8.2. Products
- 12.1.8.3. Company Financials
- 12.1.8.4. SWOT Analysis
- 12.1.9 Trojan Battery Company
- 12.1.9.1. Company Overview
- 12.1.9.2. Products
- 12.1.9.3. Company Financials
- 12.1.9.4. SWOT Analysis
- 12.1.10 Crown Battery Manufacturing Company*List Not Exhaustive 6 4 List of Other Prominent Companies (Company Name Headquarter Relevant Products & Services Contact Details etc )6 5 Market Ranking Analysi
- 12.1.10.1. Company Overview
- 12.1.10.2. Products
- 12.1.10.3. Company Financials
- 12.1.10.4. SWOT Analysis
- 12.1.1 GS Yuasa International Ltd
- 12.2. Market Entropy
- 12.2.1 Company's Key Areas Served
- 12.2.2 Recent Developments
- 12.3. Company Market Share Analysis 2025
- 12.3.1 Top 5 Companies Market Share Analysis
- 12.3.2 Top 3 Companies Market Share Analysis
- 12.4. List of Potential Customers
- 13. Research Methodology
List of Figures
- Figure 1: Global SLI Battery Market Revenue Breakdown (Million, %) by Region 2025 & 2033
- Figure 2: Global SLI Battery Market Volume Breakdown (Billion, %) by Region 2025 & 2033
- Figure 3: North America SLI Battery Market Revenue (Million), by Type 2025 & 2033
- Figure 4: North America SLI Battery Market Volume (Billion), by Type 2025 & 2033
- Figure 5: North America SLI Battery Market Revenue Share (%), by Type 2025 & 2033
- Figure 6: North America SLI Battery Market Volume Share (%), by Type 2025 & 2033
- Figure 7: North America SLI Battery Market Revenue (Million), by End-User 2025 & 2033
- Figure 8: North America SLI Battery Market Volume (Billion), by End-User 2025 & 2033
- Figure 9: North America SLI Battery Market Revenue Share (%), by End-User 2025 & 2033
- Figure 10: North America SLI Battery Market Volume Share (%), by End-User 2025 & 2033
- Figure 11: North America SLI Battery Market Revenue (Million), by Country 2025 & 2033
- Figure 12: North America SLI Battery Market Volume (Billion), by Country 2025 & 2033
- Figure 13: North America SLI Battery Market Revenue Share (%), by Country 2025 & 2033
- Figure 14: North America SLI Battery Market Volume Share (%), by Country 2025 & 2033
- Figure 15: Europe SLI Battery Market Revenue (Million), by Type 2025 & 2033
- Figure 16: Europe SLI Battery Market Volume (Billion), by Type 2025 & 2033
- Figure 17: Europe SLI Battery Market Revenue Share (%), by Type 2025 & 2033
- Figure 18: Europe SLI Battery Market Volume Share (%), by Type 2025 & 2033
- Figure 19: Europe SLI Battery Market Revenue (Million), by End-User 2025 & 2033
- Figure 20: Europe SLI Battery Market Volume (Billion), by End-User 2025 & 2033
- Figure 21: Europe SLI Battery Market Revenue Share (%), by End-User 2025 & 2033
- Figure 22: Europe SLI Battery Market Volume Share (%), by End-User 2025 & 2033
- Figure 23: Europe SLI Battery Market Revenue (Million), by Country 2025 & 2033
- Figure 24: Europe SLI Battery Market Volume (Billion), by Country 2025 & 2033
- Figure 25: Europe SLI Battery Market Revenue Share (%), by Country 2025 & 2033
- Figure 26: Europe SLI Battery Market Volume Share (%), by Country 2025 & 2033
- Figure 27: Asia Pacific SLI Battery Market Revenue (Million), by Type 2025 & 2033
- Figure 28: Asia Pacific SLI Battery Market Volume (Billion), by Type 2025 & 2033
- Figure 29: Asia Pacific SLI Battery Market Revenue Share (%), by Type 2025 & 2033
- Figure 30: Asia Pacific SLI Battery Market Volume Share (%), by Type 2025 & 2033
- Figure 31: Asia Pacific SLI Battery Market Revenue (Million), by End-User 2025 & 2033
- Figure 32: Asia Pacific SLI Battery Market Volume (Billion), by End-User 2025 & 2033
- Figure 33: Asia Pacific SLI Battery Market Revenue Share (%), by End-User 2025 & 2033
- Figure 34: Asia Pacific SLI Battery Market Volume Share (%), by End-User 2025 & 2033
- Figure 35: Asia Pacific SLI Battery Market Revenue (Million), by Country 2025 & 2033
- Figure 36: Asia Pacific SLI Battery Market Volume (Billion), by Country 2025 & 2033
- Figure 37: Asia Pacific SLI Battery Market Revenue Share (%), by Country 2025 & 2033
- Figure 38: Asia Pacific SLI Battery Market Volume Share (%), by Country 2025 & 2033
- Figure 39: Middle East and Africa SLI Battery Market Revenue (Million), by Type 2025 & 2033
- Figure 40: Middle East and Africa SLI Battery Market Volume (Billion), by Type 2025 & 2033
- Figure 41: Middle East and Africa SLI Battery Market Revenue Share (%), by Type 2025 & 2033
- Figure 42: Middle East and Africa SLI Battery Market Volume Share (%), by Type 2025 & 2033
- Figure 43: Middle East and Africa SLI Battery Market Revenue (Million), by End-User 2025 & 2033
- Figure 44: Middle East and Africa SLI Battery Market Volume (Billion), by End-User 2025 & 2033
- Figure 45: Middle East and Africa SLI Battery Market Revenue Share (%), by End-User 2025 & 2033
- Figure 46: Middle East and Africa SLI Battery Market Volume Share (%), by End-User 2025 & 2033
- Figure 47: Middle East and Africa SLI Battery Market Revenue (Million), by Country 2025 & 2033
- Figure 48: Middle East and Africa SLI Battery Market Volume (Billion), by Country 2025 & 2033
- Figure 49: Middle East and Africa SLI Battery Market Revenue Share (%), by Country 2025 & 2033
- Figure 50: Middle East and Africa SLI Battery Market Volume Share (%), by Country 2025 & 2033
- Figure 51: South America SLI Battery Market Revenue (Million), by Type 2025 & 2033
- Figure 52: South America SLI Battery Market Volume (Billion), by Type 2025 & 2033
- Figure 53: South America SLI Battery Market Revenue Share (%), by Type 2025 & 2033
- Figure 54: South America SLI Battery Market Volume Share (%), by Type 2025 & 2033
- Figure 55: South America SLI Battery Market Revenue (Million), by End-User 2025 & 2033
- Figure 56: South America SLI Battery Market Volume (Billion), by End-User 2025 & 2033
- Figure 57: South America SLI Battery Market Revenue Share (%), by End-User 2025 & 2033
- Figure 58: South America SLI Battery Market Volume Share (%), by End-User 2025 & 2033
- Figure 59: South America SLI Battery Market Revenue (Million), by Country 2025 & 2033
- Figure 60: South America SLI Battery Market Volume (Billion), by Country 2025 & 2033
- Figure 61: South America SLI Battery Market Revenue Share (%), by Country 2025 & 2033
- Figure 62: South America SLI Battery Market Volume Share (%), by Country 2025 & 2033
List of Tables
- Table 1: Global SLI Battery Market Revenue Million Forecast, by Type 2020 & 2033
- Table 2: Global SLI Battery Market Volume Billion Forecast, by Type 2020 & 2033
- Table 3: Global SLI Battery Market Revenue Million Forecast, by End-User 2020 & 2033
- Table 4: Global SLI Battery Market Volume Billion Forecast, by End-User 2020 & 2033
- Table 5: Global SLI Battery Market Revenue Million Forecast, by Region 2020 & 2033
- Table 6: Global SLI Battery Market Volume Billion Forecast, by Region 2020 & 2033
- Table 7: Global SLI Battery Market Revenue Million Forecast, by Type 2020 & 2033
- Table 8: Global SLI Battery Market Volume Billion Forecast, by Type 2020 & 2033
- Table 9: Global SLI Battery Market Revenue Million Forecast, by End-User 2020 & 2033
- Table 10: Global SLI Battery Market Volume Billion Forecast, by End-User 2020 & 2033
- Table 11: Global SLI Battery Market Revenue Million Forecast, by Country 2020 & 2033
- Table 12: Global SLI Battery Market Volume Billion Forecast, by Country 2020 & 2033
- Table 13: United States SLI Battery Market Revenue (Million) Forecast, by Application 2020 & 2033
- Table 14: United States SLI Battery Market Volume (Billion) Forecast, by Application 2020 & 2033
- Table 15: Canada SLI Battery Market Revenue (Million) Forecast, by Application 2020 & 2033
- Table 16: Canada SLI Battery Market Volume (Billion) Forecast, by Application 2020 & 2033
- Table 17: Rest of North America SLI Battery Market Revenue (Million) Forecast, by Application 2020 & 2033
- Table 18: Rest of North America SLI Battery Market Volume (Billion) Forecast, by Application 2020 & 2033
- Table 19: Global SLI Battery Market Revenue Million Forecast, by Type 2020 & 2033
- Table 20: Global SLI Battery Market Volume Billion Forecast, by Type 2020 & 2033
- Table 21: Global SLI Battery Market Revenue Million Forecast, by End-User 2020 & 2033
- Table 22: Global SLI Battery Market Volume Billion Forecast, by End-User 2020 & 2033
- Table 23: Global SLI Battery Market Revenue Million Forecast, by Country 2020 & 2033
- Table 24: Global SLI Battery Market Volume Billion Forecast, by Country 2020 & 2033
- Table 25: Germany SLI Battery Market Revenue (Million) Forecast, by Application 2020 & 2033
- Table 26: Germany SLI Battery Market Volume (Billion) Forecast, by Application 2020 & 2033
- Table 27: United Kingdom SLI Battery Market Revenue (Million) Forecast, by Application 2020 & 2033
- Table 28: United Kingdom SLI Battery Market Volume (Billion) Forecast, by Application 2020 & 2033
- Table 29: France SLI Battery Market Revenue (Million) Forecast, by Application 2020 & 2033
- Table 30: France SLI Battery Market Volume (Billion) Forecast, by Application 2020 & 2033
- Table 31: Italy SLI Battery Market Revenue (Million) Forecast, by Application 2020 & 2033
- Table 32: Italy SLI Battery Market Volume (Billion) Forecast, by Application 2020 & 2033
- Table 33: Spain SLI Battery Market Revenue (Million) Forecast, by Application 2020 & 2033
- Table 34: Spain SLI Battery Market Volume (Billion) Forecast, by Application 2020 & 2033
- Table 35: Nordic SLI Battery Market Revenue (Million) Forecast, by Application 2020 & 2033
- Table 36: Nordic SLI Battery Market Volume (Billion) Forecast, by Application 2020 & 2033
- Table 37: Russia SLI Battery Market Revenue (Million) Forecast, by Application 2020 & 2033
- Table 38: Russia SLI Battery Market Volume (Billion) Forecast, by Application 2020 & 2033
- Table 39: Rest of Europe SLI Battery Market Revenue (Million) Forecast, by Application 2020 & 2033
- Table 40: Rest of Europe SLI Battery Market Volume (Billion) Forecast, by Application 2020 & 2033
- Table 41: Global SLI Battery Market Revenue Million Forecast, by Type 2020 & 2033
- Table 42: Global SLI Battery Market Volume Billion Forecast, by Type 2020 & 2033
- Table 43: Global SLI Battery Market Revenue Million Forecast, by End-User 2020 & 2033
- Table 44: Global SLI Battery Market Volume Billion Forecast, by End-User 2020 & 2033
- Table 45: Global SLI Battery Market Revenue Million Forecast, by Country 2020 & 2033
- Table 46: Global SLI Battery Market Volume Billion Forecast, by Country 2020 & 2033
- Table 47: China SLI Battery Market Revenue (Million) Forecast, by Application 2020 & 2033
- Table 48: China SLI Battery Market Volume (Billion) Forecast, by Application 2020 & 2033
- Table 49: India SLI Battery Market Revenue (Million) Forecast, by Application 2020 & 2033
- Table 50: India SLI Battery Market Volume (Billion) Forecast, by Application 2020 & 2033
- Table 51: Japan SLI Battery Market Revenue (Million) Forecast, by Application 2020 & 2033
- Table 52: Japan SLI Battery Market Volume (Billion) Forecast, by Application 2020 & 2033
- Table 53: South Korea SLI Battery Market Revenue (Million) Forecast, by Application 2020 & 2033
- Table 54: South Korea SLI Battery Market Volume (Billion) Forecast, by Application 2020 & 2033
- Table 55: Thailand SLI Battery Market Revenue (Million) Forecast, by Application 2020 & 2033
- Table 56: Thailand SLI Battery Market Volume (Billion) Forecast, by Application 2020 & 2033
- Table 57: Malaysia SLI Battery Market Revenue (Million) Forecast, by Application 2020 & 2033
- Table 58: Malaysia SLI Battery Market Volume (Billion) Forecast, by Application 2020 & 2033
- Table 59: Indonesia SLI Battery Market Revenue (Million) Forecast, by Application 2020 & 2033
- Table 60: Indonesia SLI Battery Market Volume (Billion) Forecast, by Application 2020 & 2033
- Table 61: Vietnam SLI Battery Market Revenue (Million) Forecast, by Application 2020 & 2033
- Table 62: Vietnam SLI Battery Market Volume (Billion) Forecast, by Application 2020 & 2033
- Table 63: Rest of Asia Pacific SLI Battery Market Revenue (Million) Forecast, by Application 2020 & 2033
- Table 64: Rest of Asia Pacific SLI Battery Market Volume (Billion) Forecast, by Application 2020 & 2033
- Table 65: Global SLI Battery Market Revenue Million Forecast, by Type 2020 & 2033
- Table 66: Global SLI Battery Market Volume Billion Forecast, by Type 2020 & 2033
- Table 67: Global SLI Battery Market Revenue Million Forecast, by End-User 2020 & 2033
- Table 68: Global SLI Battery Market Volume Billion Forecast, by End-User 2020 & 2033
- Table 69: Global SLI Battery Market Revenue Million Forecast, by Country 2020 & 2033
- Table 70: Global SLI Battery Market Volume Billion Forecast, by Country 2020 & 2033
- Table 71: Saudi Arabia SLI Battery Market Revenue (Million) Forecast, by Application 2020 & 2033
- Table 72: Saudi Arabia SLI Battery Market Volume (Billion) Forecast, by Application 2020 & 2033
- Table 73: United Arab Emirates SLI Battery Market Revenue (Million) Forecast, by Application 2020 & 2033
- Table 74: United Arab Emirates SLI Battery Market Volume (Billion) Forecast, by Application 2020 & 2033
- Table 75: South Africa SLI Battery Market Revenue (Million) Forecast, by Application 2020 & 2033
- Table 76: South Africa SLI Battery Market Volume (Billion) Forecast, by Application 2020 & 2033
- Table 77: Egypt SLI Battery Market Revenue (Million) Forecast, by Application 2020 & 2033
- Table 78: Egypt SLI Battery Market Volume (Billion) Forecast, by Application 2020 & 2033
- Table 79: Nigeria SLI Battery Market Revenue (Million) Forecast, by Application 2020 & 2033
- Table 80: Nigeria SLI Battery Market Volume (Billion) Forecast, by Application 2020 & 2033
- Table 81: Qatar SLI Battery Market Revenue (Million) Forecast, by Application 2020 & 2033
- Table 82: Qatar SLI Battery Market Volume (Billion) Forecast, by Application 2020 & 2033
- Table 83: Rest of Middle East and Africa SLI Battery Market Revenue (Million) Forecast, by Application 2020 & 2033
- Table 84: Rest of Middle East and Africa SLI Battery Market Volume (Billion) Forecast, by Application 2020 & 2033
- Table 85: Global SLI Battery Market Revenue Million Forecast, by Type 2020 & 2033
- Table 86: Global SLI Battery Market Volume Billion Forecast, by Type 2020 & 2033
- Table 87: Global SLI Battery Market Revenue Million Forecast, by End-User 2020 & 2033
- Table 88: Global SLI Battery Market Volume Billion Forecast, by End-User 2020 & 2033
- Table 89: Global SLI Battery Market Revenue Million Forecast, by Country 2020 & 2033
- Table 90: Global SLI Battery Market Volume Billion Forecast, by Country 2020 & 2033
- Table 91: Brazil SLI Battery Market Revenue (Million) Forecast, by Application 2020 & 2033
- Table 92: Brazil SLI Battery Market Volume (Billion) Forecast, by Application 2020 & 2033
- Table 93: Argentina SLI Battery Market Revenue (Million) Forecast, by Application 2020 & 2033
- Table 94: Argentina SLI Battery Market Volume (Billion) Forecast, by Application 2020 & 2033
- Table 95: Chile SLI Battery Market Revenue (Million) Forecast, by Application 2020 & 2033
- Table 96: Chile SLI Battery Market Volume (Billion) Forecast, by Application 2020 & 2033
- Table 97: Rest of South America SLI Battery Market Revenue (Million) Forecast, by Application 2020 & 2033
- Table 98: Rest of South America SLI Battery Market Volume (Billion) Forecast, by Application 2020 & 2033
Frequently Asked Questions
1. What is the projected Compound Annual Growth Rate (CAGR) of the SLI Battery Market?
The projected CAGR is approximately 3.96%.
2. Which companies are prominent players in the SLI Battery Market?
Key companies in the market include GS Yuasa International Ltd, Exide Technologies, Amara Raja Energy & Mobility Limited, EnerSys, Leoch International Technology Limited? Inc, East Penn Manufacturing Company, C&D Technologies Inc ?, Clarios International Inc ?, Trojan Battery Company, Crown Battery Manufacturing Company*List Not Exhaustive 6 4 List of Other Prominent Companies (Company Name Headquarter Relevant Products & Services Contact Details etc )6 5 Market Ranking Analysi.
3. What are the main segments of the SLI Battery Market?
The market segments include Type, End-User.
4. Can you provide details about the market size?
The market size is estimated to be USD 36.24 Million as of 2022.
5. What are some drivers contributing to market growth?
4.; Increasing Adoption of Motor Vehicles4.; Growing Demand for SLI Batteries from Industrial and Agricultural Applications.
6. What are the notable trends driving market growth?
Automotive Segment to Witness Significant Growth.
7. Are there any restraints impacting market growth?
4.; Increasing Adoption of Motor Vehicles4.; Growing Demand for SLI Batteries from Industrial and Agricultural Applications.
8. Can you provide examples of recent developments in the market?
June 2023: Schaeffler, a German-based manufacturer of automotive components, announced the launch of new automotive lead acid batteries called ‘TruPower 2W’ The battery used VRLA (Valve Regulated Lead Acid) technology to ensure efficient and safe battery functioning.
9. What pricing options are available for accessing the report?
Pricing options include single-user, multi-user, and enterprise licenses priced at USD 4750, USD 5250, and USD 8750 respectively.
10. Is the market size provided in terms of value or volume?
The market size is provided in terms of value, measured in Million and volume, measured in Billion.
11. Are there any specific market keywords associated with the report?
Yes, the market keyword associated with the report is "SLI Battery Market," which aids in identifying and referencing the specific market segment covered.
12. How do I determine which pricing option suits my needs best?
The pricing options vary based on user requirements and access needs. Individual users may opt for single-user licenses, while businesses requiring broader access may choose multi-user or enterprise licenses for cost-effective access to the report.
13. Are there any additional resources or data provided in the SLI Battery Market report?
While the report offers comprehensive insights, it's advisable to review the specific contents or supplementary materials provided to ascertain if additional resources or data are available.
14. How can I stay updated on further developments or reports in the SLI Battery Market?
To stay informed about further developments, trends, and reports in the SLI Battery Market, consider subscribing to industry newsletters, following relevant companies and organizations, or regularly checking reputable industry news sources and publications.
Methodology
Step 1 - Identification of Relevant Samples Size from Population Database


Step 2 - Approaches for Defining Global Market Size (Value, Volume* & Price*)

Note*: In applicable scenarios
Step 3 - Data Sources
Primary Research
- Web Analytics
- Survey Reports
- Research Institute
- Latest Research Reports
- Opinion Leaders
Secondary Research
- Annual Reports
- White Paper
- Latest Press Release
- Industry Association
- Paid Database
- Investor Presentations

Step 4 - Data Triangulation
Involves using different sources of information in order to increase the validity of a study
These sources are likely to be stakeholders in a program - participants, other researchers, program staff, other community members, and so on.
Then we put all data in single framework & apply various statistical tools to find out the dynamic on the market.
During the analysis stage, feedback from the stakeholder groups would be compared to determine areas of agreement as well as areas of divergence

