
Key Insights
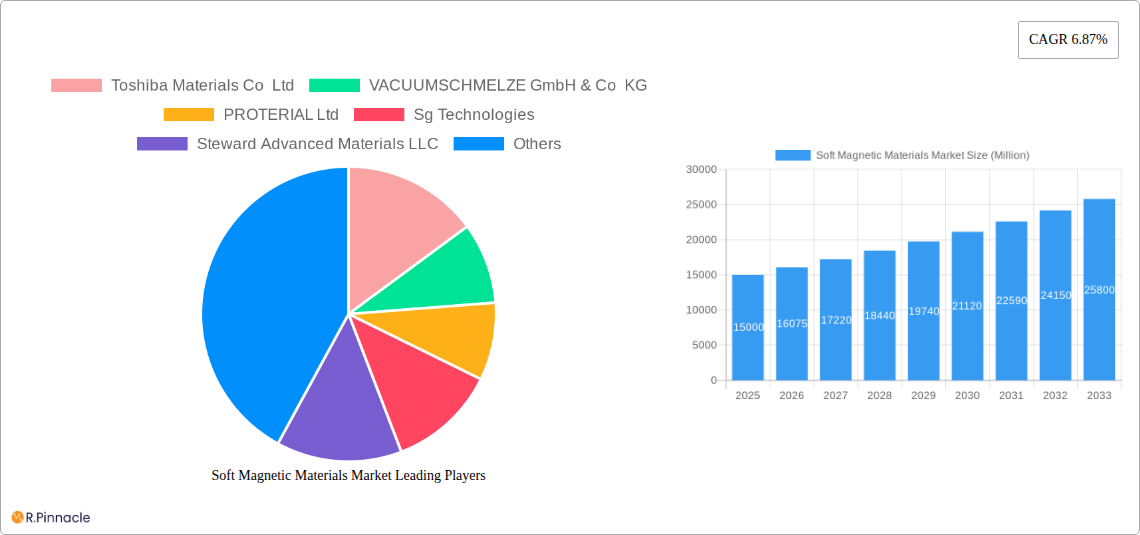
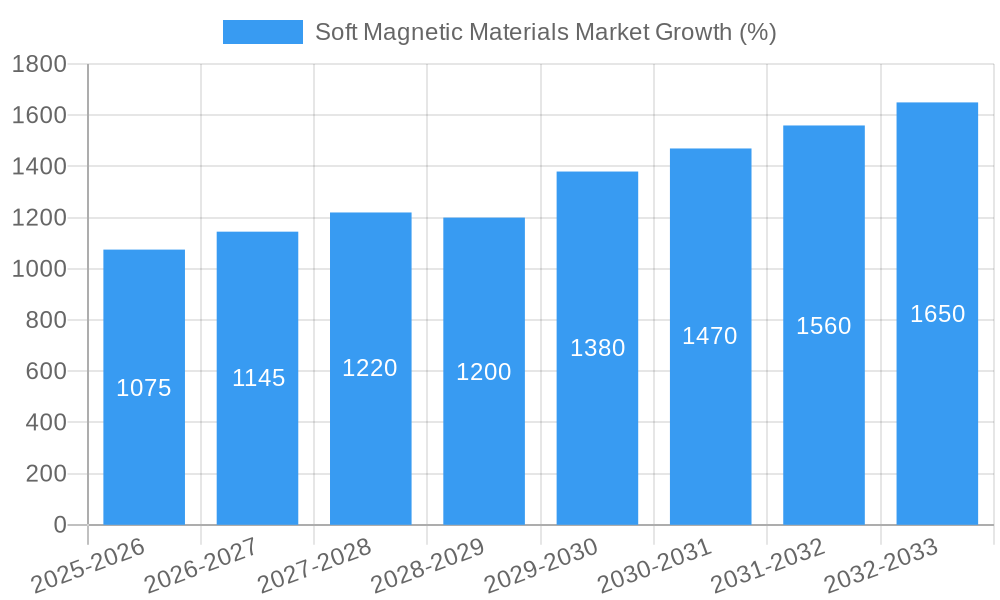
The global soft magnetic materials market is experiencing robust growth, driven by the increasing demand for energy-efficient electronics and electric vehicles. The market, valued at approximately $15 billion in 2025, is projected to expand at a Compound Annual Growth Rate (CAGR) of 6.87% from 2025 to 2033, reaching an estimated $27 billion by 2033. This growth is fueled by several key factors: the burgeoning electric vehicle sector requiring high-performance motors and transformers, the continuous miniaturization and enhanced energy efficiency demands in electronics, and the rising adoption of renewable energy sources necessitating advanced power management technologies. Significant advancements in material science, leading to the development of new soft magnetic composites (SMCs) with improved properties like higher saturation magnetization and lower core losses, are also contributing to market expansion. The electronics segment is currently the largest end-user industry, followed closely by the automotive sector, and both are expected to maintain strong growth throughout the forecast period. Key players in the market are investing heavily in research and development to enhance material performance and expand their product portfolios, further solidifying market competitiveness.
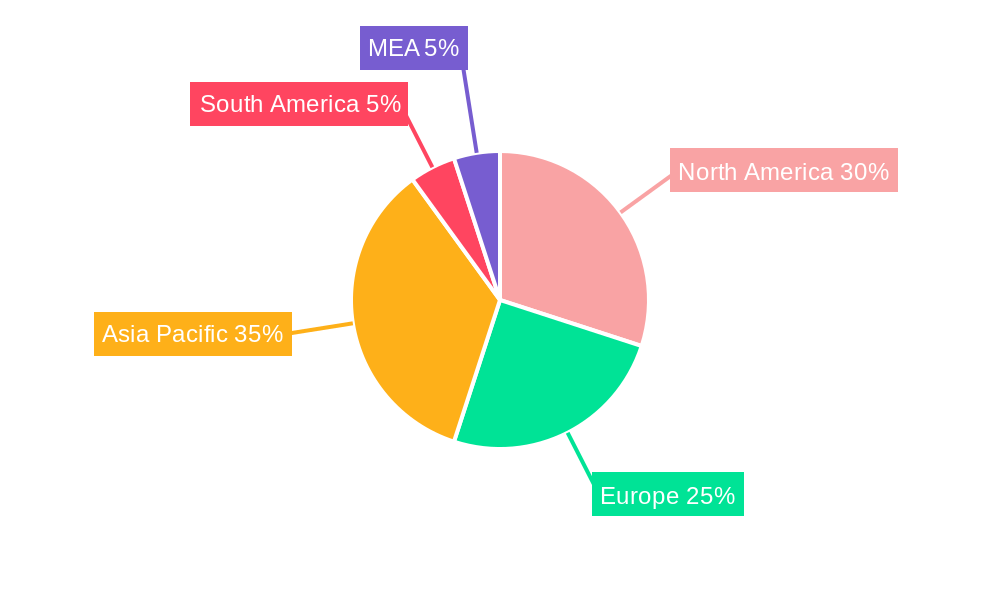
Geographic expansion is another prominent trend. While North America and Europe currently hold significant market shares, the Asia-Pacific region, particularly China and Japan, is witnessing rapid growth due to the concentration of manufacturing hubs for electronics and automotive components. However, the market faces some challenges, including price volatility of raw materials like cobalt and nickel, and concerns regarding the environmental impact of manufacturing certain soft magnetic materials. Despite these restraints, the long-term outlook for the soft magnetic materials market remains highly positive, driven by the continued technological advancements and the ever-increasing demand from key end-use industries. The strategic focus on developing sustainable and cost-effective solutions will be crucial for sustained market success in the coming years.
Soft Magnetic Materials Market Report: 2019-2033 Forecast
This comprehensive report provides an in-depth analysis of the Soft Magnetic Materials market, offering invaluable insights for industry professionals, investors, and strategic decision-makers. Covering the period 2019-2033, with a focus on 2025, this report unveils market dynamics, growth drivers, challenges, and future opportunities, providing a complete understanding of this crucial sector. The global soft magnetic materials market is projected to reach xx Million by 2033, exhibiting a robust CAGR of xx% during the forecast period (2025-2033).
Soft Magnetic Materials Market Structure & Innovation Trends
This section analyzes the competitive landscape, innovation dynamics, and regulatory influences shaping the Soft Magnetic Materials market. The market exhibits a moderately concentrated structure, with key players like Toshiba Materials Co Ltd, VACUUMSCHMELZE GmbH & Co KG, and Daido Steel Co Ltd holding significant market share (exact figures detailed in the full report). Innovation is driven by the increasing demand for energy-efficient devices and electric vehicles, pushing the development of advanced materials like Soft Magnetic Composites (SMC) and high-performance alloys. Mergers and acquisitions (M&A) play a crucial role, with estimated deal values reaching xx Million in the past five years (specific deals and values are outlined within the report). Regulatory frameworks concerning environmental impact and material sourcing also influence market trends. Product substitutes, primarily based on alternative magnetic materials, pose a moderate competitive threat. End-user demographics are diverse, encompassing various industries with unique needs for soft magnetic materials based on their specific application requirements.
- Market Concentration: Moderately concentrated, with top 5 players holding xx% market share.
- Innovation Drivers: Energy efficiency demands, EV adoption, and technological advancements in material science.
- M&A Activity: Significant activity in the past five years, with an estimated total deal value of xx Million.
- Regulatory Landscape: Growing emphasis on environmental sustainability and material sourcing practices.
Soft Magnetic Materials Market Dynamics & Trends
The Soft Magnetic Materials market is experiencing robust growth, fueled by several key factors. The rising demand for electric vehicles, renewable energy technologies, and advanced electronics is driving substantial market expansion. Technological advancements, such as the development of improved SMCs and permalloys, are enhancing product performance and expanding applications. Consumer preference for energy-efficient and high-performance devices further fuels market growth. However, the market faces competitive pressures from material substitutes and fluctuating raw material prices. The market penetration of SMCs is increasing at a CAGR of xx% and is expected to exceed xx% by 2033.
Dominant Regions & Segments in Soft Magnetic Materials Market
The Asia-Pacific region currently dominates the soft magnetic materials market, driven by strong demand from the electronics and automotive industries in countries like China, Japan, and South Korea. Europe and North America follow, fueled by strong demand in these regions.
Key Drivers by Region:
- Asia-Pacific: Rapid industrialization, growing electronics manufacturing, and increasing electric vehicle adoption.
- North America: Strong automotive sector, focus on renewable energy, and advanced technological research.
- Europe: Demand from automotive and industrial sectors, coupled with stringent environmental regulations.
Dominant Segments:
- Material Type: Electric steel currently holds the largest market share, followed by Soft Magnetic Composites (SMC), driven by their high performance and versatility. Growth in electric vehicle applications is driving significant demand for these materials.
- End-user Industry: The electronics industry constitutes the largest end-user segment, followed by the automotive and energy sectors. The industrial segment also presents significant growth potential.
Soft Magnetic Materials Market Product Innovations
Recent advancements include the development of high-performance permalloy foils, designed to effectively suppress EMC noise in electric vehicles and communication devices (as exemplified by Daido Steel's STARPAS-50PC2S). Insulation-coated iron powders, such as JFE Steel's Denjiro, are gaining traction for use in axial gap motors. These innovations reflect a broader trend towards improved material performance, cost-effectiveness, and suitability for diverse applications.
Report Scope & Segmentation Analysis
This report segments the soft magnetic materials market by material type (Electric Steel, Cobalt, Iron, Nickel, Other Material Types) and end-user industry (Electronics, Automotive, Energy, Industrial, Other End-user Industries). Each segment is thoroughly analyzed, projecting growth rates, market sizes, and competitive dynamics. Growth projections vary by segment, with SMCs and the automotive sector showing the most rapid expansion. The full report provides detailed market size estimates for each segment throughout the study period (2019-2033).
Key Drivers of Soft Magnetic Materials Market Growth
Key growth drivers include:
- Rising demand for electric vehicles: driving demand for high-performance soft magnetic materials in motors and power electronics.
- Growth in renewable energy: increasing the need for efficient energy conversion and storage technologies.
- Advancements in electronics: creating demand for smaller, faster, and more energy-efficient components.
Challenges in the Soft Magnetic Materials Market Sector
Challenges include:
- Fluctuations in raw material prices: impacting production costs and profitability.
- Competition from alternative materials: necessitating continuous innovation and product differentiation.
- Stringent environmental regulations: requiring manufacturers to adopt sustainable practices.
Emerging Opportunities in Soft Magnetic Materials Market
Emerging opportunities include:
- Expansion into new applications: such as aerospace and medical devices.
- Development of advanced materials: with enhanced properties like higher saturation magnetization and lower core losses.
- Growth in emerging markets: offering significant untapped potential.
Leading Players in the Soft Magnetic Materials Market Market
- Toshiba Materials Co Ltd
- VACUUMSCHMELZE GmbH & Co KG
- PROTERIAL Ltd
- Sg Technologies
- Steward Advanced Materials LLC
- Daido Steel Co Ltd
- Mate Co Ltd
- Arnold Magnetic Technologies
- Sumitomo Metal Mining Co Ltd
- Mk Magnetics Inc
- JFE Steel Corporation
Key Developments in Soft Magnetic Materials Market Industry
- January 2022: Daido Steel Co., Ltd. launched STARPAS-50PC2S permalloy foil for EMC noise suppression in electric vehicles and communication devices.
- January 2022: JFE Steel Corporation launched Denjiro, an insulation-coated pure iron powder for soft magnetic composites, ideal for axial gap motors.
Future Outlook for Soft Magnetic Materials Market Market
The future of the Soft Magnetic Materials market appears bright, driven by sustained growth in key end-user industries and continuous technological advancements. The increasing adoption of electric vehicles, renewable energy technologies, and advanced electronics will continue to fuel demand. Strategic investments in research and development, coupled with collaborations across the value chain, will shape the market's evolution. Opportunities exist in developing tailored materials for specific applications and penetrating new markets.
Soft Magnetic Materials Market Segmentation
-
1. Material Type
- 1.1. Electric Steel
- 1.2. Cobalt
- 1.3. Iron
- 1.4. Nickel
- 1.5. Other Ma
-
2. End-user Industry
- 2.1. Electronics
- 2.2. Automotive
- 2.3. Energy
- 2.4. Industrial
- 2.5. Other En
Soft Magnetic Materials Market Segmentation By Geography
-
1. Asia Pacific
- 1.1. China
- 1.2. India
- 1.3. Japan
- 1.4. South Korea
- 1.5. Rest of Asia Pacific
-
2. North America
- 2.1. United States
- 2.2. Canada
- 2.3. Mexico
-
3. Europe
- 3.1. Germany
- 3.2. United Kingdom
- 3.3. France
- 3.4. Italy
- 3.5. Rest of Europe
-
4. South America
- 4.1. Brazil
- 4.2. Argentina
- 4.3. Rest of South America
-
5. Middle East and Africa
- 5.1. Saudi Arabia
- 5.2. South Africa
- 5.3. Rest of Middle East and Africa
Soft Magnetic Materials Market REPORT HIGHLIGHTS
| Aspects | Details |
|---|---|
| Study Period | 2019-2033 |
| Base Year | 2024 |
| Estimated Year | 2025 |
| Forecast Period | 2025-2033 |
| Historical Period | 2019-2024 |
| Growth Rate | CAGR of 6.87% from 2019-2033 |
| Segmentation |
|
Table of Contents
- 1. Introduction
- 1.1. Research Scope
- 1.2. Market Segmentation
- 1.3. Research Methodology
- 1.4. Definitions and Assumptions
- 2. Executive Summary
- 2.1. Introduction
- 3. Market Dynamics
- 3.1. Introduction
- 3.2. Market Drivers
- 3.2.1. Growing Applications in Electronics; Increasing Demand for Power Generation Industry; Other Drivers
- 3.3. Market Restrains
- 3.3.1. High Cost of Raw Materials; Other Restraints
- 3.4. Market Trends
- 3.4.1. Electronics and Energy Segment to Dominate the Market
- 4. Market Factor Analysis
- 4.1. Porters Five Forces
- 4.2. Supply/Value Chain
- 4.3. PESTEL analysis
- 4.4. Market Entropy
- 4.5. Patent/Trademark Analysis
- 5. Global Soft Magnetic Materials Market Analysis, Insights and Forecast, 2019-2031
- 5.1. Market Analysis, Insights and Forecast - by Material Type
- 5.1.1. Electric Steel
- 5.1.2. Cobalt
- 5.1.3. Iron
- 5.1.4. Nickel
- 5.1.5. Other Ma
- 5.2. Market Analysis, Insights and Forecast - by End-user Industry
- 5.2.1. Electronics
- 5.2.2. Automotive
- 5.2.3. Energy
- 5.2.4. Industrial
- 5.2.5. Other En
- 5.3. Market Analysis, Insights and Forecast - by Region
- 5.3.1. Asia Pacific
- 5.3.2. North America
- 5.3.3. Europe
- 5.3.4. South America
- 5.3.5. Middle East and Africa
- 5.1. Market Analysis, Insights and Forecast - by Material Type
- 6. Asia Pacific Soft Magnetic Materials Market Analysis, Insights and Forecast, 2019-2031
- 6.1. Market Analysis, Insights and Forecast - by Material Type
- 6.1.1. Electric Steel
- 6.1.2. Cobalt
- 6.1.3. Iron
- 6.1.4. Nickel
- 6.1.5. Other Ma
- 6.2. Market Analysis, Insights and Forecast - by End-user Industry
- 6.2.1. Electronics
- 6.2.2. Automotive
- 6.2.3. Energy
- 6.2.4. Industrial
- 6.2.5. Other En
- 6.1. Market Analysis, Insights and Forecast - by Material Type
- 7. North America Soft Magnetic Materials Market Analysis, Insights and Forecast, 2019-2031
- 7.1. Market Analysis, Insights and Forecast - by Material Type
- 7.1.1. Electric Steel
- 7.1.2. Cobalt
- 7.1.3. Iron
- 7.1.4. Nickel
- 7.1.5. Other Ma
- 7.2. Market Analysis, Insights and Forecast - by End-user Industry
- 7.2.1. Electronics
- 7.2.2. Automotive
- 7.2.3. Energy
- 7.2.4. Industrial
- 7.2.5. Other En
- 7.1. Market Analysis, Insights and Forecast - by Material Type
- 8. Europe Soft Magnetic Materials Market Analysis, Insights and Forecast, 2019-2031
- 8.1. Market Analysis, Insights and Forecast - by Material Type
- 8.1.1. Electric Steel
- 8.1.2. Cobalt
- 8.1.3. Iron
- 8.1.4. Nickel
- 8.1.5. Other Ma
- 8.2. Market Analysis, Insights and Forecast - by End-user Industry
- 8.2.1. Electronics
- 8.2.2. Automotive
- 8.2.3. Energy
- 8.2.4. Industrial
- 8.2.5. Other En
- 8.1. Market Analysis, Insights and Forecast - by Material Type
- 9. South America Soft Magnetic Materials Market Analysis, Insights and Forecast, 2019-2031
- 9.1. Market Analysis, Insights and Forecast - by Material Type
- 9.1.1. Electric Steel
- 9.1.2. Cobalt
- 9.1.3. Iron
- 9.1.4. Nickel
- 9.1.5. Other Ma
- 9.2. Market Analysis, Insights and Forecast - by End-user Industry
- 9.2.1. Electronics
- 9.2.2. Automotive
- 9.2.3. Energy
- 9.2.4. Industrial
- 9.2.5. Other En
- 9.1. Market Analysis, Insights and Forecast - by Material Type
- 10. Middle East and Africa Soft Magnetic Materials Market Analysis, Insights and Forecast, 2019-2031
- 10.1. Market Analysis, Insights and Forecast - by Material Type
- 10.1.1. Electric Steel
- 10.1.2. Cobalt
- 10.1.3. Iron
- 10.1.4. Nickel
- 10.1.5. Other Ma
- 10.2. Market Analysis, Insights and Forecast - by End-user Industry
- 10.2.1. Electronics
- 10.2.2. Automotive
- 10.2.3. Energy
- 10.2.4. Industrial
- 10.2.5. Other En
- 10.1. Market Analysis, Insights and Forecast - by Material Type
- 11. North America Soft Magnetic Materials Market Analysis, Insights and Forecast, 2019-2031
- 11.1. Market Analysis, Insights and Forecast - By Country/Sub-region
- 11.1.1 United States
- 11.1.2 Canada
- 11.1.3 Mexico
- 12. Europe Soft Magnetic Materials Market Analysis, Insights and Forecast, 2019-2031
- 12.1. Market Analysis, Insights and Forecast - By Country/Sub-region
- 12.1.1 Germany
- 12.1.2 France
- 12.1.3 Italy
- 12.1.4 United Kingdom
- 12.1.5 Netherlands
- 12.1.6 Rest of Europe
- 13. Asia Pacific Soft Magnetic Materials Market Analysis, Insights and Forecast, 2019-2031
- 13.1. Market Analysis, Insights and Forecast - By Country/Sub-region
- 13.1.1 China
- 13.1.2 Japan
- 13.1.3 India
- 13.1.4 South Korea
- 13.1.5 Taiwan
- 13.1.6 Australia
- 13.1.7 Rest of Asia-Pacific
- 14. South America Soft Magnetic Materials Market Analysis, Insights and Forecast, 2019-2031
- 14.1. Market Analysis, Insights and Forecast - By Country/Sub-region
- 14.1.1 Brazil
- 14.1.2 Argentina
- 14.1.3 Rest of South America
- 15. MEA Soft Magnetic Materials Market Analysis, Insights and Forecast, 2019-2031
- 15.1. Market Analysis, Insights and Forecast - By Country/Sub-region
- 15.1.1 Middle East
- 15.1.2 Africa
- 16. Competitive Analysis
- 16.1. Global Market Share Analysis 2024
- 16.2. Company Profiles
- 16.2.1 Toshiba Materials Co Ltd
- 16.2.1.1. Overview
- 16.2.1.2. Products
- 16.2.1.3. SWOT Analysis
- 16.2.1.4. Recent Developments
- 16.2.1.5. Financials (Based on Availability)
- 16.2.2 VACUUMSCHMELZE GmbH & Co KG
- 16.2.2.1. Overview
- 16.2.2.2. Products
- 16.2.2.3. SWOT Analysis
- 16.2.2.4. Recent Developments
- 16.2.2.5. Financials (Based on Availability)
- 16.2.3 PROTERIAL Ltd
- 16.2.3.1. Overview
- 16.2.3.2. Products
- 16.2.3.3. SWOT Analysis
- 16.2.3.4. Recent Developments
- 16.2.3.5. Financials (Based on Availability)
- 16.2.4 Sg Technologies
- 16.2.4.1. Overview
- 16.2.4.2. Products
- 16.2.4.3. SWOT Analysis
- 16.2.4.4. Recent Developments
- 16.2.4.5. Financials (Based on Availability)
- 16.2.5 Steward Advanced Materials LLC
- 16.2.5.1. Overview
- 16.2.5.2. Products
- 16.2.5.3. SWOT Analysis
- 16.2.5.4. Recent Developments
- 16.2.5.5. Financials (Based on Availability)
- 16.2.6 Daido Steel Co Ltd
- 16.2.6.1. Overview
- 16.2.6.2. Products
- 16.2.6.3. SWOT Analysis
- 16.2.6.4. Recent Developments
- 16.2.6.5. Financials (Based on Availability)
- 16.2.7 Mate Co Ltd
- 16.2.7.1. Overview
- 16.2.7.2. Products
- 16.2.7.3. SWOT Analysis
- 16.2.7.4. Recent Developments
- 16.2.7.5. Financials (Based on Availability)
- 16.2.8 Arnold Magnetic Technologies
- 16.2.8.1. Overview
- 16.2.8.2. Products
- 16.2.8.3. SWOT Analysis
- 16.2.8.4. Recent Developments
- 16.2.8.5. Financials (Based on Availability)
- 16.2.9 Sumitomo Metal Mining Co Ltd
- 16.2.9.1. Overview
- 16.2.9.2. Products
- 16.2.9.3. SWOT Analysis
- 16.2.9.4. Recent Developments
- 16.2.9.5. Financials (Based on Availability)
- 16.2.10 Mk Magnetics Inc
- 16.2.10.1. Overview
- 16.2.10.2. Products
- 16.2.10.3. SWOT Analysis
- 16.2.10.4. Recent Developments
- 16.2.10.5. Financials (Based on Availability)
- 16.2.11 JFE Steel Corporation
- 16.2.11.1. Overview
- 16.2.11.2. Products
- 16.2.11.3. SWOT Analysis
- 16.2.11.4. Recent Developments
- 16.2.11.5. Financials (Based on Availability)
- 16.2.1 Toshiba Materials Co Ltd
List of Figures
- Figure 1: Global Soft Magnetic Materials Market Revenue Breakdown (Million, %) by Region 2024 & 2032
- Figure 2: Global Soft Magnetic Materials Market Volume Breakdown (K Tons, %) by Region 2024 & 2032
- Figure 3: North America Soft Magnetic Materials Market Revenue (Million), by Country 2024 & 2032
- Figure 4: North America Soft Magnetic Materials Market Volume (K Tons), by Country 2024 & 2032
- Figure 5: North America Soft Magnetic Materials Market Revenue Share (%), by Country 2024 & 2032
- Figure 6: North America Soft Magnetic Materials Market Volume Share (%), by Country 2024 & 2032
- Figure 7: Europe Soft Magnetic Materials Market Revenue (Million), by Country 2024 & 2032
- Figure 8: Europe Soft Magnetic Materials Market Volume (K Tons), by Country 2024 & 2032
- Figure 9: Europe Soft Magnetic Materials Market Revenue Share (%), by Country 2024 & 2032
- Figure 10: Europe Soft Magnetic Materials Market Volume Share (%), by Country 2024 & 2032
- Figure 11: Asia Pacific Soft Magnetic Materials Market Revenue (Million), by Country 2024 & 2032
- Figure 12: Asia Pacific Soft Magnetic Materials Market Volume (K Tons), by Country 2024 & 2032
- Figure 13: Asia Pacific Soft Magnetic Materials Market Revenue Share (%), by Country 2024 & 2032
- Figure 14: Asia Pacific Soft Magnetic Materials Market Volume Share (%), by Country 2024 & 2032
- Figure 15: South America Soft Magnetic Materials Market Revenue (Million), by Country 2024 & 2032
- Figure 16: South America Soft Magnetic Materials Market Volume (K Tons), by Country 2024 & 2032
- Figure 17: South America Soft Magnetic Materials Market Revenue Share (%), by Country 2024 & 2032
- Figure 18: South America Soft Magnetic Materials Market Volume Share (%), by Country 2024 & 2032
- Figure 19: MEA Soft Magnetic Materials Market Revenue (Million), by Country 2024 & 2032
- Figure 20: MEA Soft Magnetic Materials Market Volume (K Tons), by Country 2024 & 2032
- Figure 21: MEA Soft Magnetic Materials Market Revenue Share (%), by Country 2024 & 2032
- Figure 22: MEA Soft Magnetic Materials Market Volume Share (%), by Country 2024 & 2032
- Figure 23: Asia Pacific Soft Magnetic Materials Market Revenue (Million), by Material Type 2024 & 2032
- Figure 24: Asia Pacific Soft Magnetic Materials Market Volume (K Tons), by Material Type 2024 & 2032
- Figure 25: Asia Pacific Soft Magnetic Materials Market Revenue Share (%), by Material Type 2024 & 2032
- Figure 26: Asia Pacific Soft Magnetic Materials Market Volume Share (%), by Material Type 2024 & 2032
- Figure 27: Asia Pacific Soft Magnetic Materials Market Revenue (Million), by End-user Industry 2024 & 2032
- Figure 28: Asia Pacific Soft Magnetic Materials Market Volume (K Tons), by End-user Industry 2024 & 2032
- Figure 29: Asia Pacific Soft Magnetic Materials Market Revenue Share (%), by End-user Industry 2024 & 2032
- Figure 30: Asia Pacific Soft Magnetic Materials Market Volume Share (%), by End-user Industry 2024 & 2032
- Figure 31: Asia Pacific Soft Magnetic Materials Market Revenue (Million), by Country 2024 & 2032
- Figure 32: Asia Pacific Soft Magnetic Materials Market Volume (K Tons), by Country 2024 & 2032
- Figure 33: Asia Pacific Soft Magnetic Materials Market Revenue Share (%), by Country 2024 & 2032
- Figure 34: Asia Pacific Soft Magnetic Materials Market Volume Share (%), by Country 2024 & 2032
- Figure 35: North America Soft Magnetic Materials Market Revenue (Million), by Material Type 2024 & 2032
- Figure 36: North America Soft Magnetic Materials Market Volume (K Tons), by Material Type 2024 & 2032
- Figure 37: North America Soft Magnetic Materials Market Revenue Share (%), by Material Type 2024 & 2032
- Figure 38: North America Soft Magnetic Materials Market Volume Share (%), by Material Type 2024 & 2032
- Figure 39: North America Soft Magnetic Materials Market Revenue (Million), by End-user Industry 2024 & 2032
- Figure 40: North America Soft Magnetic Materials Market Volume (K Tons), by End-user Industry 2024 & 2032
- Figure 41: North America Soft Magnetic Materials Market Revenue Share (%), by End-user Industry 2024 & 2032
- Figure 42: North America Soft Magnetic Materials Market Volume Share (%), by End-user Industry 2024 & 2032
- Figure 43: North America Soft Magnetic Materials Market Revenue (Million), by Country 2024 & 2032
- Figure 44: North America Soft Magnetic Materials Market Volume (K Tons), by Country 2024 & 2032
- Figure 45: North America Soft Magnetic Materials Market Revenue Share (%), by Country 2024 & 2032
- Figure 46: North America Soft Magnetic Materials Market Volume Share (%), by Country 2024 & 2032
- Figure 47: Europe Soft Magnetic Materials Market Revenue (Million), by Material Type 2024 & 2032
- Figure 48: Europe Soft Magnetic Materials Market Volume (K Tons), by Material Type 2024 & 2032
- Figure 49: Europe Soft Magnetic Materials Market Revenue Share (%), by Material Type 2024 & 2032
- Figure 50: Europe Soft Magnetic Materials Market Volume Share (%), by Material Type 2024 & 2032
- Figure 51: Europe Soft Magnetic Materials Market Revenue (Million), by End-user Industry 2024 & 2032
- Figure 52: Europe Soft Magnetic Materials Market Volume (K Tons), by End-user Industry 2024 & 2032
- Figure 53: Europe Soft Magnetic Materials Market Revenue Share (%), by End-user Industry 2024 & 2032
- Figure 54: Europe Soft Magnetic Materials Market Volume Share (%), by End-user Industry 2024 & 2032
- Figure 55: Europe Soft Magnetic Materials Market Revenue (Million), by Country 2024 & 2032
- Figure 56: Europe Soft Magnetic Materials Market Volume (K Tons), by Country 2024 & 2032
- Figure 57: Europe Soft Magnetic Materials Market Revenue Share (%), by Country 2024 & 2032
- Figure 58: Europe Soft Magnetic Materials Market Volume Share (%), by Country 2024 & 2032
- Figure 59: South America Soft Magnetic Materials Market Revenue (Million), by Material Type 2024 & 2032
- Figure 60: South America Soft Magnetic Materials Market Volume (K Tons), by Material Type 2024 & 2032
- Figure 61: South America Soft Magnetic Materials Market Revenue Share (%), by Material Type 2024 & 2032
- Figure 62: South America Soft Magnetic Materials Market Volume Share (%), by Material Type 2024 & 2032
- Figure 63: South America Soft Magnetic Materials Market Revenue (Million), by End-user Industry 2024 & 2032
- Figure 64: South America Soft Magnetic Materials Market Volume (K Tons), by End-user Industry 2024 & 2032
- Figure 65: South America Soft Magnetic Materials Market Revenue Share (%), by End-user Industry 2024 & 2032
- Figure 66: South America Soft Magnetic Materials Market Volume Share (%), by End-user Industry 2024 & 2032
- Figure 67: South America Soft Magnetic Materials Market Revenue (Million), by Country 2024 & 2032
- Figure 68: South America Soft Magnetic Materials Market Volume (K Tons), by Country 2024 & 2032
- Figure 69: South America Soft Magnetic Materials Market Revenue Share (%), by Country 2024 & 2032
- Figure 70: South America Soft Magnetic Materials Market Volume Share (%), by Country 2024 & 2032
- Figure 71: Middle East and Africa Soft Magnetic Materials Market Revenue (Million), by Material Type 2024 & 2032
- Figure 72: Middle East and Africa Soft Magnetic Materials Market Volume (K Tons), by Material Type 2024 & 2032
- Figure 73: Middle East and Africa Soft Magnetic Materials Market Revenue Share (%), by Material Type 2024 & 2032
- Figure 74: Middle East and Africa Soft Magnetic Materials Market Volume Share (%), by Material Type 2024 & 2032
- Figure 75: Middle East and Africa Soft Magnetic Materials Market Revenue (Million), by End-user Industry 2024 & 2032
- Figure 76: Middle East and Africa Soft Magnetic Materials Market Volume (K Tons), by End-user Industry 2024 & 2032
- Figure 77: Middle East and Africa Soft Magnetic Materials Market Revenue Share (%), by End-user Industry 2024 & 2032
- Figure 78: Middle East and Africa Soft Magnetic Materials Market Volume Share (%), by End-user Industry 2024 & 2032
- Figure 79: Middle East and Africa Soft Magnetic Materials Market Revenue (Million), by Country 2024 & 2032
- Figure 80: Middle East and Africa Soft Magnetic Materials Market Volume (K Tons), by Country 2024 & 2032
- Figure 81: Middle East and Africa Soft Magnetic Materials Market Revenue Share (%), by Country 2024 & 2032
- Figure 82: Middle East and Africa Soft Magnetic Materials Market Volume Share (%), by Country 2024 & 2032
List of Tables
- Table 1: Global Soft Magnetic Materials Market Revenue Million Forecast, by Region 2019 & 2032
- Table 2: Global Soft Magnetic Materials Market Volume K Tons Forecast, by Region 2019 & 2032
- Table 3: Global Soft Magnetic Materials Market Revenue Million Forecast, by Material Type 2019 & 2032
- Table 4: Global Soft Magnetic Materials Market Volume K Tons Forecast, by Material Type 2019 & 2032
- Table 5: Global Soft Magnetic Materials Market Revenue Million Forecast, by End-user Industry 2019 & 2032
- Table 6: Global Soft Magnetic Materials Market Volume K Tons Forecast, by End-user Industry 2019 & 2032
- Table 7: Global Soft Magnetic Materials Market Revenue Million Forecast, by Region 2019 & 2032
- Table 8: Global Soft Magnetic Materials Market Volume K Tons Forecast, by Region 2019 & 2032
- Table 9: Global Soft Magnetic Materials Market Revenue Million Forecast, by Country 2019 & 2032
- Table 10: Global Soft Magnetic Materials Market Volume K Tons Forecast, by Country 2019 & 2032
- Table 11: United States Soft Magnetic Materials Market Revenue (Million) Forecast, by Application 2019 & 2032
- Table 12: United States Soft Magnetic Materials Market Volume (K Tons) Forecast, by Application 2019 & 2032
- Table 13: Canada Soft Magnetic Materials Market Revenue (Million) Forecast, by Application 2019 & 2032
- Table 14: Canada Soft Magnetic Materials Market Volume (K Tons) Forecast, by Application 2019 & 2032
- Table 15: Mexico Soft Magnetic Materials Market Revenue (Million) Forecast, by Application 2019 & 2032
- Table 16: Mexico Soft Magnetic Materials Market Volume (K Tons) Forecast, by Application 2019 & 2032
- Table 17: Global Soft Magnetic Materials Market Revenue Million Forecast, by Country 2019 & 2032
- Table 18: Global Soft Magnetic Materials Market Volume K Tons Forecast, by Country 2019 & 2032
- Table 19: Germany Soft Magnetic Materials Market Revenue (Million) Forecast, by Application 2019 & 2032
- Table 20: Germany Soft Magnetic Materials Market Volume (K Tons) Forecast, by Application 2019 & 2032
- Table 21: France Soft Magnetic Materials Market Revenue (Million) Forecast, by Application 2019 & 2032
- Table 22: France Soft Magnetic Materials Market Volume (K Tons) Forecast, by Application 2019 & 2032
- Table 23: Italy Soft Magnetic Materials Market Revenue (Million) Forecast, by Application 2019 & 2032
- Table 24: Italy Soft Magnetic Materials Market Volume (K Tons) Forecast, by Application 2019 & 2032
- Table 25: United Kingdom Soft Magnetic Materials Market Revenue (Million) Forecast, by Application 2019 & 2032
- Table 26: United Kingdom Soft Magnetic Materials Market Volume (K Tons) Forecast, by Application 2019 & 2032
- Table 27: Netherlands Soft Magnetic Materials Market Revenue (Million) Forecast, by Application 2019 & 2032
- Table 28: Netherlands Soft Magnetic Materials Market Volume (K Tons) Forecast, by Application 2019 & 2032
- Table 29: Rest of Europe Soft Magnetic Materials Market Revenue (Million) Forecast, by Application 2019 & 2032
- Table 30: Rest of Europe Soft Magnetic Materials Market Volume (K Tons) Forecast, by Application 2019 & 2032
- Table 31: Global Soft Magnetic Materials Market Revenue Million Forecast, by Country 2019 & 2032
- Table 32: Global Soft Magnetic Materials Market Volume K Tons Forecast, by Country 2019 & 2032
- Table 33: China Soft Magnetic Materials Market Revenue (Million) Forecast, by Application 2019 & 2032
- Table 34: China Soft Magnetic Materials Market Volume (K Tons) Forecast, by Application 2019 & 2032
- Table 35: Japan Soft Magnetic Materials Market Revenue (Million) Forecast, by Application 2019 & 2032
- Table 36: Japan Soft Magnetic Materials Market Volume (K Tons) Forecast, by Application 2019 & 2032
- Table 37: India Soft Magnetic Materials Market Revenue (Million) Forecast, by Application 2019 & 2032
- Table 38: India Soft Magnetic Materials Market Volume (K Tons) Forecast, by Application 2019 & 2032
- Table 39: South Korea Soft Magnetic Materials Market Revenue (Million) Forecast, by Application 2019 & 2032
- Table 40: South Korea Soft Magnetic Materials Market Volume (K Tons) Forecast, by Application 2019 & 2032
- Table 41: Taiwan Soft Magnetic Materials Market Revenue (Million) Forecast, by Application 2019 & 2032
- Table 42: Taiwan Soft Magnetic Materials Market Volume (K Tons) Forecast, by Application 2019 & 2032
- Table 43: Australia Soft Magnetic Materials Market Revenue (Million) Forecast, by Application 2019 & 2032
- Table 44: Australia Soft Magnetic Materials Market Volume (K Tons) Forecast, by Application 2019 & 2032
- Table 45: Rest of Asia-Pacific Soft Magnetic Materials Market Revenue (Million) Forecast, by Application 2019 & 2032
- Table 46: Rest of Asia-Pacific Soft Magnetic Materials Market Volume (K Tons) Forecast, by Application 2019 & 2032
- Table 47: Global Soft Magnetic Materials Market Revenue Million Forecast, by Country 2019 & 2032
- Table 48: Global Soft Magnetic Materials Market Volume K Tons Forecast, by Country 2019 & 2032
- Table 49: Brazil Soft Magnetic Materials Market Revenue (Million) Forecast, by Application 2019 & 2032
- Table 50: Brazil Soft Magnetic Materials Market Volume (K Tons) Forecast, by Application 2019 & 2032
- Table 51: Argentina Soft Magnetic Materials Market Revenue (Million) Forecast, by Application 2019 & 2032
- Table 52: Argentina Soft Magnetic Materials Market Volume (K Tons) Forecast, by Application 2019 & 2032
- Table 53: Rest of South America Soft Magnetic Materials Market Revenue (Million) Forecast, by Application 2019 & 2032
- Table 54: Rest of South America Soft Magnetic Materials Market Volume (K Tons) Forecast, by Application 2019 & 2032
- Table 55: Global Soft Magnetic Materials Market Revenue Million Forecast, by Country 2019 & 2032
- Table 56: Global Soft Magnetic Materials Market Volume K Tons Forecast, by Country 2019 & 2032
- Table 57: Middle East Soft Magnetic Materials Market Revenue (Million) Forecast, by Application 2019 & 2032
- Table 58: Middle East Soft Magnetic Materials Market Volume (K Tons) Forecast, by Application 2019 & 2032
- Table 59: Africa Soft Magnetic Materials Market Revenue (Million) Forecast, by Application 2019 & 2032
- Table 60: Africa Soft Magnetic Materials Market Volume (K Tons) Forecast, by Application 2019 & 2032
- Table 61: Global Soft Magnetic Materials Market Revenue Million Forecast, by Material Type 2019 & 2032
- Table 62: Global Soft Magnetic Materials Market Volume K Tons Forecast, by Material Type 2019 & 2032
- Table 63: Global Soft Magnetic Materials Market Revenue Million Forecast, by End-user Industry 2019 & 2032
- Table 64: Global Soft Magnetic Materials Market Volume K Tons Forecast, by End-user Industry 2019 & 2032
- Table 65: Global Soft Magnetic Materials Market Revenue Million Forecast, by Country 2019 & 2032
- Table 66: Global Soft Magnetic Materials Market Volume K Tons Forecast, by Country 2019 & 2032
- Table 67: China Soft Magnetic Materials Market Revenue (Million) Forecast, by Application 2019 & 2032
- Table 68: China Soft Magnetic Materials Market Volume (K Tons) Forecast, by Application 2019 & 2032
- Table 69: India Soft Magnetic Materials Market Revenue (Million) Forecast, by Application 2019 & 2032
- Table 70: India Soft Magnetic Materials Market Volume (K Tons) Forecast, by Application 2019 & 2032
- Table 71: Japan Soft Magnetic Materials Market Revenue (Million) Forecast, by Application 2019 & 2032
- Table 72: Japan Soft Magnetic Materials Market Volume (K Tons) Forecast, by Application 2019 & 2032
- Table 73: South Korea Soft Magnetic Materials Market Revenue (Million) Forecast, by Application 2019 & 2032
- Table 74: South Korea Soft Magnetic Materials Market Volume (K Tons) Forecast, by Application 2019 & 2032
- Table 75: Rest of Asia Pacific Soft Magnetic Materials Market Revenue (Million) Forecast, by Application 2019 & 2032
- Table 76: Rest of Asia Pacific Soft Magnetic Materials Market Volume (K Tons) Forecast, by Application 2019 & 2032
- Table 77: Global Soft Magnetic Materials Market Revenue Million Forecast, by Material Type 2019 & 2032
- Table 78: Global Soft Magnetic Materials Market Volume K Tons Forecast, by Material Type 2019 & 2032
- Table 79: Global Soft Magnetic Materials Market Revenue Million Forecast, by End-user Industry 2019 & 2032
- Table 80: Global Soft Magnetic Materials Market Volume K Tons Forecast, by End-user Industry 2019 & 2032
- Table 81: Global Soft Magnetic Materials Market Revenue Million Forecast, by Country 2019 & 2032
- Table 82: Global Soft Magnetic Materials Market Volume K Tons Forecast, by Country 2019 & 2032
- Table 83: United States Soft Magnetic Materials Market Revenue (Million) Forecast, by Application 2019 & 2032
- Table 84: United States Soft Magnetic Materials Market Volume (K Tons) Forecast, by Application 2019 & 2032
- Table 85: Canada Soft Magnetic Materials Market Revenue (Million) Forecast, by Application 2019 & 2032
- Table 86: Canada Soft Magnetic Materials Market Volume (K Tons) Forecast, by Application 2019 & 2032
- Table 87: Mexico Soft Magnetic Materials Market Revenue (Million) Forecast, by Application 2019 & 2032
- Table 88: Mexico Soft Magnetic Materials Market Volume (K Tons) Forecast, by Application 2019 & 2032
- Table 89: Global Soft Magnetic Materials Market Revenue Million Forecast, by Material Type 2019 & 2032
- Table 90: Global Soft Magnetic Materials Market Volume K Tons Forecast, by Material Type 2019 & 2032
- Table 91: Global Soft Magnetic Materials Market Revenue Million Forecast, by End-user Industry 2019 & 2032
- Table 92: Global Soft Magnetic Materials Market Volume K Tons Forecast, by End-user Industry 2019 & 2032
- Table 93: Global Soft Magnetic Materials Market Revenue Million Forecast, by Country 2019 & 2032
- Table 94: Global Soft Magnetic Materials Market Volume K Tons Forecast, by Country 2019 & 2032
- Table 95: Germany Soft Magnetic Materials Market Revenue (Million) Forecast, by Application 2019 & 2032
- Table 96: Germany Soft Magnetic Materials Market Volume (K Tons) Forecast, by Application 2019 & 2032
- Table 97: United Kingdom Soft Magnetic Materials Market Revenue (Million) Forecast, by Application 2019 & 2032
- Table 98: United Kingdom Soft Magnetic Materials Market Volume (K Tons) Forecast, by Application 2019 & 2032
- Table 99: France Soft Magnetic Materials Market Revenue (Million) Forecast, by Application 2019 & 2032
- Table 100: France Soft Magnetic Materials Market Volume (K Tons) Forecast, by Application 2019 & 2032
- Table 101: Italy Soft Magnetic Materials Market Revenue (Million) Forecast, by Application 2019 & 2032
- Table 102: Italy Soft Magnetic Materials Market Volume (K Tons) Forecast, by Application 2019 & 2032
- Table 103: Rest of Europe Soft Magnetic Materials Market Revenue (Million) Forecast, by Application 2019 & 2032
- Table 104: Rest of Europe Soft Magnetic Materials Market Volume (K Tons) Forecast, by Application 2019 & 2032
- Table 105: Global Soft Magnetic Materials Market Revenue Million Forecast, by Material Type 2019 & 2032
- Table 106: Global Soft Magnetic Materials Market Volume K Tons Forecast, by Material Type 2019 & 2032
- Table 107: Global Soft Magnetic Materials Market Revenue Million Forecast, by End-user Industry 2019 & 2032
- Table 108: Global Soft Magnetic Materials Market Volume K Tons Forecast, by End-user Industry 2019 & 2032
- Table 109: Global Soft Magnetic Materials Market Revenue Million Forecast, by Country 2019 & 2032
- Table 110: Global Soft Magnetic Materials Market Volume K Tons Forecast, by Country 2019 & 2032
- Table 111: Brazil Soft Magnetic Materials Market Revenue (Million) Forecast, by Application 2019 & 2032
- Table 112: Brazil Soft Magnetic Materials Market Volume (K Tons) Forecast, by Application 2019 & 2032
- Table 113: Argentina Soft Magnetic Materials Market Revenue (Million) Forecast, by Application 2019 & 2032
- Table 114: Argentina Soft Magnetic Materials Market Volume (K Tons) Forecast, by Application 2019 & 2032
- Table 115: Rest of South America Soft Magnetic Materials Market Revenue (Million) Forecast, by Application 2019 & 2032
- Table 116: Rest of South America Soft Magnetic Materials Market Volume (K Tons) Forecast, by Application 2019 & 2032
- Table 117: Global Soft Magnetic Materials Market Revenue Million Forecast, by Material Type 2019 & 2032
- Table 118: Global Soft Magnetic Materials Market Volume K Tons Forecast, by Material Type 2019 & 2032
- Table 119: Global Soft Magnetic Materials Market Revenue Million Forecast, by End-user Industry 2019 & 2032
- Table 120: Global Soft Magnetic Materials Market Volume K Tons Forecast, by End-user Industry 2019 & 2032
- Table 121: Global Soft Magnetic Materials Market Revenue Million Forecast, by Country 2019 & 2032
- Table 122: Global Soft Magnetic Materials Market Volume K Tons Forecast, by Country 2019 & 2032
- Table 123: Saudi Arabia Soft Magnetic Materials Market Revenue (Million) Forecast, by Application 2019 & 2032
- Table 124: Saudi Arabia Soft Magnetic Materials Market Volume (K Tons) Forecast, by Application 2019 & 2032
- Table 125: South Africa Soft Magnetic Materials Market Revenue (Million) Forecast, by Application 2019 & 2032
- Table 126: South Africa Soft Magnetic Materials Market Volume (K Tons) Forecast, by Application 2019 & 2032
- Table 127: Rest of Middle East and Africa Soft Magnetic Materials Market Revenue (Million) Forecast, by Application 2019 & 2032
- Table 128: Rest of Middle East and Africa Soft Magnetic Materials Market Volume (K Tons) Forecast, by Application 2019 & 2032
Frequently Asked Questions
1. What is the projected Compound Annual Growth Rate (CAGR) of the Soft Magnetic Materials Market?
The projected CAGR is approximately 6.87%.
2. Which companies are prominent players in the Soft Magnetic Materials Market?
Key companies in the market include Toshiba Materials Co Ltd, VACUUMSCHMELZE GmbH & Co KG, PROTERIAL Ltd, Sg Technologies, Steward Advanced Materials LLC, Daido Steel Co Ltd, Mate Co Ltd, Arnold Magnetic Technologies, Sumitomo Metal Mining Co Ltd, Mk Magnetics Inc, JFE Steel Corporation.
3. What are the main segments of the Soft Magnetic Materials Market?
The market segments include Material Type, End-user Industry.
4. Can you provide details about the market size?
The market size is estimated to be USD XX Million as of 2022.
5. What are some drivers contributing to market growth?
Growing Applications in Electronics; Increasing Demand for Power Generation Industry; Other Drivers.
6. What are the notable trends driving market growth?
Electronics and Energy Segment to Dominate the Market.
7. Are there any restraints impacting market growth?
High Cost of Raw Materials; Other Restraints.
8. Can you provide examples of recent developments in the market?
January 2022: Daido Steel Co., Ltd. has introduced a new product, called STARPAS-50PC2S permalloy foil, which is designed to effectively suppress EMC noise, particularly magnetic noise, at low frequencies below approximately 100kHz. This noise is usually caused by higher frequencies in communication and IoT devices, as well as electric automobiles. This product launch is expected to boost the soft magnetic material market.
9. What pricing options are available for accessing the report?
Pricing options include single-user, multi-user, and enterprise licenses priced at USD 4750, USD 5250, and USD 8750 respectively.
10. Is the market size provided in terms of value or volume?
The market size is provided in terms of value, measured in Million and volume, measured in K Tons.
11. Are there any specific market keywords associated with the report?
Yes, the market keyword associated with the report is "Soft Magnetic Materials Market," which aids in identifying and referencing the specific market segment covered.
12. How do I determine which pricing option suits my needs best?
The pricing options vary based on user requirements and access needs. Individual users may opt for single-user licenses, while businesses requiring broader access may choose multi-user or enterprise licenses for cost-effective access to the report.
13. Are there any additional resources or data provided in the Soft Magnetic Materials Market report?
While the report offers comprehensive insights, it's advisable to review the specific contents or supplementary materials provided to ascertain if additional resources or data are available.
14. How can I stay updated on further developments or reports in the Soft Magnetic Materials Market?
To stay informed about further developments, trends, and reports in the Soft Magnetic Materials Market, consider subscribing to industry newsletters, following relevant companies and organizations, or regularly checking reputable industry news sources and publications.
Methodology
Step 1 - Identification of Relevant Samples Size from Population Database


Step 2 - Approaches for Defining Global Market Size (Value, Volume* & Price*)

Note*: In applicable scenarios
Step 3 - Data Sources
Primary Research
- Web Analytics
- Survey Reports
- Research Institute
- Latest Research Reports
- Opinion Leaders
Secondary Research
- Annual Reports
- White Paper
- Latest Press Release
- Industry Association
- Paid Database
- Investor Presentations

Step 4 - Data Triangulation
Involves using different sources of information in order to increase the validity of a study
These sources are likely to be stakeholders in a program - participants, other researchers, program staff, other community members, and so on.
Then we put all data in single framework & apply various statistical tools to find out the dynamic on the market.
During the analysis stage, feedback from the stakeholder groups would be compared to determine areas of agreement as well as areas of divergence


