
Key Insights
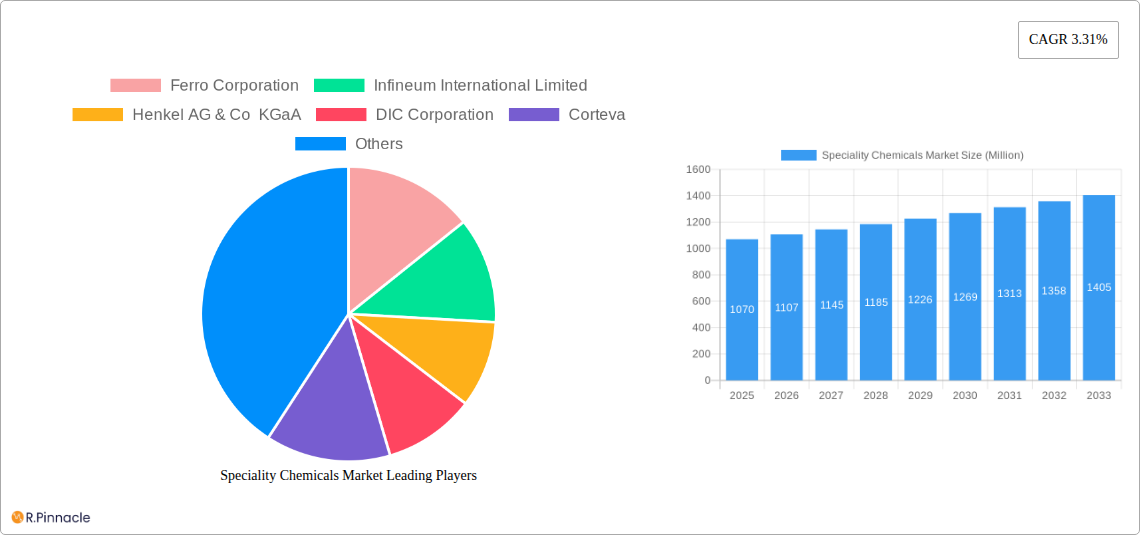
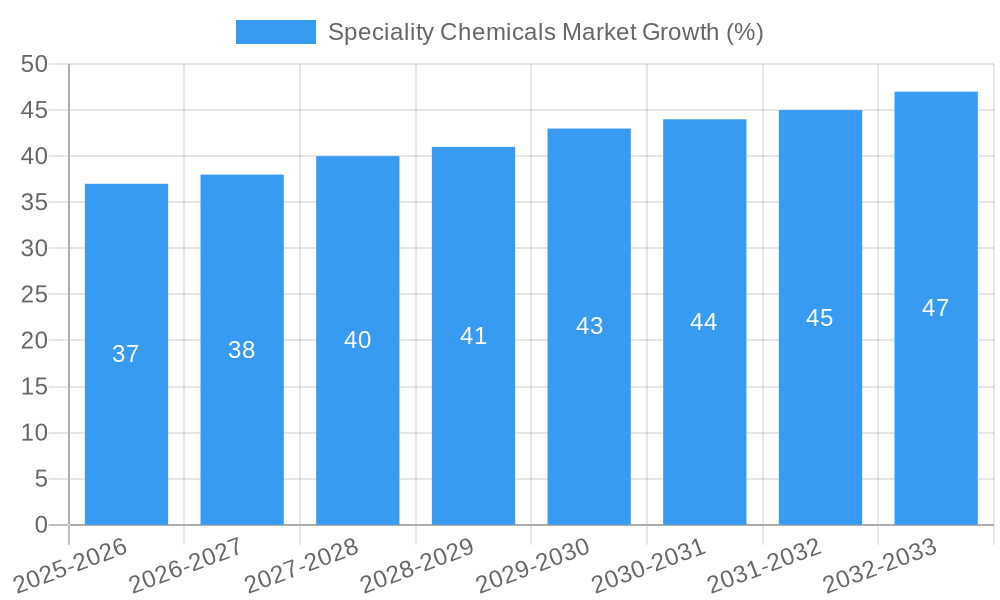
The global specialty chemicals market, valued at $1.07 billion in 2025, is projected to experience robust growth, driven by increasing demand across diverse sectors. A compound annual growth rate (CAGR) of 3.31% from 2025 to 2033 indicates a steady expansion, fueled by several key factors. The rising adoption of advanced technologies in various end-use industries, such as electronics and construction, is a significant driver. Furthermore, the growing focus on sustainability and environmentally friendly solutions is propelling demand for bio-based and biodegradable specialty chemicals. Specific segments like water treatment chemicals, driven by stricter environmental regulations, and electronic chemicals, fueled by the electronics industry's expansion, are expected to contribute significantly to overall market growth. While potential restraints such as fluctuating raw material prices and stringent regulatory compliance could impact growth, the overall market outlook remains positive due to continuous innovation and expanding application areas.
The market segmentation reveals a diverse landscape, with water treatment chemicals, lubricant additives, adhesives and sealants, plastic additives, construction chemicals, electronic chemicals, dyes, inks, and pigments, specialty polymers, oilfield chemicals, rubber processing chemicals, textile chemicals, catalysts, agrochemicals, food additives, industrial and institutional cleaners, mining chemicals, paints and coatings, and cosmetic chemicals all contributing to the overall market value. Geographic analysis reveals that regions like Asia Pacific, particularly China and India, are expected to witness substantial growth due to rapid industrialization and infrastructure development. North America and Europe are anticipated to maintain significant market shares due to established industries and robust R&D activities. Key players like Ferro Corporation, Infineum International Limited, Henkel AG & Co KGaA, and Clariant are strategically positioning themselves to capitalize on these growth opportunities through innovation, mergers and acquisitions, and expanding their product portfolios. The market's future trajectory will depend heavily on the interplay between technological advancements, regulatory changes, and global economic conditions.
Speciality Chemicals Market Report: A Comprehensive Analysis (2019-2033)
This comprehensive report provides an in-depth analysis of the global Speciality Chemicals market, offering invaluable insights for industry professionals, investors, and strategic decision-makers. Covering the period from 2019 to 2033, with a focus on 2025, this report meticulously examines market dynamics, segmentation, key players, and future growth prospects. The report leverages robust data and in-depth analysis to provide actionable intelligence, enabling informed strategic planning and investment decisions.
Speciality Chemicals Market Structure & Innovation Trends
The Speciality Chemicals market exhibits a moderately concentrated structure, with key players like Ferro Corporation, Infineum International Limited, Henkel AG & Co KGaA, and Clariant holding significant market share. The exact market share distribution is xx% across these key players, with the remaining share distributed amongst numerous smaller players. Innovation is driven by stringent environmental regulations, the demand for high-performance materials, and advancements in nanotechnology and biotechnology. Mergers and acquisitions (M&A) activity has been significant, with deal values totaling approximately $xx Million in the past five years. These M&A activities are largely driven by the pursuit of technological advancements, expansion into new geographic markets, and consolidation to gain a larger market share.
- Market Concentration: Moderately concentrated, with a few dominant players.
- Innovation Drivers: Stringent environmental regulations, demand for high-performance materials, advancements in nanotechnology and biotechnology.
- Regulatory Frameworks: Vary significantly across regions, impacting product development and market access.
- Product Substitutes: Emerging bio-based and sustainable alternatives pose a potential threat.
- End-User Demographics: Diverse, spanning various industries including construction, automotive, electronics, and healthcare.
- M&A Activity: Significant, with total deal values reaching $xx Million in the past five years.
Speciality Chemicals Market Dynamics & Trends
The Speciality Chemicals market is experiencing robust growth, driven by increasing demand across various end-use industries. The market is expected to achieve a Compound Annual Growth Rate (CAGR) of xx% during the forecast period (2025-2033). This growth is fueled by several factors, including rising industrialization, rapid urbanization, and technological advancements leading to the development of innovative speciality chemicals. Consumer preferences for eco-friendly and sustainable products are also significantly shaping market trends. Competitive dynamics are intense, with established players focusing on innovation and expansion, while new entrants aim to carve out niches with specialized products and services. Market penetration in developing economies is on the rise due to increased industrialization and infrastructure development.
Dominant Regions & Segments in Speciality Chemicals Market
The Asia-Pacific region currently dominates the Speciality Chemicals market, driven by robust economic growth and increasing industrial activity. North America and Europe also represent significant markets.
Key Drivers (by Region):
- Asia-Pacific: Rapid industrialization, rising infrastructure investment, increasing disposable income.
- North America: Strong demand from automotive, construction, and electronics industries, robust R&D activities.
- Europe: Stringent environmental regulations driving demand for eco-friendly products, strong emphasis on sustainability.
Dominant Segments:
- Water Treatment Chemicals: The largest segment due to growing concerns about water scarcity and pollution; demand is driven by both industrial and municipal applications. Functionally, coagulation and flocculation agents are most dominant.
- Lubricant Additives: Significant growth driven by the automotive and industrial sectors; demand is largely dominated by dispersants and viscosity modifiers.
- Adhesives and Sealants: Driven by construction and automotive applications; new advancements in technology are shaping product innovations with advanced polymeric materials gaining traction.
- Plastic Additives: Driven by the packaging and consumer goods sectors; different types of plastics have varying demands depending on their application.
- Construction Chemicals: Driven by ongoing construction projects worldwide; admixtures and concrete additives are in high demand.
- Electronic Chemicals: Driven by the electronics manufacturing sector; high purity and specific performance requirements are driving the market.
- Dyes, Inks, and Pigments: Driven by textile, packaging, and printing industries; specific types of dyes such as reactive and disperse dyes are more demanded depending on the end-use applications.
- Specialty Polymers: Driven by diverse applications across multiple industries; specific types of polymers are developed to meet the performance requirements of different applications.
- Oilfield Chemicals: Driven by ongoing oil and gas exploration and production; demand is largely influenced by drilling and production activities.
- Rubber Processing Chemicals: Driven by the tire and rubber goods industry; specific chemicals contribute to enhancing the performance and durability of rubber products.
- Textile Chemicals: Driven by the textile industry; different chemical treatments enhance the properties of textiles.
- Catalysts: Driven by the chemical industry and other process industries; specific catalysts are required for different chemical reactions.
- Agrochemicals: Driven by the agricultural sector; specific types of agrochemicals like herbicides, pesticides, and fertilizers show variable demand depending on the crops.
- Food Additives: Driven by the food processing industry; specific types of additives are used to enhance the quality and shelf life of food.
- Industrial and Institutional Cleaners: Driven by various industries and institutions; cleaning agents show varying demand based on their applications.
- Mining Chemicals: Driven by mining activities; flocculants and other chemicals are extensively used in the mining process.
- Paints and Coatings: Driven by construction, automotive, and industrial sectors; specific types of paints and coatings are formulated for specific applications.
- Cosmetic Chemicals: Driven by the cosmetic and personal care industries; specialized chemicals contribute to enhancing the quality of cosmetic products.
Speciality Chemicals Market Product Innovations
Recent product innovations focus on sustainable, bio-based alternatives, improved performance characteristics, and enhanced safety profiles. Companies are developing specialty chemicals with reduced environmental impact, meeting the growing demand for environmentally friendly products. The application of nanotechnology and biotechnology is also shaping product development, leading to advanced materials with superior properties. These innovations are improving market fit by addressing specific customer needs and creating competitive advantages.
Report Scope & Segmentation Analysis
This report provides a comprehensive segmentation analysis of the Speciality Chemicals market, including Water Treatment Chemicals, Lubricant Additives, Adhesives and Sealants, Plastic Additives, Construction Chemicals, Electronic Chemicals, Dyes, Inks, and Pigments, Specialty Polymers, Oilfield Chemicals, Rubber Processing Chemicals, Textile Chemicals, Catalysts, Agrochemicals, Food Additives, Industrial and Institutional Cleaners, Mining Chemicals, Paints and Coatings, and Cosmetic Chemicals. Each segment's market size, growth projections, and competitive landscape are analyzed in detail. The report covers the historical period (2019-2024), base year (2025), and forecast period (2025-2033).
Key Drivers of Speciality Chemicals Market Growth
Several factors are driving the growth of the Speciality Chemicals market, including:
- Technological advancements: Innovation in materials science and biotechnology is leading to the development of novel specialty chemicals.
- Economic growth: Expanding economies globally are increasing demand across various end-use industries.
- Stringent environmental regulations: The growing need for sustainable solutions is driving the demand for eco-friendly specialty chemicals.
- Infrastructure development: Ongoing infrastructure projects worldwide are fueling demand for construction chemicals and other related specialty chemicals.
Challenges in the Speciality Chemicals Market Sector
The Speciality Chemicals market faces certain challenges including:
- Stringent regulatory requirements: Compliance with environmental and safety regulations can be costly and complex.
- Supply chain disruptions: Global supply chain vulnerabilities can impact raw material availability and production.
- Intense competition: The market is highly competitive, with both established players and new entrants vying for market share. Price pressure from competitors can impact profitability.
Emerging Opportunities in Speciality Chemicals Market
Several emerging opportunities exist within the Speciality Chemicals market:
- Bio-based and sustainable chemicals: Growing consumer preference for environmentally friendly products is creating significant opportunities.
- Nanotechnology and biotechnology applications: These advanced technologies are opening up new avenues for product innovation.
- Emerging markets: Developing economies present significant growth potential.
Leading Players in the Speciality Chemicals Market Market
- Ferro Corporation
- Infineum International Limited
- Henkel AG & Co KGaA
- DIC Corporation
- Corteva
- Clariant
- Ecolab
- GCP Applied Technologies Inc
- Holcim
- Nouryon
Key Developments in Speciality Chemicals Market Industry
- December 2022: Clariant AG announced plans to expand its care chemicals facility in China, strengthening its position in the country’s pharmaceutical, personal care, home care, and industrial applications markets.
- April 2022: Evonik invested in increasing its isobutene derivatives production capacity at its Marl location by 50%, boosting the production of Tertiary Butanol (TBA), Di-isobutene (DiB), and 3,5,5 Trimethylhexanal (TMH).
Future Outlook for Speciality Chemicals Market Market
The Speciality Chemicals market is poised for continued growth, driven by technological innovation, rising demand from various end-use industries, and the increasing adoption of sustainable solutions. Strategic partnerships, M&A activity, and expansion into new geographic markets will shape the future competitive landscape. The market will continue to see innovation focused on improving the performance, safety, and sustainability of specialty chemicals.
Speciality Chemicals Market Segmentation
-
1. Paints and Coatings
- 1.1. Dynamics
-
1.2. Application
- 1.2.1. Architectural
- 1.2.2. Automotive
- 1.2.3. Industrial
- 1.2.4. Wood
- 1.2.5. Other Applications
-
2. Catalysts
- 2.1. Dynamics
-
2.2. Function
- 2.2.1. Chemical Synthesis Catalysts
- 2.2.2. Petroleum Refining Catalysts
- 2.2.3. Polymerization Catalysts
-
3. Construction Chemicals
- 3.1. Dynamics
-
3.2. Application
- 3.2.1. Commercial
- 3.2.2. Industrial
- 3.2.3. Infrastructure
- 3.2.4. Residential
- 3.2.5. Public Space
-
4. Cosmetic Chemicals
- 4.1. Dynamics
-
4.2. Application
- 4.2.1. Hair Care
- 4.2.2. Skin Care
- 4.2.3. Oral Care
- 4.2.4. Personal Hygiene
- 4.2.5. Other Applications
-
5. Dyes, Inks, and Pigments
- 5.1. Dynamics
-
5.2. Type
- 5.2.1. Organic Pigments
- 5.2.2. Inorganic Pigments
-
6. Electronic Chemicals
- 6.1. Dynamics
-
6.2. Application
- 6.2.1. Semiconductors and Integrated Circuits
- 6.2.2. Printed Circuit Boards
-
7. Water Treatment Chemicals
- 7.1. Dynamics
-
7.2. Function
- 7.2.1. Flocculants
- 7.2.2. Coagulants
- 7.2.3. Biocides and Disinfectants
- 7.2.4. Defoamers and Defoaming Agents
- 7.2.5. pH Adjusters and Softeners
- 7.2.6. Other Functions
-
8. Food Additives
- 8.1. Dynamics
-
8.2. Type
- 8.2.1. Natural Additives
- 8.2.2. Synthetic Additives
-
9. Agrochemicals
- 9.1. Dynamics
-
9.2. Type
- 9.2.1. Fertilizers
- 9.2.2. Herbicide
- 9.2.3. Fungicide
- 9.2.4. Insecticide
- 9.2.5. Nematicide
- 9.2.6. Molluscicide
- 9.2.7. Other Crop Protection Chemicals
-
10. Industrial and Institutional Cleaners
- 10.1. Dynamics
-
10.2. Application
- 10.2.1. General Purpose Cleaners
- 10.2.2. Disinfectants and Sanitizers
- 10.2.3. Laundry Care Products
- 10.2.4. Vehicle Wash Products
-
11. Lubricant Additives
- 11.1. Dynamics
-
11.2. Product Type
- 11.2.1. Dispersants and Emulsifiers
- 11.2.2. Detergents
- 11.2.3. Oxidation Inhibitors
- 11.2.4. Extreme-pressure Additives and Anti-wear Additives
- 11.2.5. Viscosity Index Modifiers
- 11.2.6. Friction Modifiers
- 11.2.7. Corrosion Inhibitors
- 11.2.8. Other Product Types
-
12. Mining Chemicals
- 12.1. Dynamics
-
12.2. Function
- 12.2.1. Flotation Chemicals
- 12.2.2. Extraction Chemicals
- 12.2.3. Grinding Aids
-
13. Oilfield Chemicals
- 13.1. Dynamics
-
13.2. Application
- 13.2.1. Biocide
- 13.2.2. Corrosion and Scale Inhibitor
- 13.2.3. Demulsifier
- 13.2.4. Polymer
- 13.2.5. Surfactant
- 13.2.6. Other Chemical Types
-
14. Adhesives and Sealants
- 14.1. Dynamics
-
14.2. Technology
- 14.2.1. Water-borne Adhesives
- 14.2.2. Solvent-borne Adhesives
- 14.2.3. Hot-melt Adhesives
- 14.2.4. Reactive Adhesives
- 14.2.5. Other Adhesives
-
15. Plastic Additives
- 15.1. Dynamics
-
15.2. Plastic Type
- 15.2.1. Polyethylene (PE)
- 15.2.2. Polystyrene (PS)
- 15.2.3. Polypropylene (PP)
- 15.2.4. Polyamide (PA)
- 15.2.5. Polyethylene Terephthalate (PET)
- 15.2.6. Polyvinyl Chloride (PVC)
- 15.2.7. Polycarbonate (PC)
- 15.2.8. Other Plastic Types
-
16. Rubber Processing Chemicals
- 16.1. Dynamics
-
16.2. Application
- 16.2.1. Tire
- 16.2.2. Non-tire
-
17. Specialty Polymers
- 17.1. Dynamics
-
18. Textile Chemicals
- 18.1. Dynamics
-
18.2. Application
- 18.2.1. Coating and Sizing Chemicals
- 18.2.2. Colorants and Auxiliaries
- 18.2.3. Finishing Agents
- 18.2.4. Desizing Agents
- 18.2.5. Other Application
Speciality Chemicals Market Segmentation By Geography
-
1. Asia Pacific
- 1.1. China
- 1.2. India
- 1.3. Japan
- 1.4. South Korea
- 1.5. ASEAN Countries
- 1.6. Rest of Asia Pacific
-
2. North America
- 2.1. United States
- 2.2. Canada
- 2.3. Mexico
- 2.4. Rest of North America
-
3. Europe
- 3.1. Germany
- 3.2. United Kingdom
- 3.3. Italy
- 3.4. France
- 3.5. Spain
- 3.6. Rest of Europe
-
4. South America
- 4.1. Brazil
- 4.2. Argentina
- 4.3. Rest of South America
-
5. Middle East and Africa
- 5.1. Saudi Arabia
- 5.2. South Africa
- 5.3. Rest of Middle East and Africa

Speciality Chemicals Market REPORT HIGHLIGHTS
| Aspects | Details |
|---|---|
| Study Period | 2019-2033 |
| Base Year | 2024 |
| Estimated Year | 2025 |
| Forecast Period | 2025-2033 |
| Historical Period | 2019-2024 |
| Growth Rate | CAGR of 3.31% from 2019-2033 |
| Segmentation |
|
Table of Contents
- 1. Introduction
- 1.1. Research Scope
- 1.2. Market Segmentation
- 1.3. Research Methodology
- 1.4. Definitions and Assumptions
- 2. Executive Summary
- 2.1. Introduction
- 3. Market Dynamics
- 3.1. Introduction
- 3.2. Market Drivers
- 3.2.1 Robust Growth of Construction Activities in Asia-Pacific
- 3.2.2 and Middle East and Africa; Growing Population is Propelling the Demand for Food Worldwide
- 3.3. Market Restrains
- 3.3.1. Low Resistance to Extreme Weather Conditions; Rising Global Regulations on its Usage
- 3.4. Market Trends
- 3.4.1. Agrochemicals Segment to Dominate the Market Demand
- 4. Market Factor Analysis
- 4.1. Porters Five Forces
- 4.2. Supply/Value Chain
- 4.3. PESTEL analysis
- 4.4. Market Entropy
- 4.5. Patent/Trademark Analysis
- 5. Global Speciality Chemicals Market Analysis, Insights and Forecast, 2019-2031
- 5.1. Market Analysis, Insights and Forecast - by Paints and Coatings
- 5.1.1. Dynamics
- 5.1.2. Application
- 5.1.2.1. Architectural
- 5.1.2.2. Automotive
- 5.1.2.3. Industrial
- 5.1.2.4. Wood
- 5.1.2.5. Other Applications
- 5.2. Market Analysis, Insights and Forecast - by Catalysts
- 5.2.1. Dynamics
- 5.2.2. Function
- 5.2.2.1. Chemical Synthesis Catalysts
- 5.2.2.2. Petroleum Refining Catalysts
- 5.2.2.3. Polymerization Catalysts
- 5.3. Market Analysis, Insights and Forecast - by Construction Chemicals
- 5.3.1. Dynamics
- 5.3.2. Application
- 5.3.2.1. Commercial
- 5.3.2.2. Industrial
- 5.3.2.3. Infrastructure
- 5.3.2.4. Residential
- 5.3.2.5. Public Space
- 5.4. Market Analysis, Insights and Forecast - by Cosmetic Chemicals
- 5.4.1. Dynamics
- 5.4.2. Application
- 5.4.2.1. Hair Care
- 5.4.2.2. Skin Care
- 5.4.2.3. Oral Care
- 5.4.2.4. Personal Hygiene
- 5.4.2.5. Other Applications
- 5.5. Market Analysis, Insights and Forecast - by Dyes, Inks, and Pigments
- 5.5.1. Dynamics
- 5.5.2. Type
- 5.5.2.1. Organic Pigments
- 5.5.2.2. Inorganic Pigments
- 5.6. Market Analysis, Insights and Forecast - by Electronic Chemicals
- 5.6.1. Dynamics
- 5.6.2. Application
- 5.6.2.1. Semiconductors and Integrated Circuits
- 5.6.2.2. Printed Circuit Boards
- 5.7. Market Analysis, Insights and Forecast - by Water Treatment Chemicals
- 5.7.1. Dynamics
- 5.7.2. Function
- 5.7.2.1. Flocculants
- 5.7.2.2. Coagulants
- 5.7.2.3. Biocides and Disinfectants
- 5.7.2.4. Defoamers and Defoaming Agents
- 5.7.2.5. pH Adjusters and Softeners
- 5.7.2.6. Other Functions
- 5.8. Market Analysis, Insights and Forecast - by Food Additives
- 5.8.1. Dynamics
- 5.8.2. Type
- 5.8.2.1. Natural Additives
- 5.8.2.2. Synthetic Additives
- 5.9. Market Analysis, Insights and Forecast - by Agrochemicals
- 5.9.1. Dynamics
- 5.9.2. Type
- 5.9.2.1. Fertilizers
- 5.9.2.2. Herbicide
- 5.9.2.3. Fungicide
- 5.9.2.4. Insecticide
- 5.9.2.5. Nematicide
- 5.9.2.6. Molluscicide
- 5.9.2.7. Other Crop Protection Chemicals
- 5.10. Market Analysis, Insights and Forecast - by Industrial and Institutional Cleaners
- 5.10.1. Dynamics
- 5.10.2. Application
- 5.10.2.1. General Purpose Cleaners
- 5.10.2.2. Disinfectants and Sanitizers
- 5.10.2.3. Laundry Care Products
- 5.10.2.4. Vehicle Wash Products
- 5.11. Market Analysis, Insights and Forecast - by Lubricant Additives
- 5.11.1. Dynamics
- 5.11.2. Product Type
- 5.11.2.1. Dispersants and Emulsifiers
- 5.11.2.2. Detergents
- 5.11.2.3. Oxidation Inhibitors
- 5.11.2.4. Extreme-pressure Additives and Anti-wear Additives
- 5.11.2.5. Viscosity Index Modifiers
- 5.11.2.6. Friction Modifiers
- 5.11.2.7. Corrosion Inhibitors
- 5.11.2.8. Other Product Types
- 5.12. Market Analysis, Insights and Forecast - by Mining Chemicals
- 5.12.1. Dynamics
- 5.12.2. Function
- 5.12.2.1. Flotation Chemicals
- 5.12.2.2. Extraction Chemicals
- 5.12.2.3. Grinding Aids
- 5.13. Market Analysis, Insights and Forecast - by Oilfield Chemicals
- 5.13.1. Dynamics
- 5.13.2. Application
- 5.13.2.1. Biocide
- 5.13.2.2. Corrosion and Scale Inhibitor
- 5.13.2.3. Demulsifier
- 5.13.2.4. Polymer
- 5.13.2.5. Surfactant
- 5.13.2.6. Other Chemical Types
- 5.14. Market Analysis, Insights and Forecast - by Adhesives and Sealants
- 5.14.1. Dynamics
- 5.14.2. Technology
- 5.14.2.1. Water-borne Adhesives
- 5.14.2.2. Solvent-borne Adhesives
- 5.14.2.3. Hot-melt Adhesives
- 5.14.2.4. Reactive Adhesives
- 5.14.2.5. Other Adhesives
- 5.15. Market Analysis, Insights and Forecast - by Plastic Additives
- 5.15.1. Dynamics
- 5.15.2. Plastic Type
- 5.15.2.1. Polyethylene (PE)
- 5.15.2.2. Polystyrene (PS)
- 5.15.2.3. Polypropylene (PP)
- 5.15.2.4. Polyamide (PA)
- 5.15.2.5. Polyethylene Terephthalate (PET)
- 5.15.2.6. Polyvinyl Chloride (PVC)
- 5.15.2.7. Polycarbonate (PC)
- 5.15.2.8. Other Plastic Types
- 5.16. Market Analysis, Insights and Forecast - by Rubber Processing Chemicals
- 5.16.1. Dynamics
- 5.16.2. Application
- 5.16.2.1. Tire
- 5.16.2.2. Non-tire
- 5.17. Market Analysis, Insights and Forecast - by Specialty Polymers
- 5.17.1. Dynamics
- 5.18. Market Analysis, Insights and Forecast - by Textile Chemicals
- 5.18.1. Dynamics
- 5.18.2. Application
- 5.18.2.1. Coating and Sizing Chemicals
- 5.18.2.2. Colorants and Auxiliaries
- 5.18.2.3. Finishing Agents
- 5.18.2.4. Desizing Agents
- 5.18.2.5. Other Application
- 5.19. Market Analysis, Insights and Forecast - by Region
- 5.19.1. Asia Pacific
- 5.19.2. North America
- 5.19.3. Europe
- 5.19.4. South America
- 5.19.5. Middle East and Africa
- 5.1. Market Analysis, Insights and Forecast - by Paints and Coatings
- 6. Asia Pacific Speciality Chemicals Market Analysis, Insights and Forecast, 2019-2031
- 6.1. Market Analysis, Insights and Forecast - by Paints and Coatings
- 6.1.1. Dynamics
- 6.1.2. Application
- 6.1.2.1. Architectural
- 6.1.2.2. Automotive
- 6.1.2.3. Industrial
- 6.1.2.4. Wood
- 6.1.2.5. Other Applications
- 6.2. Market Analysis, Insights and Forecast - by Catalysts
- 6.2.1. Dynamics
- 6.2.2. Function
- 6.2.2.1. Chemical Synthesis Catalysts
- 6.2.2.2. Petroleum Refining Catalysts
- 6.2.2.3. Polymerization Catalysts
- 6.3. Market Analysis, Insights and Forecast - by Construction Chemicals
- 6.3.1. Dynamics
- 6.3.2. Application
- 6.3.2.1. Commercial
- 6.3.2.2. Industrial
- 6.3.2.3. Infrastructure
- 6.3.2.4. Residential
- 6.3.2.5. Public Space
- 6.4. Market Analysis, Insights and Forecast - by Cosmetic Chemicals
- 6.4.1. Dynamics
- 6.4.2. Application
- 6.4.2.1. Hair Care
- 6.4.2.2. Skin Care
- 6.4.2.3. Oral Care
- 6.4.2.4. Personal Hygiene
- 6.4.2.5. Other Applications
- 6.5. Market Analysis, Insights and Forecast - by Dyes, Inks, and Pigments
- 6.5.1. Dynamics
- 6.5.2. Type
- 6.5.2.1. Organic Pigments
- 6.5.2.2. Inorganic Pigments
- 6.6. Market Analysis, Insights and Forecast - by Electronic Chemicals
- 6.6.1. Dynamics
- 6.6.2. Application
- 6.6.2.1. Semiconductors and Integrated Circuits
- 6.6.2.2. Printed Circuit Boards
- 6.7. Market Analysis, Insights and Forecast - by Water Treatment Chemicals
- 6.7.1. Dynamics
- 6.7.2. Function
- 6.7.2.1. Flocculants
- 6.7.2.2. Coagulants
- 6.7.2.3. Biocides and Disinfectants
- 6.7.2.4. Defoamers and Defoaming Agents
- 6.7.2.5. pH Adjusters and Softeners
- 6.7.2.6. Other Functions
- 6.8. Market Analysis, Insights and Forecast - by Food Additives
- 6.8.1. Dynamics
- 6.8.2. Type
- 6.8.2.1. Natural Additives
- 6.8.2.2. Synthetic Additives
- 6.9. Market Analysis, Insights and Forecast - by Agrochemicals
- 6.9.1. Dynamics
- 6.9.2. Type
- 6.9.2.1. Fertilizers
- 6.9.2.2. Herbicide
- 6.9.2.3. Fungicide
- 6.9.2.4. Insecticide
- 6.9.2.5. Nematicide
- 6.9.2.6. Molluscicide
- 6.9.2.7. Other Crop Protection Chemicals
- 6.10. Market Analysis, Insights and Forecast - by Industrial and Institutional Cleaners
- 6.10.1. Dynamics
- 6.10.2. Application
- 6.10.2.1. General Purpose Cleaners
- 6.10.2.2. Disinfectants and Sanitizers
- 6.10.2.3. Laundry Care Products
- 6.10.2.4. Vehicle Wash Products
- 6.11. Market Analysis, Insights and Forecast - by Lubricant Additives
- 6.11.1. Dynamics
- 6.11.2. Product Type
- 6.11.2.1. Dispersants and Emulsifiers
- 6.11.2.2. Detergents
- 6.11.2.3. Oxidation Inhibitors
- 6.11.2.4. Extreme-pressure Additives and Anti-wear Additives
- 6.11.2.5. Viscosity Index Modifiers
- 6.11.2.6. Friction Modifiers
- 6.11.2.7. Corrosion Inhibitors
- 6.11.2.8. Other Product Types
- 6.12. Market Analysis, Insights and Forecast - by Mining Chemicals
- 6.12.1. Dynamics
- 6.12.2. Function
- 6.12.2.1. Flotation Chemicals
- 6.12.2.2. Extraction Chemicals
- 6.12.2.3. Grinding Aids
- 6.13. Market Analysis, Insights and Forecast - by Oilfield Chemicals
- 6.13.1. Dynamics
- 6.13.2. Application
- 6.13.2.1. Biocide
- 6.13.2.2. Corrosion and Scale Inhibitor
- 6.13.2.3. Demulsifier
- 6.13.2.4. Polymer
- 6.13.2.5. Surfactant
- 6.13.2.6. Other Chemical Types
- 6.14. Market Analysis, Insights and Forecast - by Adhesives and Sealants
- 6.14.1. Dynamics
- 6.14.2. Technology
- 6.14.2.1. Water-borne Adhesives
- 6.14.2.2. Solvent-borne Adhesives
- 6.14.2.3. Hot-melt Adhesives
- 6.14.2.4. Reactive Adhesives
- 6.14.2.5. Other Adhesives
- 6.15. Market Analysis, Insights and Forecast - by Plastic Additives
- 6.15.1. Dynamics
- 6.15.2. Plastic Type
- 6.15.2.1. Polyethylene (PE)
- 6.15.2.2. Polystyrene (PS)
- 6.15.2.3. Polypropylene (PP)
- 6.15.2.4. Polyamide (PA)
- 6.15.2.5. Polyethylene Terephthalate (PET)
- 6.15.2.6. Polyvinyl Chloride (PVC)
- 6.15.2.7. Polycarbonate (PC)
- 6.15.2.8. Other Plastic Types
- 6.16. Market Analysis, Insights and Forecast - by Rubber Processing Chemicals
- 6.16.1. Dynamics
- 6.16.2. Application
- 6.16.2.1. Tire
- 6.16.2.2. Non-tire
- 6.17. Market Analysis, Insights and Forecast - by Specialty Polymers
- 6.17.1. Dynamics
- 6.18. Market Analysis, Insights and Forecast - by Textile Chemicals
- 6.18.1. Dynamics
- 6.18.2. Application
- 6.18.2.1. Coating and Sizing Chemicals
- 6.18.2.2. Colorants and Auxiliaries
- 6.18.2.3. Finishing Agents
- 6.18.2.4. Desizing Agents
- 6.18.2.5. Other Application
- 6.1. Market Analysis, Insights and Forecast - by Paints and Coatings
- 7. North America Speciality Chemicals Market Analysis, Insights and Forecast, 2019-2031
- 7.1. Market Analysis, Insights and Forecast - by Paints and Coatings
- 7.1.1. Dynamics
- 7.1.2. Application
- 7.1.2.1. Architectural
- 7.1.2.2. Automotive
- 7.1.2.3. Industrial
- 7.1.2.4. Wood
- 7.1.2.5. Other Applications
- 7.2. Market Analysis, Insights and Forecast - by Catalysts
- 7.2.1. Dynamics
- 7.2.2. Function
- 7.2.2.1. Chemical Synthesis Catalysts
- 7.2.2.2. Petroleum Refining Catalysts
- 7.2.2.3. Polymerization Catalysts
- 7.3. Market Analysis, Insights and Forecast - by Construction Chemicals
- 7.3.1. Dynamics
- 7.3.2. Application
- 7.3.2.1. Commercial
- 7.3.2.2. Industrial
- 7.3.2.3. Infrastructure
- 7.3.2.4. Residential
- 7.3.2.5. Public Space
- 7.4. Market Analysis, Insights and Forecast - by Cosmetic Chemicals
- 7.4.1. Dynamics
- 7.4.2. Application
- 7.4.2.1. Hair Care
- 7.4.2.2. Skin Care
- 7.4.2.3. Oral Care
- 7.4.2.4. Personal Hygiene
- 7.4.2.5. Other Applications
- 7.5. Market Analysis, Insights and Forecast - by Dyes, Inks, and Pigments
- 7.5.1. Dynamics
- 7.5.2. Type
- 7.5.2.1. Organic Pigments
- 7.5.2.2. Inorganic Pigments
- 7.6. Market Analysis, Insights and Forecast - by Electronic Chemicals
- 7.6.1. Dynamics
- 7.6.2. Application
- 7.6.2.1. Semiconductors and Integrated Circuits
- 7.6.2.2. Printed Circuit Boards
- 7.7. Market Analysis, Insights and Forecast - by Water Treatment Chemicals
- 7.7.1. Dynamics
- 7.7.2. Function
- 7.7.2.1. Flocculants
- 7.7.2.2. Coagulants
- 7.7.2.3. Biocides and Disinfectants
- 7.7.2.4. Defoamers and Defoaming Agents
- 7.7.2.5. pH Adjusters and Softeners
- 7.7.2.6. Other Functions
- 7.8. Market Analysis, Insights and Forecast - by Food Additives
- 7.8.1. Dynamics
- 7.8.2. Type
- 7.8.2.1. Natural Additives
- 7.8.2.2. Synthetic Additives
- 7.9. Market Analysis, Insights and Forecast - by Agrochemicals
- 7.9.1. Dynamics
- 7.9.2. Type
- 7.9.2.1. Fertilizers
- 7.9.2.2. Herbicide
- 7.9.2.3. Fungicide
- 7.9.2.4. Insecticide
- 7.9.2.5. Nematicide
- 7.9.2.6. Molluscicide
- 7.9.2.7. Other Crop Protection Chemicals
- 7.10. Market Analysis, Insights and Forecast - by Industrial and Institutional Cleaners
- 7.10.1. Dynamics
- 7.10.2. Application
- 7.10.2.1. General Purpose Cleaners
- 7.10.2.2. Disinfectants and Sanitizers
- 7.10.2.3. Laundry Care Products
- 7.10.2.4. Vehicle Wash Products
- 7.11. Market Analysis, Insights and Forecast - by Lubricant Additives
- 7.11.1. Dynamics
- 7.11.2. Product Type
- 7.11.2.1. Dispersants and Emulsifiers
- 7.11.2.2. Detergents
- 7.11.2.3. Oxidation Inhibitors
- 7.11.2.4. Extreme-pressure Additives and Anti-wear Additives
- 7.11.2.5. Viscosity Index Modifiers
- 7.11.2.6. Friction Modifiers
- 7.11.2.7. Corrosion Inhibitors
- 7.11.2.8. Other Product Types
- 7.12. Market Analysis, Insights and Forecast - by Mining Chemicals
- 7.12.1. Dynamics
- 7.12.2. Function
- 7.12.2.1. Flotation Chemicals
- 7.12.2.2. Extraction Chemicals
- 7.12.2.3. Grinding Aids
- 7.13. Market Analysis, Insights and Forecast - by Oilfield Chemicals
- 7.13.1. Dynamics
- 7.13.2. Application
- 7.13.2.1. Biocide
- 7.13.2.2. Corrosion and Scale Inhibitor
- 7.13.2.3. Demulsifier
- 7.13.2.4. Polymer
- 7.13.2.5. Surfactant
- 7.13.2.6. Other Chemical Types
- 7.14. Market Analysis, Insights and Forecast - by Adhesives and Sealants
- 7.14.1. Dynamics
- 7.14.2. Technology
- 7.14.2.1. Water-borne Adhesives
- 7.14.2.2. Solvent-borne Adhesives
- 7.14.2.3. Hot-melt Adhesives
- 7.14.2.4. Reactive Adhesives
- 7.14.2.5. Other Adhesives
- 7.15. Market Analysis, Insights and Forecast - by Plastic Additives
- 7.15.1. Dynamics
- 7.15.2. Plastic Type
- 7.15.2.1. Polyethylene (PE)
- 7.15.2.2. Polystyrene (PS)
- 7.15.2.3. Polypropylene (PP)
- 7.15.2.4. Polyamide (PA)
- 7.15.2.5. Polyethylene Terephthalate (PET)
- 7.15.2.6. Polyvinyl Chloride (PVC)
- 7.15.2.7. Polycarbonate (PC)
- 7.15.2.8. Other Plastic Types
- 7.16. Market Analysis, Insights and Forecast - by Rubber Processing Chemicals
- 7.16.1. Dynamics
- 7.16.2. Application
- 7.16.2.1. Tire
- 7.16.2.2. Non-tire
- 7.17. Market Analysis, Insights and Forecast - by Specialty Polymers
- 7.17.1. Dynamics
- 7.18. Market Analysis, Insights and Forecast - by Textile Chemicals
- 7.18.1. Dynamics
- 7.18.2. Application
- 7.18.2.1. Coating and Sizing Chemicals
- 7.18.2.2. Colorants and Auxiliaries
- 7.18.2.3. Finishing Agents
- 7.18.2.4. Desizing Agents
- 7.18.2.5. Other Application
- 7.1. Market Analysis, Insights and Forecast - by Paints and Coatings
- 8. Europe Speciality Chemicals Market Analysis, Insights and Forecast, 2019-2031
- 8.1. Market Analysis, Insights and Forecast - by Paints and Coatings
- 8.1.1. Dynamics
- 8.1.2. Application
- 8.1.2.1. Architectural
- 8.1.2.2. Automotive
- 8.1.2.3. Industrial
- 8.1.2.4. Wood
- 8.1.2.5. Other Applications
- 8.2. Market Analysis, Insights and Forecast - by Catalysts
- 8.2.1. Dynamics
- 8.2.2. Function
- 8.2.2.1. Chemical Synthesis Catalysts
- 8.2.2.2. Petroleum Refining Catalysts
- 8.2.2.3. Polymerization Catalysts
- 8.3. Market Analysis, Insights and Forecast - by Construction Chemicals
- 8.3.1. Dynamics
- 8.3.2. Application
- 8.3.2.1. Commercial
- 8.3.2.2. Industrial
- 8.3.2.3. Infrastructure
- 8.3.2.4. Residential
- 8.3.2.5. Public Space
- 8.4. Market Analysis, Insights and Forecast - by Cosmetic Chemicals
- 8.4.1. Dynamics
- 8.4.2. Application
- 8.4.2.1. Hair Care
- 8.4.2.2. Skin Care
- 8.4.2.3. Oral Care
- 8.4.2.4. Personal Hygiene
- 8.4.2.5. Other Applications
- 8.5. Market Analysis, Insights and Forecast - by Dyes, Inks, and Pigments
- 8.5.1. Dynamics
- 8.5.2. Type
- 8.5.2.1. Organic Pigments
- 8.5.2.2. Inorganic Pigments
- 8.6. Market Analysis, Insights and Forecast - by Electronic Chemicals
- 8.6.1. Dynamics
- 8.6.2. Application
- 8.6.2.1. Semiconductors and Integrated Circuits
- 8.6.2.2. Printed Circuit Boards
- 8.7. Market Analysis, Insights and Forecast - by Water Treatment Chemicals
- 8.7.1. Dynamics
- 8.7.2. Function
- 8.7.2.1. Flocculants
- 8.7.2.2. Coagulants
- 8.7.2.3. Biocides and Disinfectants
- 8.7.2.4. Defoamers and Defoaming Agents
- 8.7.2.5. pH Adjusters and Softeners
- 8.7.2.6. Other Functions
- 8.8. Market Analysis, Insights and Forecast - by Food Additives
- 8.8.1. Dynamics
- 8.8.2. Type
- 8.8.2.1. Natural Additives
- 8.8.2.2. Synthetic Additives
- 8.9. Market Analysis, Insights and Forecast - by Agrochemicals
- 8.9.1. Dynamics
- 8.9.2. Type
- 8.9.2.1. Fertilizers
- 8.9.2.2. Herbicide
- 8.9.2.3. Fungicide
- 8.9.2.4. Insecticide
- 8.9.2.5. Nematicide
- 8.9.2.6. Molluscicide
- 8.9.2.7. Other Crop Protection Chemicals
- 8.10. Market Analysis, Insights and Forecast - by Industrial and Institutional Cleaners
- 8.10.1. Dynamics
- 8.10.2. Application
- 8.10.2.1. General Purpose Cleaners
- 8.10.2.2. Disinfectants and Sanitizers
- 8.10.2.3. Laundry Care Products
- 8.10.2.4. Vehicle Wash Products
- 8.11. Market Analysis, Insights and Forecast - by Lubricant Additives
- 8.11.1. Dynamics
- 8.11.2. Product Type
- 8.11.2.1. Dispersants and Emulsifiers
- 8.11.2.2. Detergents
- 8.11.2.3. Oxidation Inhibitors
- 8.11.2.4. Extreme-pressure Additives and Anti-wear Additives
- 8.11.2.5. Viscosity Index Modifiers
- 8.11.2.6. Friction Modifiers
- 8.11.2.7. Corrosion Inhibitors
- 8.11.2.8. Other Product Types
- 8.12. Market Analysis, Insights and Forecast - by Mining Chemicals
- 8.12.1. Dynamics
- 8.12.2. Function
- 8.12.2.1. Flotation Chemicals
- 8.12.2.2. Extraction Chemicals
- 8.12.2.3. Grinding Aids
- 8.13. Market Analysis, Insights and Forecast - by Oilfield Chemicals
- 8.13.1. Dynamics
- 8.13.2. Application
- 8.13.2.1. Biocide
- 8.13.2.2. Corrosion and Scale Inhibitor
- 8.13.2.3. Demulsifier
- 8.13.2.4. Polymer
- 8.13.2.5. Surfactant
- 8.13.2.6. Other Chemical Types
- 8.14. Market Analysis, Insights and Forecast - by Adhesives and Sealants
- 8.14.1. Dynamics
- 8.14.2. Technology
- 8.14.2.1. Water-borne Adhesives
- 8.14.2.2. Solvent-borne Adhesives
- 8.14.2.3. Hot-melt Adhesives
- 8.14.2.4. Reactive Adhesives
- 8.14.2.5. Other Adhesives
- 8.15. Market Analysis, Insights and Forecast - by Plastic Additives
- 8.15.1. Dynamics
- 8.15.2. Plastic Type
- 8.15.2.1. Polyethylene (PE)
- 8.15.2.2. Polystyrene (PS)
- 8.15.2.3. Polypropylene (PP)
- 8.15.2.4. Polyamide (PA)
- 8.15.2.5. Polyethylene Terephthalate (PET)
- 8.15.2.6. Polyvinyl Chloride (PVC)
- 8.15.2.7. Polycarbonate (PC)
- 8.15.2.8. Other Plastic Types
- 8.16. Market Analysis, Insights and Forecast - by Rubber Processing Chemicals
- 8.16.1. Dynamics
- 8.16.2. Application
- 8.16.2.1. Tire
- 8.16.2.2. Non-tire
- 8.17. Market Analysis, Insights and Forecast - by Specialty Polymers
- 8.17.1. Dynamics
- 8.18. Market Analysis, Insights and Forecast - by Textile Chemicals
- 8.18.1. Dynamics
- 8.18.2. Application
- 8.18.2.1. Coating and Sizing Chemicals
- 8.18.2.2. Colorants and Auxiliaries
- 8.18.2.3. Finishing Agents
- 8.18.2.4. Desizing Agents
- 8.18.2.5. Other Application
- 8.1. Market Analysis, Insights and Forecast - by Paints and Coatings
- 9. South America Speciality Chemicals Market Analysis, Insights and Forecast, 2019-2031
- 9.1. Market Analysis, Insights and Forecast - by Paints and Coatings
- 9.1.1. Dynamics
- 9.1.2. Application
- 9.1.2.1. Architectural
- 9.1.2.2. Automotive
- 9.1.2.3. Industrial
- 9.1.2.4. Wood
- 9.1.2.5. Other Applications
- 9.2. Market Analysis, Insights and Forecast - by Catalysts
- 9.2.1. Dynamics
- 9.2.2. Function
- 9.2.2.1. Chemical Synthesis Catalysts
- 9.2.2.2. Petroleum Refining Catalysts
- 9.2.2.3. Polymerization Catalysts
- 9.3. Market Analysis, Insights and Forecast - by Construction Chemicals
- 9.3.1. Dynamics
- 9.3.2. Application
- 9.3.2.1. Commercial
- 9.3.2.2. Industrial
- 9.3.2.3. Infrastructure
- 9.3.2.4. Residential
- 9.3.2.5. Public Space
- 9.4. Market Analysis, Insights and Forecast - by Cosmetic Chemicals
- 9.4.1. Dynamics
- 9.4.2. Application
- 9.4.2.1. Hair Care
- 9.4.2.2. Skin Care
- 9.4.2.3. Oral Care
- 9.4.2.4. Personal Hygiene
- 9.4.2.5. Other Applications
- 9.5. Market Analysis, Insights and Forecast - by Dyes, Inks, and Pigments
- 9.5.1. Dynamics
- 9.5.2. Type
- 9.5.2.1. Organic Pigments
- 9.5.2.2. Inorganic Pigments
- 9.6. Market Analysis, Insights and Forecast - by Electronic Chemicals
- 9.6.1. Dynamics
- 9.6.2. Application
- 9.6.2.1. Semiconductors and Integrated Circuits
- 9.6.2.2. Printed Circuit Boards
- 9.7. Market Analysis, Insights and Forecast - by Water Treatment Chemicals
- 9.7.1. Dynamics
- 9.7.2. Function
- 9.7.2.1. Flocculants
- 9.7.2.2. Coagulants
- 9.7.2.3. Biocides and Disinfectants
- 9.7.2.4. Defoamers and Defoaming Agents
- 9.7.2.5. pH Adjusters and Softeners
- 9.7.2.6. Other Functions
- 9.8. Market Analysis, Insights and Forecast - by Food Additives
- 9.8.1. Dynamics
- 9.8.2. Type
- 9.8.2.1. Natural Additives
- 9.8.2.2. Synthetic Additives
- 9.9. Market Analysis, Insights and Forecast - by Agrochemicals
- 9.9.1. Dynamics
- 9.9.2. Type
- 9.9.2.1. Fertilizers
- 9.9.2.2. Herbicide
- 9.9.2.3. Fungicide
- 9.9.2.4. Insecticide
- 9.9.2.5. Nematicide
- 9.9.2.6. Molluscicide
- 9.9.2.7. Other Crop Protection Chemicals
- 9.10. Market Analysis, Insights and Forecast - by Industrial and Institutional Cleaners
- 9.10.1. Dynamics
- 9.10.2. Application
- 9.10.2.1. General Purpose Cleaners
- 9.10.2.2. Disinfectants and Sanitizers
- 9.10.2.3. Laundry Care Products
- 9.10.2.4. Vehicle Wash Products
- 9.11. Market Analysis, Insights and Forecast - by Lubricant Additives
- 9.11.1. Dynamics
- 9.11.2. Product Type
- 9.11.2.1. Dispersants and Emulsifiers
- 9.11.2.2. Detergents
- 9.11.2.3. Oxidation Inhibitors
- 9.11.2.4. Extreme-pressure Additives and Anti-wear Additives
- 9.11.2.5. Viscosity Index Modifiers
- 9.11.2.6. Friction Modifiers
- 9.11.2.7. Corrosion Inhibitors
- 9.11.2.8. Other Product Types
- 9.12. Market Analysis, Insights and Forecast - by Mining Chemicals
- 9.12.1. Dynamics
- 9.12.2. Function
- 9.12.2.1. Flotation Chemicals
- 9.12.2.2. Extraction Chemicals
- 9.12.2.3. Grinding Aids
- 9.13. Market Analysis, Insights and Forecast - by Oilfield Chemicals
- 9.13.1. Dynamics
- 9.13.2. Application
- 9.13.2.1. Biocide
- 9.13.2.2. Corrosion and Scale Inhibitor
- 9.13.2.3. Demulsifier
- 9.13.2.4. Polymer
- 9.13.2.5. Surfactant
- 9.13.2.6. Other Chemical Types
- 9.14. Market Analysis, Insights and Forecast - by Adhesives and Sealants
- 9.14.1. Dynamics
- 9.14.2. Technology
- 9.14.2.1. Water-borne Adhesives
- 9.14.2.2. Solvent-borne Adhesives
- 9.14.2.3. Hot-melt Adhesives
- 9.14.2.4. Reactive Adhesives
- 9.14.2.5. Other Adhesives
- 9.15. Market Analysis, Insights and Forecast - by Plastic Additives
- 9.15.1. Dynamics
- 9.15.2. Plastic Type
- 9.15.2.1. Polyethylene (PE)
- 9.15.2.2. Polystyrene (PS)
- 9.15.2.3. Polypropylene (PP)
- 9.15.2.4. Polyamide (PA)
- 9.15.2.5. Polyethylene Terephthalate (PET)
- 9.15.2.6. Polyvinyl Chloride (PVC)
- 9.15.2.7. Polycarbonate (PC)
- 9.15.2.8. Other Plastic Types
- 9.16. Market Analysis, Insights and Forecast - by Rubber Processing Chemicals
- 9.16.1. Dynamics
- 9.16.2. Application
- 9.16.2.1. Tire
- 9.16.2.2. Non-tire
- 9.17. Market Analysis, Insights and Forecast - by Specialty Polymers
- 9.17.1. Dynamics
- 9.18. Market Analysis, Insights and Forecast - by Textile Chemicals
- 9.18.1. Dynamics
- 9.18.2. Application
- 9.18.2.1. Coating and Sizing Chemicals
- 9.18.2.2. Colorants and Auxiliaries
- 9.18.2.3. Finishing Agents
- 9.18.2.4. Desizing Agents
- 9.18.2.5. Other Application
- 9.1. Market Analysis, Insights and Forecast - by Paints and Coatings
- 10. Middle East and Africa Speciality Chemicals Market Analysis, Insights and Forecast, 2019-2031
- 10.1. Market Analysis, Insights and Forecast - by Paints and Coatings
- 10.1.1. Dynamics
- 10.1.2. Application
- 10.1.2.1. Architectural
- 10.1.2.2. Automotive
- 10.1.2.3. Industrial
- 10.1.2.4. Wood
- 10.1.2.5. Other Applications
- 10.2. Market Analysis, Insights and Forecast - by Catalysts
- 10.2.1. Dynamics
- 10.2.2. Function
- 10.2.2.1. Chemical Synthesis Catalysts
- 10.2.2.2. Petroleum Refining Catalysts
- 10.2.2.3. Polymerization Catalysts
- 10.3. Market Analysis, Insights and Forecast - by Construction Chemicals
- 10.3.1. Dynamics
- 10.3.2. Application
- 10.3.2.1. Commercial
- 10.3.2.2. Industrial
- 10.3.2.3. Infrastructure
- 10.3.2.4. Residential
- 10.3.2.5. Public Space
- 10.4. Market Analysis, Insights and Forecast - by Cosmetic Chemicals
- 10.4.1. Dynamics
- 10.4.2. Application
- 10.4.2.1. Hair Care
- 10.4.2.2. Skin Care
- 10.4.2.3. Oral Care
- 10.4.2.4. Personal Hygiene
- 10.4.2.5. Other Applications
- 10.5. Market Analysis, Insights and Forecast - by Dyes, Inks, and Pigments
- 10.5.1. Dynamics
- 10.5.2. Type
- 10.5.2.1. Organic Pigments
- 10.5.2.2. Inorganic Pigments
- 10.6. Market Analysis, Insights and Forecast - by Electronic Chemicals
- 10.6.1. Dynamics
- 10.6.2. Application
- 10.6.2.1. Semiconductors and Integrated Circuits
- 10.6.2.2. Printed Circuit Boards
- 10.7. Market Analysis, Insights and Forecast - by Water Treatment Chemicals
- 10.7.1. Dynamics
- 10.7.2. Function
- 10.7.2.1. Flocculants
- 10.7.2.2. Coagulants
- 10.7.2.3. Biocides and Disinfectants
- 10.7.2.4. Defoamers and Defoaming Agents
- 10.7.2.5. pH Adjusters and Softeners
- 10.7.2.6. Other Functions
- 10.8. Market Analysis, Insights and Forecast - by Food Additives
- 10.8.1. Dynamics
- 10.8.2. Type
- 10.8.2.1. Natural Additives
- 10.8.2.2. Synthetic Additives
- 10.9. Market Analysis, Insights and Forecast - by Agrochemicals
- 10.9.1. Dynamics
- 10.9.2. Type
- 10.9.2.1. Fertilizers
- 10.9.2.2. Herbicide
- 10.9.2.3. Fungicide
- 10.9.2.4. Insecticide
- 10.9.2.5. Nematicide
- 10.9.2.6. Molluscicide
- 10.9.2.7. Other Crop Protection Chemicals
- 10.10. Market Analysis, Insights and Forecast - by Industrial and Institutional Cleaners
- 10.10.1. Dynamics
- 10.10.2. Application
- 10.10.2.1. General Purpose Cleaners
- 10.10.2.2. Disinfectants and Sanitizers
- 10.10.2.3. Laundry Care Products
- 10.10.2.4. Vehicle Wash Products
- 10.11. Market Analysis, Insights and Forecast - by Lubricant Additives
- 10.11.1. Dynamics
- 10.11.2. Product Type
- 10.11.2.1. Dispersants and Emulsifiers
- 10.11.2.2. Detergents
- 10.11.2.3. Oxidation Inhibitors
- 10.11.2.4. Extreme-pressure Additives and Anti-wear Additives
- 10.11.2.5. Viscosity Index Modifiers
- 10.11.2.6. Friction Modifiers
- 10.11.2.7. Corrosion Inhibitors
- 10.11.2.8. Other Product Types
- 10.12. Market Analysis, Insights and Forecast - by Mining Chemicals
- 10.12.1. Dynamics
- 10.12.2. Function
- 10.12.2.1. Flotation Chemicals
- 10.12.2.2. Extraction Chemicals
- 10.12.2.3. Grinding Aids
- 10.13. Market Analysis, Insights and Forecast - by Oilfield Chemicals
- 10.13.1. Dynamics
- 10.13.2. Application
- 10.13.2.1. Biocide
- 10.13.2.2. Corrosion and Scale Inhibitor
- 10.13.2.3. Demulsifier
- 10.13.2.4. Polymer
- 10.13.2.5. Surfactant
- 10.13.2.6. Other Chemical Types
- 10.14. Market Analysis, Insights and Forecast - by Adhesives and Sealants
- 10.14.1. Dynamics
- 10.14.2. Technology
- 10.14.2.1. Water-borne Adhesives
- 10.14.2.2. Solvent-borne Adhesives
- 10.14.2.3. Hot-melt Adhesives
- 10.14.2.4. Reactive Adhesives
- 10.14.2.5. Other Adhesives
- 10.15. Market Analysis, Insights and Forecast - by Plastic Additives
- 10.15.1. Dynamics
- 10.15.2. Plastic Type
- 10.15.2.1. Polyethylene (PE)
- 10.15.2.2. Polystyrene (PS)
- 10.15.2.3. Polypropylene (PP)
- 10.15.2.4. Polyamide (PA)
- 10.15.2.5. Polyethylene Terephthalate (PET)
- 10.15.2.6. Polyvinyl Chloride (PVC)
- 10.15.2.7. Polycarbonate (PC)
- 10.15.2.8. Other Plastic Types
- 10.16. Market Analysis, Insights and Forecast - by Rubber Processing Chemicals
- 10.16.1. Dynamics
- 10.16.2. Application
- 10.16.2.1. Tire
- 10.16.2.2. Non-tire
- 10.17. Market Analysis, Insights and Forecast - by Specialty Polymers
- 10.17.1. Dynamics
- 10.18. Market Analysis, Insights and Forecast - by Textile Chemicals
- 10.18.1. Dynamics
- 10.18.2. Application
- 10.18.2.1. Coating and Sizing Chemicals
- 10.18.2.2. Colorants and Auxiliaries
- 10.18.2.3. Finishing Agents
- 10.18.2.4. Desizing Agents
- 10.18.2.5. Other Application
- 10.1. Market Analysis, Insights and Forecast - by Paints and Coatings
- 11. Asia Pacific Speciality Chemicals Market Analysis, Insights and Forecast, 2019-2031
- 11.1. Market Analysis, Insights and Forecast - By Country/Sub-region
- 11.1.1 China
- 11.1.2 India
- 11.1.3 Japan
- 11.1.4 South Korea
- 11.1.5 ASEAN Countries
- 11.1.6 Rest of Asia Pacific
- 12. North America Speciality Chemicals Market Analysis, Insights and Forecast, 2019-2031
- 12.1. Market Analysis, Insights and Forecast - By Country/Sub-region
- 12.1.1 United States
- 12.1.2 Canada
- 12.1.3 Mexico
- 12.1.4 Rest of North America
- 13. Europe Speciality Chemicals Market Analysis, Insights and Forecast, 2019-2031
- 13.1. Market Analysis, Insights and Forecast - By Country/Sub-region
- 13.1.1 Germany
- 13.1.2 United Kingdom
- 13.1.3 Italy
- 13.1.4 France
- 13.1.5 Spain
- 13.1.6 Rest of Europe
- 14. South America Speciality Chemicals Market Analysis, Insights and Forecast, 2019-2031
- 14.1. Market Analysis, Insights and Forecast - By Country/Sub-region
- 14.1.1 Brazil
- 14.1.2 Argentina
- 14.1.3 Rest of South America
- 15. Middle East and Africa Speciality Chemicals Market Analysis, Insights and Forecast, 2019-2031
- 15.1. Market Analysis, Insights and Forecast - By Country/Sub-region
- 15.1.1 Saudi Arabia
- 15.1.2 South Africa
- 15.1.3 Rest of Middle East and Africa
- 16. Competitive Analysis
- 16.1. Global Market Share Analysis 2024
- 16.2. Company Profiles
- 16.2.1 Ferro Corporation
- 16.2.1.1. Overview
- 16.2.1.2. Products
- 16.2.1.3. SWOT Analysis
- 16.2.1.4. Recent Developments
- 16.2.1.5. Financials (Based on Availability)
- 16.2.2 Infineum International Limited
- 16.2.2.1. Overview
- 16.2.2.2. Products
- 16.2.2.3. SWOT Analysis
- 16.2.2.4. Recent Developments
- 16.2.2.5. Financials (Based on Availability)
- 16.2.3 Henkel AG & Co KGaA
- 16.2.3.1. Overview
- 16.2.3.2. Products
- 16.2.3.3. SWOT Analysis
- 16.2.3.4. Recent Developments
- 16.2.3.5. Financials (Based on Availability)
- 16.2.4 DIC Corporation
- 16.2.4.1. Overview
- 16.2.4.2. Products
- 16.2.4.3. SWOT Analysis
- 16.2.4.4. Recent Developments
- 16.2.4.5. Financials (Based on Availability)
- 16.2.5 Corteva
- 16.2.5.1. Overview
- 16.2.5.2. Products
- 16.2.5.3. SWOT Analysis
- 16.2.5.4. Recent Developments
- 16.2.5.5. Financials (Based on Availability)
- 16.2.6 Clariant
- 16.2.6.1. Overview
- 16.2.6.2. Products
- 16.2.6.3. SWOT Analysis
- 16.2.6.4. Recent Developments
- 16.2.6.5. Financials (Based on Availability)
- 16.2.7 Ecolab
- 16.2.7.1. Overview
- 16.2.7.2. Products
- 16.2.7.3. SWOT Analysis
- 16.2.7.4. Recent Developments
- 16.2.7.5. Financials (Based on Availability)
- 16.2.8 GCP Applied Technologies Inc
- 16.2.8.1. Overview
- 16.2.8.2. Products
- 16.2.8.3. SWOT Analysis
- 16.2.8.4. Recent Developments
- 16.2.8.5. Financials (Based on Availability)
- 16.2.9 Holcim
- 16.2.9.1. Overview
- 16.2.9.2. Products
- 16.2.9.3. SWOT Analysis
- 16.2.9.4. Recent Developments
- 16.2.9.5. Financials (Based on Availability)
- 16.2.10 Nouryon
- 16.2.10.1. Overview
- 16.2.10.2. Products
- 16.2.10.3. SWOT Analysis
- 16.2.10.4. Recent Developments
- 16.2.10.5. Financials (Based on Availability)
- 16.2.1 Ferro Corporation
List of Figures
- Figure 1: Global Speciality Chemicals Market Revenue Breakdown (Million, %) by Region 2024 & 2032
- Figure 2: Asia Pacific Speciality Chemicals Market Revenue (Million), by Country 2024 & 2032
- Figure 3: Asia Pacific Speciality Chemicals Market Revenue Share (%), by Country 2024 & 2032
- Figure 4: North America Speciality Chemicals Market Revenue (Million), by Country 2024 & 2032
- Figure 5: North America Speciality Chemicals Market Revenue Share (%), by Country 2024 & 2032
- Figure 6: Europe Speciality Chemicals Market Revenue (Million), by Country 2024 & 2032
- Figure 7: Europe Speciality Chemicals Market Revenue Share (%), by Country 2024 & 2032
- Figure 8: South America Speciality Chemicals Market Revenue (Million), by Country 2024 & 2032
- Figure 9: South America Speciality Chemicals Market Revenue Share (%), by Country 2024 & 2032
- Figure 10: Middle East and Africa Speciality Chemicals Market Revenue (Million), by Country 2024 & 2032
- Figure 11: Middle East and Africa Speciality Chemicals Market Revenue Share (%), by Country 2024 & 2032
- Figure 12: Asia Pacific Speciality Chemicals Market Revenue (Million), by Paints and Coatings 2024 & 2032
- Figure 13: Asia Pacific Speciality Chemicals Market Revenue Share (%), by Paints and Coatings 2024 & 2032
- Figure 14: Asia Pacific Speciality Chemicals Market Revenue (Million), by Catalysts 2024 & 2032
- Figure 15: Asia Pacific Speciality Chemicals Market Revenue Share (%), by Catalysts 2024 & 2032
- Figure 16: Asia Pacific Speciality Chemicals Market Revenue (Million), by Construction Chemicals 2024 & 2032
- Figure 17: Asia Pacific Speciality Chemicals Market Revenue Share (%), by Construction Chemicals 2024 & 2032
- Figure 18: Asia Pacific Speciality Chemicals Market Revenue (Million), by Cosmetic Chemicals 2024 & 2032
- Figure 19: Asia Pacific Speciality Chemicals Market Revenue Share (%), by Cosmetic Chemicals 2024 & 2032
- Figure 20: Asia Pacific Speciality Chemicals Market Revenue (Million), by Dyes, Inks, and Pigments 2024 & 2032
- Figure 21: Asia Pacific Speciality Chemicals Market Revenue Share (%), by Dyes, Inks, and Pigments 2024 & 2032
- Figure 22: Asia Pacific Speciality Chemicals Market Revenue (Million), by Electronic Chemicals 2024 & 2032
- Figure 23: Asia Pacific Speciality Chemicals Market Revenue Share (%), by Electronic Chemicals 2024 & 2032
- Figure 24: Asia Pacific Speciality Chemicals Market Revenue (Million), by Water Treatment Chemicals 2024 & 2032
- Figure 25: Asia Pacific Speciality Chemicals Market Revenue Share (%), by Water Treatment Chemicals 2024 & 2032
- Figure 26: Asia Pacific Speciality Chemicals Market Revenue (Million), by Food Additives 2024 & 2032
- Figure 27: Asia Pacific Speciality Chemicals Market Revenue Share (%), by Food Additives 2024 & 2032
- Figure 28: Asia Pacific Speciality Chemicals Market Revenue (Million), by Agrochemicals 2024 & 2032
- Figure 29: Asia Pacific Speciality Chemicals Market Revenue Share (%), by Agrochemicals 2024 & 2032
- Figure 30: Asia Pacific Speciality Chemicals Market Revenue (Million), by Industrial and Institutional Cleaners 2024 & 2032
- Figure 31: Asia Pacific Speciality Chemicals Market Revenue Share (%), by Industrial and Institutional Cleaners 2024 & 2032
- Figure 32: Asia Pacific Speciality Chemicals Market Revenue (Million), by Lubricant Additives 2024 & 2032
- Figure 33: Asia Pacific Speciality Chemicals Market Revenue Share (%), by Lubricant Additives 2024 & 2032
- Figure 34: Asia Pacific Speciality Chemicals Market Revenue (Million), by Mining Chemicals 2024 & 2032
- Figure 35: Asia Pacific Speciality Chemicals Market Revenue Share (%), by Mining Chemicals 2024 & 2032
- Figure 36: Asia Pacific Speciality Chemicals Market Revenue (Million), by Oilfield Chemicals 2024 & 2032
- Figure 37: Asia Pacific Speciality Chemicals Market Revenue Share (%), by Oilfield Chemicals 2024 & 2032
- Figure 38: Asia Pacific Speciality Chemicals Market Revenue (Million), by Adhesives and Sealants 2024 & 2032
- Figure 39: Asia Pacific Speciality Chemicals Market Revenue Share (%), by Adhesives and Sealants 2024 & 2032
- Figure 40: Asia Pacific Speciality Chemicals Market Revenue (Million), by Plastic Additives 2024 & 2032
- Figure 41: Asia Pacific Speciality Chemicals Market Revenue Share (%), by Plastic Additives 2024 & 2032
- Figure 42: Asia Pacific Speciality Chemicals Market Revenue (Million), by Rubber Processing Chemicals 2024 & 2032
- Figure 43: Asia Pacific Speciality Chemicals Market Revenue Share (%), by Rubber Processing Chemicals 2024 & 2032
- Figure 44: Asia Pacific Speciality Chemicals Market Revenue (Million), by Specialty Polymers 2024 & 2032
- Figure 45: Asia Pacific Speciality Chemicals Market Revenue Share (%), by Specialty Polymers 2024 & 2032
- Figure 46: Asia Pacific Speciality Chemicals Market Revenue (Million), by Textile Chemicals 2024 & 2032
- Figure 47: Asia Pacific Speciality Chemicals Market Revenue Share (%), by Textile Chemicals 2024 & 2032
- Figure 48: Asia Pacific Speciality Chemicals Market Revenue (Million), by Country 2024 & 2032
- Figure 49: Asia Pacific Speciality Chemicals Market Revenue Share (%), by Country 2024 & 2032
- Figure 50: North America Speciality Chemicals Market Revenue (Million), by Paints and Coatings 2024 & 2032
- Figure 51: North America Speciality Chemicals Market Revenue Share (%), by Paints and Coatings 2024 & 2032
- Figure 52: North America Speciality Chemicals Market Revenue (Million), by Catalysts 2024 & 2032
- Figure 53: North America Speciality Chemicals Market Revenue Share (%), by Catalysts 2024 & 2032
- Figure 54: North America Speciality Chemicals Market Revenue (Million), by Construction Chemicals 2024 & 2032
- Figure 55: North America Speciality Chemicals Market Revenue Share (%), by Construction Chemicals 2024 & 2032
- Figure 56: North America Speciality Chemicals Market Revenue (Million), by Cosmetic Chemicals 2024 & 2032
- Figure 57: North America Speciality Chemicals Market Revenue Share (%), by Cosmetic Chemicals 2024 & 2032
- Figure 58: North America Speciality Chemicals Market Revenue (Million), by Dyes, Inks, and Pigments 2024 & 2032
- Figure 59: North America Speciality Chemicals Market Revenue Share (%), by Dyes, Inks, and Pigments 2024 & 2032
- Figure 60: North America Speciality Chemicals Market Revenue (Million), by Electronic Chemicals 2024 & 2032
- Figure 61: North America Speciality Chemicals Market Revenue Share (%), by Electronic Chemicals 2024 & 2032
- Figure 62: North America Speciality Chemicals Market Revenue (Million), by Water Treatment Chemicals 2024 & 2032
- Figure 63: North America Speciality Chemicals Market Revenue Share (%), by Water Treatment Chemicals 2024 & 2032
- Figure 64: North America Speciality Chemicals Market Revenue (Million), by Food Additives 2024 & 2032
- Figure 65: North America Speciality Chemicals Market Revenue Share (%), by Food Additives 2024 & 2032
- Figure 66: North America Speciality Chemicals Market Revenue (Million), by Agrochemicals 2024 & 2032
- Figure 67: North America Speciality Chemicals Market Revenue Share (%), by Agrochemicals 2024 & 2032
- Figure 68: North America Speciality Chemicals Market Revenue (Million), by Industrial and Institutional Cleaners 2024 & 2032
- Figure 69: North America Speciality Chemicals Market Revenue Share (%), by Industrial and Institutional Cleaners 2024 & 2032
- Figure 70: North America Speciality Chemicals Market Revenue (Million), by Lubricant Additives 2024 & 2032
- Figure 71: North America Speciality Chemicals Market Revenue Share (%), by Lubricant Additives 2024 & 2032
- Figure 72: North America Speciality Chemicals Market Revenue (Million), by Mining Chemicals 2024 & 2032
- Figure 73: North America Speciality Chemicals Market Revenue Share (%), by Mining Chemicals 2024 & 2032
- Figure 74: North America Speciality Chemicals Market Revenue (Million), by Oilfield Chemicals 2024 & 2032
- Figure 75: North America Speciality Chemicals Market Revenue Share (%), by Oilfield Chemicals 2024 & 2032
- Figure 76: North America Speciality Chemicals Market Revenue (Million), by Adhesives and Sealants 2024 & 2032
- Figure 77: North America Speciality Chemicals Market Revenue Share (%), by Adhesives and Sealants 2024 & 2032
- Figure 78: North America Speciality Chemicals Market Revenue (Million), by Plastic Additives 2024 & 2032
- Figure 79: North America Speciality Chemicals Market Revenue Share (%), by Plastic Additives 2024 & 2032
- Figure 80: North America Speciality Chemicals Market Revenue (Million), by Rubber Processing Chemicals 2024 & 2032
- Figure 81: North America Speciality Chemicals Market Revenue Share (%), by Rubber Processing Chemicals 2024 & 2032
- Figure 82: North America Speciality Chemicals Market Revenue (Million), by Specialty Polymers 2024 & 2032
- Figure 83: North America Speciality Chemicals Market Revenue Share (%), by Specialty Polymers 2024 & 2032
- Figure 84: North America Speciality Chemicals Market Revenue (Million), by Textile Chemicals 2024 & 2032
- Figure 85: North America Speciality Chemicals Market Revenue Share (%), by Textile Chemicals 2024 & 2032
- Figure 86: North America Speciality Chemicals Market Revenue (Million), by Country 2024 & 2032
- Figure 87: North America Speciality Chemicals Market Revenue Share (%), by Country 2024 & 2032
- Figure 88: Europe Speciality Chemicals Market Revenue (Million), by Paints and Coatings 2024 & 2032
- Figure 89: Europe Speciality Chemicals Market Revenue Share (%), by Paints and Coatings 2024 & 2032
- Figure 90: Europe Speciality Chemicals Market Revenue (Million), by Catalysts 2024 & 2032
- Figure 91: Europe Speciality Chemicals Market Revenue Share (%), by Catalysts 2024 & 2032
- Figure 92: Europe Speciality Chemicals Market Revenue (Million), by Construction Chemicals 2024 & 2032
- Figure 93: Europe Speciality Chemicals Market Revenue Share (%), by Construction Chemicals 2024 & 2032
- Figure 94: Europe Speciality Chemicals Market Revenue (Million), by Cosmetic Chemicals 2024 & 2032
- Figure 95: Europe Speciality Chemicals Market Revenue Share (%), by Cosmetic Chemicals 2024 & 2032
- Figure 96: Europe Speciality Chemicals Market Revenue (Million), by Dyes, Inks, and Pigments 2024 & 2032
- Figure 97: Europe Speciality Chemicals Market Revenue Share (%), by Dyes, Inks, and Pigments 2024 & 2032
- Figure 98: Europe Speciality Chemicals Market Revenue (Million), by Electronic Chemicals 2024 & 2032
- Figure 99: Europe Speciality Chemicals Market Revenue Share (%), by Electronic Chemicals 2024 & 2032
- Figure 100: Europe Speciality Chemicals Market Revenue (Million), by Water Treatment Chemicals 2024 & 2032
- Figure 101: Europe Speciality Chemicals Market Revenue Share (%), by Water Treatment Chemicals 2024 & 2032
- Figure 102: Europe Speciality Chemicals Market Revenue (Million), by Food Additives 2024 & 2032
- Figure 103: Europe Speciality Chemicals Market Revenue Share (%), by Food Additives 2024 & 2032
- Figure 104: Europe Speciality Chemicals Market Revenue (Million), by Agrochemicals 2024 & 2032
- Figure 105: Europe Speciality Chemicals Market Revenue Share (%), by Agrochemicals 2024 & 2032
- Figure 106: Europe Speciality Chemicals Market Revenue (Million), by Industrial and Institutional Cleaners 2024 & 2032
- Figure 107: Europe Speciality Chemicals Market Revenue Share (%), by Industrial and Institutional Cleaners 2024 & 2032
- Figure 108: Europe Speciality Chemicals Market Revenue (Million), by Lubricant Additives 2024 & 2032
- Figure 109: Europe Speciality Chemicals Market Revenue Share (%), by Lubricant Additives 2024 & 2032
- Figure 110: Europe Speciality Chemicals Market Revenue (Million), by Mining Chemicals 2024 & 2032
- Figure 111: Europe Speciality Chemicals Market Revenue Share (%), by Mining Chemicals 2024 & 2032
- Figure 112: Europe Speciality Chemicals Market Revenue (Million), by Oilfield Chemicals 2024 & 2032
- Figure 113: Europe Speciality Chemicals Market Revenue Share (%), by Oilfield Chemicals 2024 & 2032
- Figure 114: Europe Speciality Chemicals Market Revenue (Million), by Adhesives and Sealants 2024 & 2032
- Figure 115: Europe Speciality Chemicals Market Revenue Share (%), by Adhesives and Sealants 2024 & 2032
- Figure 116: Europe Speciality Chemicals Market Revenue (Million), by Plastic Additives 2024 & 2032
- Figure 117: Europe Speciality Chemicals Market Revenue Share (%), by Plastic Additives 2024 & 2032
- Figure 118: Europe Speciality Chemicals Market Revenue (Million), by Rubber Processing Chemicals 2024 & 2032
- Figure 119: Europe Speciality Chemicals Market Revenue Share (%), by Rubber Processing Chemicals 2024 & 2032
- Figure 120: Europe Speciality Chemicals Market Revenue (Million), by Specialty Polymers 2024 & 2032
- Figure 121: Europe Speciality Chemicals Market Revenue Share (%), by Specialty Polymers 2024 & 2032
- Figure 122: Europe Speciality Chemicals Market Revenue (Million), by Textile Chemicals 2024 & 2032
- Figure 123: Europe Speciality Chemicals Market Revenue Share (%), by Textile Chemicals 2024 & 2032
- Figure 124: Europe Speciality Chemicals Market Revenue (Million), by Country 2024 & 2032
- Figure 125: Europe Speciality Chemicals Market Revenue Share (%), by Country 2024 & 2032
- Figure 126: South America Speciality Chemicals Market Revenue (Million), by Paints and Coatings 2024 & 2032
- Figure 127: South America Speciality Chemicals Market Revenue Share (%), by Paints and Coatings 2024 & 2032
- Figure 128: South America Speciality Chemicals Market Revenue (Million), by Catalysts 2024 & 2032
- Figure 129: South America Speciality Chemicals Market Revenue Share (%), by Catalysts 2024 & 2032
- Figure 130: South America Speciality Chemicals Market Revenue (Million), by Construction Chemicals 2024 & 2032
- Figure 131: South America Speciality Chemicals Market Revenue Share (%), by Construction Chemicals 2024 & 2032
- Figure 132: South America Speciality Chemicals Market Revenue (Million), by Cosmetic Chemicals 2024 & 2032
- Figure 133: South America Speciality Chemicals Market Revenue Share (%), by Cosmetic Chemicals 2024 & 2032
- Figure 134: South America Speciality Chemicals Market Revenue (Million), by Dyes, Inks, and Pigments 2024 & 2032
- Figure 135: South America Speciality Chemicals Market Revenue Share (%), by Dyes, Inks, and Pigments 2024 & 2032
- Figure 136: South America Speciality Chemicals Market Revenue (Million), by Electronic Chemicals 2024 & 2032
- Figure 137: South America Speciality Chemicals Market Revenue Share (%), by Electronic Chemicals 2024 & 2032
- Figure 138: South America Speciality Chemicals Market Revenue (Million), by Water Treatment Chemicals 2024 & 2032
- Figure 139: South America Speciality Chemicals Market Revenue Share (%), by Water Treatment Chemicals 2024 & 2032
- Figure 140: South America Speciality Chemicals Market Revenue (Million), by Food Additives 2024 & 2032
- Figure 141: South America Speciality Chemicals Market Revenue Share (%), by Food Additives 2024 & 2032
- Figure 142: South America Speciality Chemicals Market Revenue (Million), by Agrochemicals 2024 & 2032
- Figure 143: South America Speciality Chemicals Market Revenue Share (%), by Agrochemicals 2024 & 2032
- Figure 144: South America Speciality Chemicals Market Revenue (Million), by Industrial and Institutional Cleaners 2024 & 2032
- Figure 145: South America Speciality Chemicals Market Revenue Share (%), by Industrial and Institutional Cleaners 2024 & 2032
- Figure 146: South America Speciality Chemicals Market Revenue (Million), by Lubricant Additives 2024 & 2032
- Figure 147: South America Speciality Chemicals Market Revenue Share (%), by Lubricant Additives 2024 & 2032
- Figure 148: South America Speciality Chemicals Market Revenue (Million), by Mining Chemicals 2024 & 2032
- Figure 149: South America Speciality Chemicals Market Revenue Share (%), by Mining Chemicals 2024 & 2032
- Figure 150: South America Speciality Chemicals Market Revenue (Million), by Oilfield Chemicals 2024 & 2032
- Figure 151: South America Speciality Chemicals Market Revenue Share (%), by Oilfield Chemicals 2024 & 2032
- Figure 152: South America Speciality Chemicals Market Revenue (Million), by Adhesives and Sealants 2024 & 2032
- Figure 153: South America Speciality Chemicals Market Revenue Share (%), by Adhesives and Sealants 2024 & 2032
- Figure 154: South America Speciality Chemicals Market Revenue (Million), by Plastic Additives 2024 & 2032
- Figure 155: South America Speciality Chemicals Market Revenue Share (%), by Plastic Additives 2024 & 2032
- Figure 156: South America Speciality Chemicals Market Revenue (Million), by Rubber Processing Chemicals 2024 & 2032
- Figure 157: South America Speciality Chemicals Market Revenue Share (%), by Rubber Processing Chemicals 2024 & 2032
- Figure 158: South America Speciality Chemicals Market Revenue (Million), by Specialty Polymers 2024 & 2032
- Figure 159: South America Speciality Chemicals Market Revenue Share (%), by Specialty Polymers 2024 & 2032
- Figure 160: South America Speciality Chemicals Market Revenue (Million), by Textile Chemicals 2024 & 2032
- Figure 161: South America Speciality Chemicals Market Revenue Share (%), by Textile Chemicals 2024 & 2032
- Figure 162: South America Speciality Chemicals Market Revenue (Million), by Country 2024 & 2032
- Figure 163: South America Speciality Chemicals Market Revenue Share (%), by Country 2024 & 2032
- Figure 164: Middle East and Africa Speciality Chemicals Market Revenue (Million), by Paints and Coatings 2024 & 2032
- Figure 165: Middle East and Africa Speciality Chemicals Market Revenue Share (%), by Paints and Coatings 2024 & 2032
- Figure 166: Middle East and Africa Speciality Chemicals Market Revenue (Million), by Catalysts 2024 & 2032
- Figure 167: Middle East and Africa Speciality Chemicals Market Revenue Share (%), by Catalysts 2024 & 2032
- Figure 168: Middle East and Africa Speciality Chemicals Market Revenue (Million), by Construction Chemicals 2024 & 2032
- Figure 169: Middle East and Africa Speciality Chemicals Market Revenue Share (%), by Construction Chemicals 2024 & 2032
- Figure 170: Middle East and Africa Speciality Chemicals Market Revenue (Million), by Cosmetic Chemicals 2024 & 2032
- Figure 171: Middle East and Africa Speciality Chemicals Market Revenue Share (%), by Cosmetic Chemicals 2024 & 2032
- Figure 172: Middle East and Africa Speciality Chemicals Market Revenue (Million), by Dyes, Inks, and Pigments 2024 & 2032
- Figure 173: Middle East and Africa Speciality Chemicals Market Revenue Share (%), by Dyes, Inks, and Pigments 2024 & 2032
- Figure 174: Middle East and Africa Speciality Chemicals Market Revenue (Million), by Electronic Chemicals 2024 & 2032
- Figure 175: Middle East and Africa Speciality Chemicals Market Revenue Share (%), by Electronic Chemicals 2024 & 2032
- Figure 176: Middle East and Africa Speciality Chemicals Market Revenue (Million), by Water Treatment Chemicals 2024 & 2032
- Figure 177: Middle East and Africa Speciality Chemicals Market Revenue Share (%), by Water Treatment Chemicals 2024 & 2032
- Figure 178: Middle East and Africa Speciality Chemicals Market Revenue (Million), by Food Additives 2024 & 2032
- Figure 179: Middle East and Africa Speciality Chemicals Market Revenue Share (%), by Food Additives 2024 & 2032
- Figure 180: Middle East and Africa Speciality Chemicals Market Revenue (Million), by Agrochemicals 2024 & 2032
- Figure 181: Middle East and Africa Speciality Chemicals Market Revenue Share (%), by Agrochemicals 2024 & 2032
- Figure 182: Middle East and Africa Speciality Chemicals Market Revenue (Million), by Industrial and Institutional Cleaners 2024 & 2032
- Figure 183: Middle East and Africa Speciality Chemicals Market Revenue Share (%), by Industrial and Institutional Cleaners 2024 & 2032
- Figure 184: Middle East and Africa Speciality Chemicals Market Revenue (Million), by Lubricant Additives 2024 & 2032
- Figure 185: Middle East and Africa Speciality Chemicals Market Revenue Share (%), by Lubricant Additives 2024 & 2032
- Figure 186: Middle East and Africa Speciality Chemicals Market Revenue (Million), by Mining Chemicals 2024 & 2032
- Figure 187: Middle East and Africa Speciality Chemicals Market Revenue Share (%), by Mining Chemicals 2024 & 2032
- Figure 188: Middle East and Africa Speciality Chemicals Market Revenue (Million), by Oilfield Chemicals 2024 & 2032
- Figure 189: Middle East and Africa Speciality Chemicals Market Revenue Share (%), by Oilfield Chemicals 2024 & 2032
- Figure 190: Middle East and Africa Speciality Chemicals Market Revenue (Million), by Adhesives and Sealants 2024 & 2032
- Figure 191: Middle East and Africa Speciality Chemicals Market Revenue Share (%), by Adhesives and Sealants 2024 & 2032
- Figure 192: Middle East and Africa Speciality Chemicals Market Revenue (Million), by Plastic Additives 2024 & 2032
- Figure 193: Middle East and Africa Speciality Chemicals Market Revenue Share (%), by Plastic Additives 2024 & 2032
- Figure 194: Middle East and Africa Speciality Chemicals Market Revenue (Million), by Rubber Processing Chemicals 2024 & 2032
- Figure 195: Middle East and Africa Speciality Chemicals Market Revenue Share (%), by Rubber Processing Chemicals 2024 & 2032
- Figure 196: Middle East and Africa Speciality Chemicals Market Revenue (Million), by Specialty Polymers 2024 & 2032
- Figure 197: Middle East and Africa Speciality Chemicals Market Revenue Share (%), by Specialty Polymers 2024 & 2032
- Figure 198: Middle East and Africa Speciality Chemicals Market Revenue (Million), by Textile Chemicals 2024 & 2032
- Figure 199: Middle East and Africa Speciality Chemicals Market Revenue Share (%), by Textile Chemicals 2024 & 2032
- Figure 200: Middle East and Africa Speciality Chemicals Market Revenue (Million), by Country 2024 & 2032
- Figure 201: Middle East and Africa Speciality Chemicals Market Revenue Share (%), by Country 2024 & 2032
List of Tables
- Table 1: Global Speciality Chemicals Market Revenue Million Forecast, by Region 2019 & 2032
- Table 2: Global Speciality Chemicals Market Revenue Million Forecast, by Paints and Coatings 2019 & 2032
- Table 3: Global Speciality Chemicals Market Revenue Million Forecast, by Catalysts 2019 & 2032
- Table 4: Global Speciality Chemicals Market Revenue Million Forecast, by Construction Chemicals 2019 & 2032
- Table 5: Global Speciality Chemicals Market Revenue Million Forecast, by Cosmetic Chemicals 2019 & 2032
- Table 6: Global Speciality Chemicals Market Revenue Million Forecast, by Dyes, Inks, and Pigments 2019 & 2032
- Table 7: Global Speciality Chemicals Market Revenue Million Forecast, by Electronic Chemicals 2019 & 2032
- Table 8: Global Speciality Chemicals Market Revenue Million Forecast, by Water Treatment Chemicals 2019 & 2032
- Table 9: Global Speciality Chemicals Market Revenue Million Forecast, by Food Additives 2019 & 2032
- Table 10: Global Speciality Chemicals Market Revenue Million Forecast, by Agrochemicals 2019 & 2032
- Table 11: Global Speciality Chemicals Market Revenue Million Forecast, by Industrial and Institutional Cleaners 2019 & 2032
- Table 12: Global Speciality Chemicals Market Revenue Million Forecast, by Lubricant Additives 2019 & 2032
- Table 13: Global Speciality Chemicals Market Revenue Million Forecast, by Mining Chemicals 2019 & 2032
- Table 14: Global Speciality Chemicals Market Revenue Million Forecast, by Oilfield Chemicals 2019 & 2032
- Table 15: Global Speciality Chemicals Market Revenue Million Forecast, by Adhesives and Sealants 2019 & 2032
- Table 16: Global Speciality Chemicals Market Revenue Million Forecast, by Plastic Additives 2019 & 2032
- Table 17: Global Speciality Chemicals Market Revenue Million Forecast, by Rubber Processing Chemicals 2019 & 2032
- Table 18: Global Speciality Chemicals Market Revenue Million Forecast, by Specialty Polymers 2019 & 2032
- Table 19: Global Speciality Chemicals Market Revenue Million Forecast, by Textile Chemicals 2019 & 2032
- Table 20: Global Speciality Chemicals Market Revenue Million Forecast, by Region 2019 & 2032
- Table 21: Global Speciality Chemicals Market Revenue Million Forecast, by Country 2019 & 2032
- Table 22: China Speciality Chemicals Market Revenue (Million) Forecast, by Application 2019 & 2032
- Table 23: India Speciality Chemicals Market Revenue (Million) Forecast, by Application 2019 & 2032
- Table 24: Japan Speciality Chemicals Market Revenue (Million) Forecast, by Application 2019 & 2032
- Table 25: South Korea Speciality Chemicals Market Revenue (Million) Forecast, by Application 2019 & 2032
- Table 26: ASEAN Countries Speciality Chemicals Market Revenue (Million) Forecast, by Application 2019 & 2032
- Table 27: Rest of Asia Pacific Speciality Chemicals Market Revenue (Million) Forecast, by Application 2019 & 2032
- Table 28: Global Speciality Chemicals Market Revenue Million Forecast, by Country 2019 & 2032
- Table 29: United States Speciality Chemicals Market Revenue (Million) Forecast, by Application 2019 & 2032
- Table 30: Canada Speciality Chemicals Market Revenue (Million) Forecast, by Application 2019 & 2032
- Table 31: Mexico Speciality Chemicals Market Revenue (Million) Forecast, by Application 2019 & 2032
- Table 32: Rest of North America Speciality Chemicals Market Revenue (Million) Forecast, by Application 2019 & 2032
- Table 33: Global Speciality Chemicals Market Revenue Million Forecast, by Country 2019 & 2032
- Table 34: Germany Speciality Chemicals Market Revenue (Million) Forecast, by Application 2019 & 2032
- Table 35: United Kingdom Speciality Chemicals Market Revenue (Million) Forecast, by Application 2019 & 2032
- Table 36: Italy Speciality Chemicals Market Revenue (Million) Forecast, by Application 2019 & 2032
- Table 37: France Speciality Chemicals Market Revenue (Million) Forecast, by Application 2019 & 2032
- Table 38: Spain Speciality Chemicals Market Revenue (Million) Forecast, by Application 2019 & 2032
- Table 39: Rest of Europe Speciality Chemicals Market Revenue (Million) Forecast, by Application 2019 & 2032
- Table 40: Global Speciality Chemicals Market Revenue Million Forecast, by Country 2019 & 2032
- Table 41: Brazil Speciality Chemicals Market Revenue (Million) Forecast, by Application 2019 & 2032
- Table 42: Argentina Speciality Chemicals Market Revenue (Million) Forecast, by Application 2019 & 2032
- Table 43: Rest of South America Speciality Chemicals Market Revenue (Million) Forecast, by Application 2019 & 2032
- Table 44: Global Speciality Chemicals Market Revenue Million Forecast, by Country 2019 & 2032
- Table 45: Saudi Arabia Speciality Chemicals Market Revenue (Million) Forecast, by Application 2019 & 2032
- Table 46: South Africa Speciality Chemicals Market Revenue (Million) Forecast, by Application 2019 & 2032
- Table 47: Rest of Middle East and Africa Speciality Chemicals Market Revenue (Million) Forecast, by Application 2019 & 2032
- Table 48: Global Speciality Chemicals Market Revenue Million Forecast, by Paints and Coatings 2019 & 2032
- Table 49: Global Speciality Chemicals Market Revenue Million Forecast, by Catalysts 2019 & 2032
- Table 50: Global Speciality Chemicals Market Revenue Million Forecast, by Construction Chemicals 2019 & 2032
- Table 51: Global Speciality Chemicals Market Revenue Million Forecast, by Cosmetic Chemicals 2019 & 2032
- Table 52: Global Speciality Chemicals Market Revenue Million Forecast, by Dyes, Inks, and Pigments 2019 & 2032
- Table 53: Global Speciality Chemicals Market Revenue Million Forecast, by Electronic Chemicals 2019 & 2032
- Table 54: Global Speciality Chemicals Market Revenue Million Forecast, by Water Treatment Chemicals 2019 & 2032
- Table 55: Global Speciality Chemicals Market Revenue Million Forecast, by Food Additives 2019 & 2032
- Table 56: Global Speciality Chemicals Market Revenue Million Forecast, by Agrochemicals 2019 & 2032
- Table 57: Global Speciality Chemicals Market Revenue Million Forecast, by Industrial and Institutional Cleaners 2019 & 2032
- Table 58: Global Speciality Chemicals Market Revenue Million Forecast, by Lubricant Additives 2019 & 2032
- Table 59: Global Speciality Chemicals Market Revenue Million Forecast, by Mining Chemicals 2019 & 2032
- Table 60: Global Speciality Chemicals Market Revenue Million Forecast, by Oilfield Chemicals 2019 & 2032
- Table 61: Global Speciality Chemicals Market Revenue Million Forecast, by Adhesives and Sealants 2019 & 2032
- Table 62: Global Speciality Chemicals Market Revenue Million Forecast, by Plastic Additives 2019 & 2032
- Table 63: Global Speciality Chemicals Market Revenue Million Forecast, by Rubber Processing Chemicals 2019 & 2032
- Table 64: Global Speciality Chemicals Market Revenue Million Forecast, by Specialty Polymers 2019 & 2032
- Table 65: Global Speciality Chemicals Market Revenue Million Forecast, by Textile Chemicals 2019 & 2032
- Table 66: Global Speciality Chemicals Market Revenue Million Forecast, by Country 2019 & 2032
- Table 67: China Speciality Chemicals Market Revenue (Million) Forecast, by Application 2019 & 2032
- Table 68: India Speciality Chemicals Market Revenue (Million) Forecast, by Application 2019 & 2032
- Table 69: Japan Speciality Chemicals Market Revenue (Million) Forecast, by Application 2019 & 2032
- Table 70: South Korea Speciality Chemicals Market Revenue (Million) Forecast, by Application 2019 & 2032
- Table 71: ASEAN Countries Speciality Chemicals Market Revenue (Million) Forecast, by Application 2019 & 2032
- Table 72: Rest of Asia Pacific Speciality Chemicals Market Revenue (Million) Forecast, by Application 2019 & 2032
- Table 73: Global Speciality Chemicals Market Revenue Million Forecast, by Paints and Coatings 2019 & 2032
- Table 74: Global Speciality Chemicals Market Revenue Million Forecast, by Catalysts 2019 & 2032
- Table 75: Global Speciality Chemicals Market Revenue Million Forecast, by Construction Chemicals 2019 & 2032
- Table 76: Global Speciality Chemicals Market Revenue Million Forecast, by Cosmetic Chemicals 2019 & 2032
- Table 77: Global Speciality Chemicals Market Revenue Million Forecast, by Dyes, Inks, and Pigments 2019 & 2032
- Table 78: Global Speciality Chemicals Market Revenue Million Forecast, by Electronic Chemicals 2019 & 2032
- Table 79: Global Speciality Chemicals Market Revenue Million Forecast, by Water Treatment Chemicals 2019 & 2032
- Table 80: Global Speciality Chemicals Market Revenue Million Forecast, by Food Additives 2019 & 2032
- Table 81: Global Speciality Chemicals Market Revenue Million Forecast, by Agrochemicals 2019 & 2032
- Table 82: Global Speciality Chemicals Market Revenue Million Forecast, by Industrial and Institutional Cleaners 2019 & 2032
- Table 83: Global Speciality Chemicals Market Revenue Million Forecast, by Lubricant Additives 2019 & 2032
- Table 84: Global Speciality Chemicals Market Revenue Million Forecast, by Mining Chemicals 2019 & 2032
- Table 85: Global Speciality Chemicals Market Revenue Million Forecast, by Oilfield Chemicals 2019 & 2032
- Table 86: Global Speciality Chemicals Market Revenue Million Forecast, by Adhesives and Sealants 2019 & 2032
- Table 87: Global Speciality Chemicals Market Revenue Million Forecast, by Plastic Additives 2019 & 2032
- Table 88: Global Speciality Chemicals Market Revenue Million Forecast, by Rubber Processing Chemicals 2019 & 2032
- Table 89: Global Speciality Chemicals Market Revenue Million Forecast, by Specialty Polymers 2019 & 2032
- Table 90: Global Speciality Chemicals Market Revenue Million Forecast, by Textile Chemicals 2019 & 2032
- Table 91: Global Speciality Chemicals Market Revenue Million Forecast, by Country 2019 & 2032
- Table 92: United States Speciality Chemicals Market Revenue (Million) Forecast, by Application 2019 & 2032
- Table 93: Canada Speciality Chemicals Market Revenue (Million) Forecast, by Application 2019 & 2032
- Table 94: Mexico Speciality Chemicals Market Revenue (Million) Forecast, by Application 2019 & 2032
- Table 95: Rest of North America Speciality Chemicals Market Revenue (Million) Forecast, by Application 2019 & 2032
- Table 96: Global Speciality Chemicals Market Revenue Million Forecast, by Paints and Coatings 2019 & 2032
- Table 97: Global Speciality Chemicals Market Revenue Million Forecast, by Catalysts 2019 & 2032
- Table 98: Global Speciality Chemicals Market Revenue Million Forecast, by Construction Chemicals 2019 & 2032
- Table 99: Global Speciality Chemicals Market Revenue Million Forecast, by Cosmetic Chemicals 2019 & 2032
- Table 100: Global Speciality Chemicals Market Revenue Million Forecast, by Dyes, Inks, and Pigments 2019 & 2032
- Table 101: Global Speciality Chemicals Market Revenue Million Forecast, by Electronic Chemicals 2019 & 2032
- Table 102: Global Speciality Chemicals Market Revenue Million Forecast, by Water Treatment Chemicals 2019 & 2032
- Table 103: Global Speciality Chemicals Market Revenue Million Forecast, by Food Additives 2019 & 2032
- Table 104: Global Speciality Chemicals Market Revenue Million Forecast, by Agrochemicals 2019 & 2032
- Table 105: Global Speciality Chemicals Market Revenue Million Forecast, by Industrial and Institutional Cleaners 2019 & 2032
- Table 106: Global Speciality Chemicals Market Revenue Million Forecast, by Lubricant Additives 2019 & 2032
- Table 107: Global Speciality Chemicals Market Revenue Million Forecast, by Mining Chemicals 2019 & 2032
- Table 108: Global Speciality Chemicals Market Revenue Million Forecast, by Oilfield Chemicals 2019 & 2032
- Table 109: Global Speciality Chemicals Market Revenue Million Forecast, by Adhesives and Sealants 2019 & 2032
- Table 110: Global Speciality Chemicals Market Revenue Million Forecast, by Plastic Additives 2019 & 2032
- Table 111: Global Speciality Chemicals Market Revenue Million Forecast, by Rubber Processing Chemicals 2019 & 2032
- Table 112: Global Speciality Chemicals Market Revenue Million Forecast, by Specialty Polymers 2019 & 2032
- Table 113: Global Speciality Chemicals Market Revenue Million Forecast, by Textile Chemicals 2019 & 2032
- Table 114: Global Speciality Chemicals Market Revenue Million Forecast, by Country 2019 & 2032
- Table 115: Germany Speciality Chemicals Market Revenue (Million) Forecast, by Application 2019 & 2032
- Table 116: United Kingdom Speciality Chemicals Market Revenue (Million) Forecast, by Application 2019 & 2032
- Table 117: Italy Speciality Chemicals Market Revenue (Million) Forecast, by Application 2019 & 2032
- Table 118: France Speciality Chemicals Market Revenue (Million) Forecast, by Application 2019 & 2032
- Table 119: Spain Speciality Chemicals Market Revenue (Million) Forecast, by Application 2019 & 2032
- Table 120: Rest of Europe Speciality Chemicals Market Revenue (Million) Forecast, by Application 2019 & 2032
- Table 121: Global Speciality Chemicals Market Revenue Million Forecast, by Paints and Coatings 2019 & 2032
- Table 122: Global Speciality Chemicals Market Revenue Million Forecast, by Catalysts 2019 & 2032
- Table 123: Global Speciality Chemicals Market Revenue Million Forecast, by Construction Chemicals 2019 & 2032
- Table 124: Global Speciality Chemicals Market Revenue Million Forecast, by Cosmetic Chemicals 2019 & 2032
- Table 125: Global Speciality Chemicals Market Revenue Million Forecast, by Dyes, Inks, and Pigments 2019 & 2032
- Table 126: Global Speciality Chemicals Market Revenue Million Forecast, by Electronic Chemicals 2019 & 2032
- Table 127: Global Speciality Chemicals Market Revenue Million Forecast, by Water Treatment Chemicals 2019 & 2032
- Table 128: Global Speciality Chemicals Market Revenue Million Forecast, by Food Additives 2019 & 2032
- Table 129: Global Speciality Chemicals Market Revenue Million Forecast, by Agrochemicals 2019 & 2032
- Table 130: Global Speciality Chemicals Market Revenue Million Forecast, by Industrial and Institutional Cleaners 2019 & 2032
- Table 131: Global Speciality Chemicals Market Revenue Million Forecast, by Lubricant Additives 2019 & 2032
- Table 132: Global Speciality Chemicals Market Revenue Million Forecast, by Mining Chemicals 2019 & 2032
- Table 133: Global Speciality Chemicals Market Revenue Million Forecast, by Oilfield Chemicals 2019 & 2032
- Table 134: Global Speciality Chemicals Market Revenue Million Forecast, by Adhesives and Sealants 2019 & 2032
- Table 135: Global Speciality Chemicals Market Revenue Million Forecast, by Plastic Additives 2019 & 2032
- Table 136: Global Speciality Chemicals Market Revenue Million Forecast, by Rubber Processing Chemicals 2019 & 2032
- Table 137: Global Speciality Chemicals Market Revenue Million Forecast, by Specialty Polymers 2019 & 2032
- Table 138: Global Speciality Chemicals Market Revenue Million Forecast, by Textile Chemicals 2019 & 2032
- Table 139: Global Speciality Chemicals Market Revenue Million Forecast, by Country 2019 & 2032
- Table 140: Brazil Speciality Chemicals Market Revenue (Million) Forecast, by Application 2019 & 2032
- Table 141: Argentina Speciality Chemicals Market Revenue (Million) Forecast, by Application 2019 & 2032
- Table 142: Rest of South America Speciality Chemicals Market Revenue (Million) Forecast, by Application 2019 & 2032
- Table 143: Global Speciality Chemicals Market Revenue Million Forecast, by Paints and Coatings 2019 & 2032
- Table 144: Global Speciality Chemicals Market Revenue Million Forecast, by Catalysts 2019 & 2032
- Table 145: Global Speciality Chemicals Market Revenue Million Forecast, by Construction Chemicals 2019 & 2032
- Table 146: Global Speciality Chemicals Market Revenue Million Forecast, by Cosmetic Chemicals 2019 & 2032
- Table 147: Global Speciality Chemicals Market Revenue Million Forecast, by Dyes, Inks, and Pigments 2019 & 2032
- Table 148: Global Speciality Chemicals Market Revenue Million Forecast, by Electronic Chemicals 2019 & 2032
- Table 149: Global Speciality Chemicals Market Revenue Million Forecast, by Water Treatment Chemicals 2019 & 2032
- Table 150: Global Speciality Chemicals Market Revenue Million Forecast, by Food Additives 2019 & 2032
- Table 151: Global Speciality Chemicals Market Revenue Million Forecast, by Agrochemicals 2019 & 2032
- Table 152: Global Speciality Chemicals Market Revenue Million Forecast, by Industrial and Institutional Cleaners 2019 & 2032
- Table 153: Global Speciality Chemicals Market Revenue Million Forecast, by Lubricant Additives 2019 & 2032
- Table 154: Global Speciality Chemicals Market Revenue Million Forecast, by Mining Chemicals 2019 & 2032
- Table 155: Global Speciality Chemicals Market Revenue Million Forecast, by Oilfield Chemicals 2019 & 2032
- Table 156: Global Speciality Chemicals Market Revenue Million Forecast, by Adhesives and Sealants 2019 & 2032
- Table 157: Global Speciality Chemicals Market Revenue Million Forecast, by Plastic Additives 2019 & 2032
- Table 158: Global Speciality Chemicals Market Revenue Million Forecast, by Rubber Processing Chemicals 2019 & 2032
- Table 159: Global Speciality Chemicals Market Revenue Million Forecast, by Specialty Polymers 2019 & 2032
- Table 160: Global Speciality Chemicals Market Revenue Million Forecast, by Textile Chemicals 2019 & 2032
- Table 161: Global Speciality Chemicals Market Revenue Million Forecast, by Country 2019 & 2032
- Table 162: Saudi Arabia Speciality Chemicals Market Revenue (Million) Forecast, by Application 2019 & 2032
- Table 163: South Africa Speciality Chemicals Market Revenue (Million) Forecast, by Application 2019 & 2032
- Table 164: Rest of Middle East and Africa Speciality Chemicals Market Revenue (Million) Forecast, by Application 2019 & 2032
Frequently Asked Questions
1. What is the projected Compound Annual Growth Rate (CAGR) of the Speciality Chemicals Market?
The projected CAGR is approximately 3.31%.
2. Which companies are prominent players in the Speciality Chemicals Market?
Key companies in the market include Ferro Corporation, Infineum International Limited, Henkel AG & Co KGaA, DIC Corporation, Corteva, Clariant, Ecolab, GCP Applied Technologies Inc, Holcim, Nouryon.
3. What are the main segments of the Speciality Chemicals Market?
The market segments include Paints and Coatings, Catalysts, Construction Chemicals, Cosmetic Chemicals, Dyes, Inks, and Pigments, Electronic Chemicals, Water Treatment Chemicals, Food Additives, Agrochemicals, Industrial and Institutional Cleaners, Lubricant Additives, Mining Chemicals, Oilfield Chemicals, Adhesives and Sealants, Plastic Additives, Rubber Processing Chemicals, Specialty Polymers, Textile Chemicals.
4. Can you provide details about the market size?
The market size is estimated to be USD 1.07 Million as of 2022.
5. What are some drivers contributing to market growth?
Robust Growth of Construction Activities in Asia-Pacific. and Middle East and Africa; Growing Population is Propelling the Demand for Food Worldwide.
6. What are the notable trends driving market growth?
Agrochemicals Segment to Dominate the Market Demand.
7. Are there any restraints impacting market growth?
Low Resistance to Extreme Weather Conditions; Rising Global Regulations on its Usage.
8. Can you provide examples of recent developments in the market?
December 2022: Clariant AG announced to strengthen its position in China and expand its care chemicals facility in the country, including pharmaceutical, personal care, home care, and industrial applications. The company provides care chemicals under its specialty segment.
9. What pricing options are available for accessing the report?
Pricing options include single-user, multi-user, and enterprise licenses priced at USD 4750, USD 5250, and USD 8750 respectively.
10. Is the market size provided in terms of value or volume?
The market size is provided in terms of value, measured in Million.
11. Are there any specific market keywords associated with the report?
Yes, the market keyword associated with the report is "Speciality Chemicals Market," which aids in identifying and referencing the specific market segment covered.
12. How do I determine which pricing option suits my needs best?
The pricing options vary based on user requirements and access needs. Individual users may opt for single-user licenses, while businesses requiring broader access may choose multi-user or enterprise licenses for cost-effective access to the report.
13. Are there any additional resources or data provided in the Speciality Chemicals Market report?
While the report offers comprehensive insights, it's advisable to review the specific contents or supplementary materials provided to ascertain if additional resources or data are available.
14. How can I stay updated on further developments or reports in the Speciality Chemicals Market?
To stay informed about further developments, trends, and reports in the Speciality Chemicals Market, consider subscribing to industry newsletters, following relevant companies and organizations, or regularly checking reputable industry news sources and publications.
Methodology
Step 1 - Identification of Relevant Samples Size from Population Database


Step 2 - Approaches for Defining Global Market Size (Value, Volume* & Price*)

Note*: In applicable scenarios
Step 3 - Data Sources
Primary Research
- Web Analytics
- Survey Reports
- Research Institute
- Latest Research Reports
- Opinion Leaders
Secondary Research
- Annual Reports
- White Paper
- Latest Press Release
- Industry Association
- Paid Database
- Investor Presentations

Step 4 - Data Triangulation
Involves using different sources of information in order to increase the validity of a study
These sources are likely to be stakeholders in a program - participants, other researchers, program staff, other community members, and so on.
Then we put all data in single framework & apply various statistical tools to find out the dynamic on the market.
During the analysis stage, feedback from the stakeholder groups would be compared to determine areas of agreement as well as areas of divergence


