

Key Insights
The global spinal cord electrophysiology monitor market is poised for significant expansion, propelled by the escalating prevalence of neurological disorders necessitating accurate diagnostic evaluations. Innovations in developing compact, portable, and intuitive devices are key growth drivers. Increased healthcare professional awareness regarding the advantages of electrophysiology monitoring in diagnosing and managing spinal cord injuries is further stimulating demand. The market is segmented by device type, including electromyography (EMG) and evoked potential (EP) monitors, application areas such as spinal cord injury diagnosis, nerve disorders, and neuromuscular diseases, and end-users like hospitals, clinics, and research institutions. Despite potential challenges posed by the high cost of equipment and procedures, the long-term benefits of improved patient outcomes and reduced healthcare expenditures through early, precise diagnosis are expected to outweigh initial investments, fostering market growth, particularly in regions with established healthcare infrastructure.
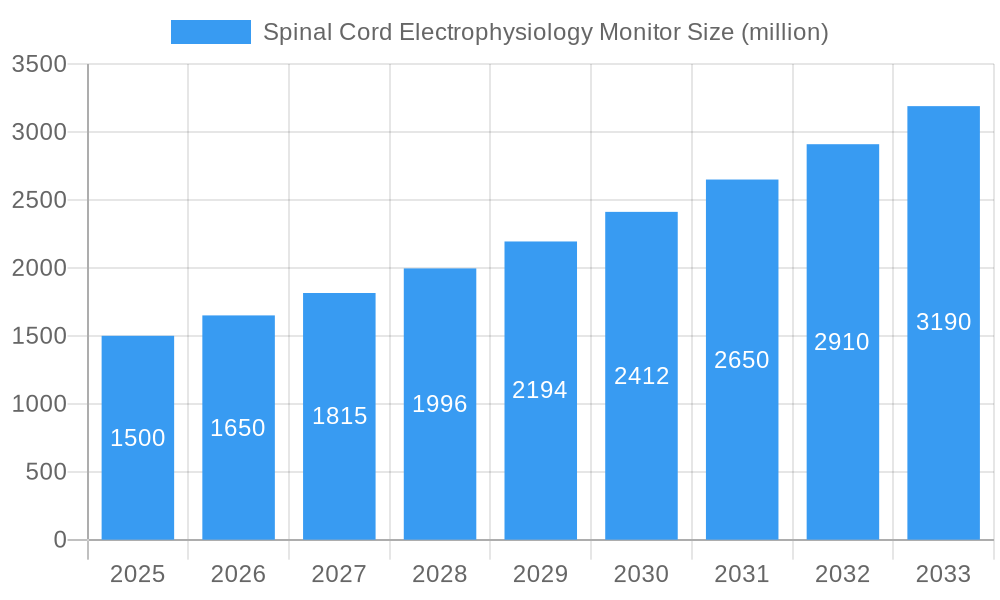
Spinal Cord Electrophysiology Monitor Market Size (In Billion)
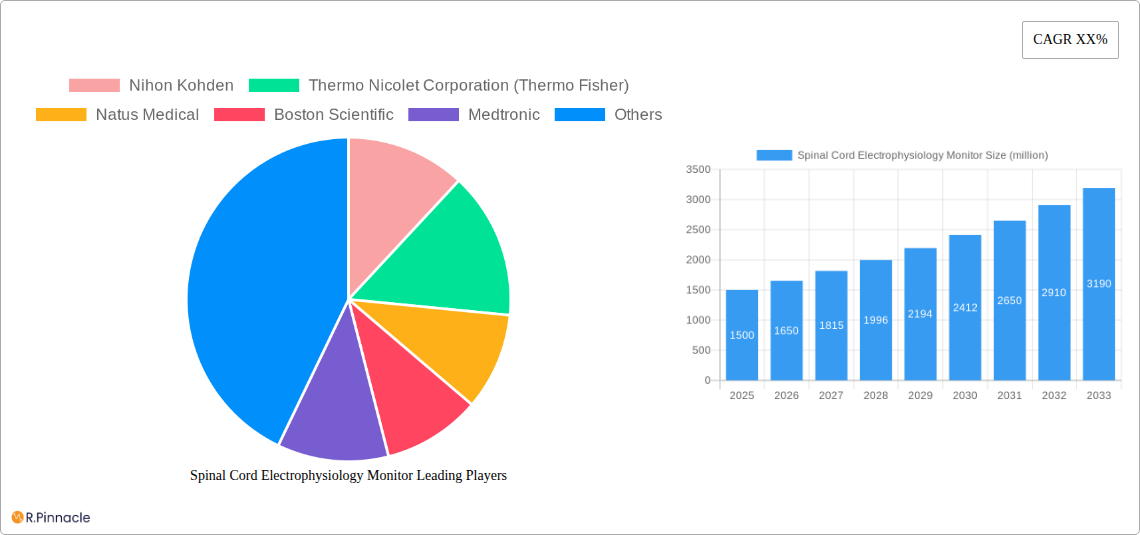
The competitive environment is characterized by robust activity, with leading companies such as Nihon Kohden, Thermo Fisher Scientific, Natus Medical, Boston Scientific, Medtronic, NuVasive, Nipro, and Cadwell actively engaging in research and development to launch novel products and enhance their market positions. Strategic alliances, mergers, and acquisitions are also anticipated to redefine the competitive dynamics in the foreseeable future. The forecast period (2025-2033) predicts consistent growth, influenced by an aging global population, a rising incidence of neurological diseases, and ongoing advancements in monitoring technologies. Emerging economies are expected to witness substantial market growth, attributed to escalating healthcare spending and growing adoption of sophisticated diagnostic methods. Regulatory approvals and reimbursement frameworks will be pivotal in shaping market trajectories across diverse geographical areas.
Spinal Cord Electrophysiology Monitor Company Market Share
Market Size: $3.65 billion
CAGR: 5.46%
Base Year: 2025
Spinal Cord Electrophysiology Monitor Market Report: 2019-2033
This comprehensive report provides an in-depth analysis of the global Spinal Cord Electrophysiology Monitor market, offering invaluable insights for industry professionals, investors, and researchers. Covering the period from 2019 to 2033, with a focus on the 2025-2033 forecast, this report unveils market dynamics, technological advancements, competitive landscapes, and future growth prospects. The market is projected to reach xx million by 2033, exhibiting a CAGR of xx% during the forecast period.
Spinal Cord Electrophysiology Monitor Market Structure & Innovation Trends
The global spinal cord electrophysiology monitor market exhibits a moderately concentrated structure, with key players like Nihon Kohden, Thermo Fisher Scientific (Thermo Nicolet Corporation), Natus Medical, Boston Scientific, Medtronic, NuVasive, Nipro, and Cadwell holding significant market share. Market share distribution is estimated to be as follows in 2025: Thermo Fisher Scientific (xx%), Nihon Kohden (xx%), Medtronic (xx%), Natus Medical (xx%), with the remaining share distributed amongst other players. Innovation is driven primarily by the need for improved accuracy, portability, and ease of use in clinical settings. Regulatory frameworks, such as those set by the FDA and similar international bodies, significantly influence product development and market access. Substitutes for spinal cord electrophysiology monitors are limited, primarily involving alternative neurological diagnostic techniques. The market witnesses continuous mergers and acquisitions (M&A) activities, with deal values exceeding xx million in the past five years, primarily driven by expansion strategies and technological integration.
- Market Concentration: Moderately concentrated
- Innovation Drivers: Improved accuracy, portability, ease of use
- Regulatory Frameworks: FDA, international equivalents
- M&A Activities: Deal values exceeding xx million in the last five years
Spinal Cord Electrophysiology Monitor Market Dynamics & Trends
The spinal cord electrophysiology monitor market is experiencing robust growth, driven by several factors. The increasing prevalence of neurological disorders, rising demand for advanced diagnostic tools, technological advancements leading to improved device performance and miniaturization, and a growing preference for minimally invasive procedures are key growth catalysts. Technological disruptions, such as the integration of artificial intelligence (AI) and machine learning (ML) algorithms for enhanced data analysis and interpretation, are reshaping the market landscape. The market penetration rate is steadily increasing, particularly in developed regions with advanced healthcare infrastructure. Competitive dynamics are characterized by ongoing product innovation, strategic partnerships, and expansion into emerging markets. The market is expected to witness significant growth, with an estimated CAGR of xx% during the forecast period.
Dominant Regions & Segments in Spinal Cord Electrophysiology Monitor
The North American region holds the dominant position in the spinal cord electrophysiology monitor market, primarily due to high healthcare expenditure, advanced healthcare infrastructure, and a large patient pool.
- Key Drivers in North America:
- High healthcare expenditure
- Advanced healthcare infrastructure
- Strong presence of key players
- Favorable regulatory environment
- High prevalence of neurological disorders
Europe follows as a significant market, driven by factors such as increasing healthcare investments and a growing awareness of neurological disorders. Asia-Pacific is an emerging market with substantial growth potential due to the rising prevalence of neurological diseases, increasing disposable incomes, and improving healthcare infrastructure. Detailed dominance analysis shows a clear trend towards greater market penetration within developed regions and a gradual increase in adoption in developing regions.
Spinal Cord Electrophysiology Monitor Product Innovations
Recent product innovations focus on enhancing the accuracy, portability, and user-friendliness of spinal cord electrophysiology monitors. Integration of advanced signal processing techniques, wireless connectivity, and user-friendly interfaces are key trends. These innovations offer improved diagnostic capabilities, reduced procedural time, and enhanced patient comfort, leading to increased market acceptance and improved competitive advantages. The emphasis is on creating devices that are smaller, more efficient, and provide more accurate results.
Report Scope & Segmentation Analysis
This report segments the spinal cord electrophysiology monitor market based on various parameters, including product type (e.g., surface EMG, needle EMG), application (e.g., diagnosis, monitoring), end-user (hospitals, ambulatory surgery centers), and geography. Each segment's growth projections, market size, and competitive landscape are analyzed individually. For example, the surface EMG segment is projected to grow at xx% CAGR during the forecast period due to its ease of use and widespread adoption. Similarly, the hospital segment is expected to maintain its dominance.
Key Drivers of Spinal Cord Electrophysiology Monitor Growth
Technological advancements, the rising prevalence of neurological disorders, and increased healthcare spending are the primary growth drivers. The development of more portable and user-friendly devices, along with improved diagnostic accuracy, is fueling market expansion. Government initiatives promoting advanced healthcare infrastructure and supportive regulatory policies are also contributing significantly to market growth.
Challenges in the Spinal Cord Electrophysiology Monitor Sector
The spinal cord electrophysiology monitor sector faces several challenges, including high device costs, stringent regulatory approvals, and the need for skilled professionals for operation and interpretation. Supply chain disruptions can impact production and availability. Intense competition among established players also creates pricing pressures. These factors together limit market penetration, particularly in price-sensitive regions.
Emerging Opportunities in Spinal Cord Electrophysiology Monitor
Emerging opportunities lie in the development of AI-powered diagnostic tools, expansion into untapped markets, and the integration of these monitors into personalized medicine approaches. The growing demand for minimally invasive procedures and telemedicine creates further opportunities for innovation and market expansion.
Leading Players in the Spinal Cord Electrophysiology Monitor Market
Key Developments in Spinal Cord Electrophysiology Monitor Industry
- 2022 Q3: Thermo Fisher Scientific launched a new generation of spinal cord electrophysiology monitor with enhanced AI capabilities.
- 2023 Q1: Medtronic acquired a smaller competitor, expanding its market share.
- 2024 Q2: Nihon Kohden secured FDA approval for a novel spinal cord monitoring technology. (Further details on specific development dates and impacts would be included in the full report)
Future Outlook for Spinal Cord Electrophysiology Monitor Market
The future outlook for the spinal cord electrophysiology monitor market remains positive, driven by continuous technological advancements, increasing prevalence of neurological disorders, and growing healthcare expenditure. Strategic partnerships, product innovation, and expansion into emerging markets will be key factors shaping future market growth and creating significant opportunities for market players.
Spinal Cord Electrophysiology Monitor Segmentation
-
1. Application
- 1.1. Hospital
- 1.2. Clinic
-
2. Types
- 2.1. Intraoperative Use
- 2.2. Postoperative Use
Spinal Cord Electrophysiology Monitor Segmentation By Geography
-
1. North America
- 1.1. United States
- 1.2. Canada
- 1.3. Mexico
-
2. South America
- 2.1. Brazil
- 2.2. Argentina
- 2.3. Rest of South America
-
3. Europe
- 3.1. United Kingdom
- 3.2. Germany
- 3.3. France
- 3.4. Italy
- 3.5. Spain
- 3.6. Russia
- 3.7. Benelux
- 3.8. Nordics
- 3.9. Rest of Europe
-
4. Middle East & Africa
- 4.1. Turkey
- 4.2. Israel
- 4.3. GCC
- 4.4. North Africa
- 4.5. South Africa
- 4.6. Rest of Middle East & Africa
-
5. Asia Pacific
- 5.1. China
- 5.2. India
- 5.3. Japan
- 5.4. South Korea
- 5.5. ASEAN
- 5.6. Oceania
- 5.7. Rest of Asia Pacific
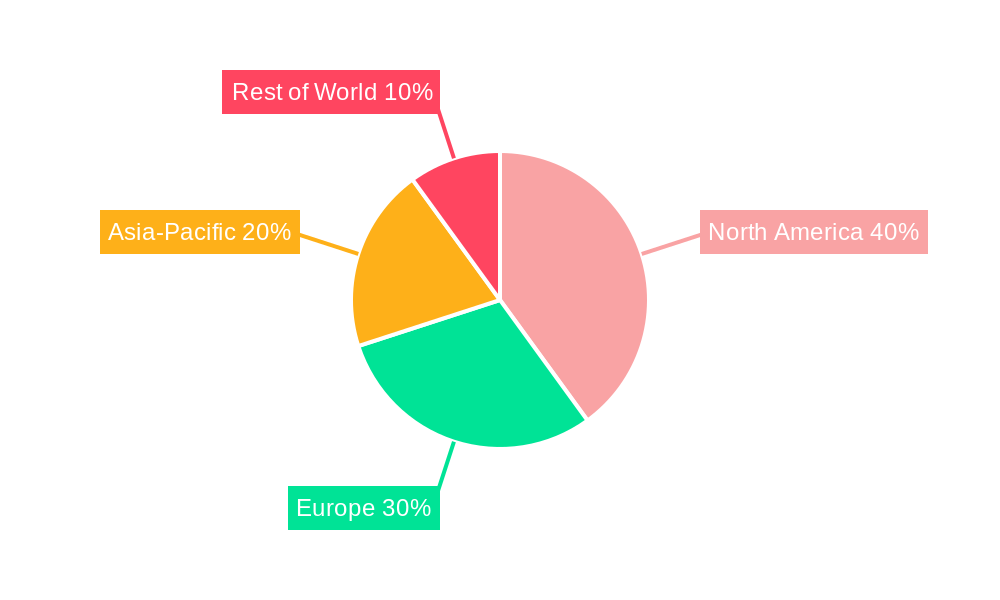
Spinal Cord Electrophysiology Monitor Regional Market Share
Geographic Coverage of Spinal Cord Electrophysiology Monitor
Spinal Cord Electrophysiology Monitor REPORT HIGHLIGHTS
| Aspects | Details |
|---|---|
| Study Period | 2020-2034 |
| Base Year | 2025 |
| Estimated Year | 2026 |
| Forecast Period | 2026-2034 |
| Historical Period | 2020-2025 |
| Growth Rate | CAGR of 5.46% from 2020-2034 |
| Segmentation |
|
Table of Contents
- 1. Introduction
- 1.1. Research Scope
- 1.2. Market Segmentation
- 1.3. Research Objective
- 1.4. Definitions and Assumptions
- 2. Executive Summary
- 2.1. Market Snapshot
- 3. Market Dynamics
- 3.1. Market Drivers
- 3.2. Market Restrains
- 3.3. Market Trends
- 3.4. Market Opportunities
- 4. Market Factor Analysis
- 4.1. Porters Five Forces
- 4.1.1. Bargaining Power of Suppliers
- 4.1.2. Bargaining Power of Buyers
- 4.1.3. Threat of New Entrants
- 4.1.4. Threat of Substitutes
- 4.1.5. Competitive Rivalry
- 4.2. PESTEL analysis
- 4.3. BCG Analysis
- 4.3.1. Stars (High Growth, High Market Share)
- 4.3.2. Cash Cows (Low Growth, High Market Share)
- 4.3.3. Question Mark (High Growth, Low Market Share)
- 4.3.4. Dogs (Low Growth, Low Market Share)
- 4.4. Ansoff Matrix Analysis
- 4.5. Supply Chain Analysis
- 4.6. Regulatory Landscape
- 4.7. Current Market Potential and Opportunity Assessment (TAM–SAM–SOM Framework)
- 4.8. PRI Analyst Note
- 4.1. Porters Five Forces
- 5. Market Analysis, Insights and Forecast 2021-2033
- 5.1. Market Analysis, Insights and Forecast - by Application
- 5.1.1. Hospital
- 5.1.2. Clinic
- 5.2. Market Analysis, Insights and Forecast - by Types
- 5.2.1. Intraoperative Use
- 5.2.2. Postoperative Use
- 5.3. Market Analysis, Insights and Forecast - by Region
- 5.3.1. North America
- 5.3.2. South America
- 5.3.3. Europe
- 5.3.4. Middle East & Africa
- 5.3.5. Asia Pacific
- 5.1. Market Analysis, Insights and Forecast - by Application
- 6. Global Spinal Cord Electrophysiology Monitor Analysis, Insights and Forecast, 2021-2033
- 6.1. Market Analysis, Insights and Forecast - by Application
- 6.1.1. Hospital
- 6.1.2. Clinic
- 6.2. Market Analysis, Insights and Forecast - by Types
- 6.2.1. Intraoperative Use
- 6.2.2. Postoperative Use
- 6.1. Market Analysis, Insights and Forecast - by Application
- 7. North America Spinal Cord Electrophysiology Monitor Analysis, Insights and Forecast, 2020-2032
- 7.1. Market Analysis, Insights and Forecast - by Application
- 7.1.1. Hospital
- 7.1.2. Clinic
- 7.2. Market Analysis, Insights and Forecast - by Types
- 7.2.1. Intraoperative Use
- 7.2.2. Postoperative Use
- 7.1. Market Analysis, Insights and Forecast - by Application
- 8. South America Spinal Cord Electrophysiology Monitor Analysis, Insights and Forecast, 2020-2032
- 8.1. Market Analysis, Insights and Forecast - by Application
- 8.1.1. Hospital
- 8.1.2. Clinic
- 8.2. Market Analysis, Insights and Forecast - by Types
- 8.2.1. Intraoperative Use
- 8.2.2. Postoperative Use
- 8.1. Market Analysis, Insights and Forecast - by Application
- 9. Europe Spinal Cord Electrophysiology Monitor Analysis, Insights and Forecast, 2020-2032
- 9.1. Market Analysis, Insights and Forecast - by Application
- 9.1.1. Hospital
- 9.1.2. Clinic
- 9.2. Market Analysis, Insights and Forecast - by Types
- 9.2.1. Intraoperative Use
- 9.2.2. Postoperative Use
- 9.1. Market Analysis, Insights and Forecast - by Application
- 10. Middle East & Africa Spinal Cord Electrophysiology Monitor Analysis, Insights and Forecast, 2020-2032
- 10.1. Market Analysis, Insights and Forecast - by Application
- 10.1.1. Hospital
- 10.1.2. Clinic
- 10.2. Market Analysis, Insights and Forecast - by Types
- 10.2.1. Intraoperative Use
- 10.2.2. Postoperative Use
- 10.1. Market Analysis, Insights and Forecast - by Application
- 11. Asia Pacific Spinal Cord Electrophysiology Monitor Analysis, Insights and Forecast, 2020-2032
- 11.1. Market Analysis, Insights and Forecast - by Application
- 11.1.1. Hospital
- 11.1.2. Clinic
- 11.2. Market Analysis, Insights and Forecast - by Types
- 11.2.1. Intraoperative Use
- 11.2.2. Postoperative Use
- 11.1. Market Analysis, Insights and Forecast - by Application
- 12. Competitive Analysis
- 12.1. Company Profiles
- 12.1.1 Nihon Kohden
- 12.1.1.1. Company Overview
- 12.1.1.2. Products
- 12.1.1.3. Company Financials
- 12.1.1.4. SWOT Analysis
- 12.1.2 Thermo Nicolet Corporation (Thermo Fisher)
- 12.1.2.1. Company Overview
- 12.1.2.2. Products
- 12.1.2.3. Company Financials
- 12.1.2.4. SWOT Analysis
- 12.1.3 Natus Medical
- 12.1.3.1. Company Overview
- 12.1.3.2. Products
- 12.1.3.3. Company Financials
- 12.1.3.4. SWOT Analysis
- 12.1.4 Boston Scientific
- 12.1.4.1. Company Overview
- 12.1.4.2. Products
- 12.1.4.3. Company Financials
- 12.1.4.4. SWOT Analysis
- 12.1.5 Medtronic
- 12.1.5.1. Company Overview
- 12.1.5.2. Products
- 12.1.5.3. Company Financials
- 12.1.5.4. SWOT Analysis
- 12.1.6 NuVasive
- 12.1.6.1. Company Overview
- 12.1.6.2. Products
- 12.1.6.3. Company Financials
- 12.1.6.4. SWOT Analysis
- 12.1.7 Nipro
- 12.1.7.1. Company Overview
- 12.1.7.2. Products
- 12.1.7.3. Company Financials
- 12.1.7.4. SWOT Analysis
- 12.1.8 Cadwell
- 12.1.8.1. Company Overview
- 12.1.8.2. Products
- 12.1.8.3. Company Financials
- 12.1.8.4. SWOT Analysis
- 12.1.1 Nihon Kohden
- 12.2. Market Entropy
- 12.2.1 Company's Key Areas Served
- 12.2.2 Recent Developments
- 12.3. Company Market Share Analysis 2025
- 12.3.1 Top 5 Companies Market Share Analysis
- 12.3.2 Top 3 Companies Market Share Analysis
- 12.4. List of Potential Customers
- 13. Research Methodology
List of Figures
- Figure 1: Global Spinal Cord Electrophysiology Monitor Revenue Breakdown (billion, %) by Region 2025 & 2033
- Figure 2: Global Spinal Cord Electrophysiology Monitor Volume Breakdown (K, %) by Region 2025 & 2033
- Figure 3: North America Spinal Cord Electrophysiology Monitor Revenue (billion), by Application 2025 & 2033
- Figure 4: North America Spinal Cord Electrophysiology Monitor Volume (K), by Application 2025 & 2033
- Figure 5: North America Spinal Cord Electrophysiology Monitor Revenue Share (%), by Application 2025 & 2033
- Figure 6: North America Spinal Cord Electrophysiology Monitor Volume Share (%), by Application 2025 & 2033
- Figure 7: North America Spinal Cord Electrophysiology Monitor Revenue (billion), by Types 2025 & 2033
- Figure 8: North America Spinal Cord Electrophysiology Monitor Volume (K), by Types 2025 & 2033
- Figure 9: North America Spinal Cord Electrophysiology Monitor Revenue Share (%), by Types 2025 & 2033
- Figure 10: North America Spinal Cord Electrophysiology Monitor Volume Share (%), by Types 2025 & 2033
- Figure 11: North America Spinal Cord Electrophysiology Monitor Revenue (billion), by Country 2025 & 2033
- Figure 12: North America Spinal Cord Electrophysiology Monitor Volume (K), by Country 2025 & 2033
- Figure 13: North America Spinal Cord Electrophysiology Monitor Revenue Share (%), by Country 2025 & 2033
- Figure 14: North America Spinal Cord Electrophysiology Monitor Volume Share (%), by Country 2025 & 2033
- Figure 15: South America Spinal Cord Electrophysiology Monitor Revenue (billion), by Application 2025 & 2033
- Figure 16: South America Spinal Cord Electrophysiology Monitor Volume (K), by Application 2025 & 2033
- Figure 17: South America Spinal Cord Electrophysiology Monitor Revenue Share (%), by Application 2025 & 2033
- Figure 18: South America Spinal Cord Electrophysiology Monitor Volume Share (%), by Application 2025 & 2033
- Figure 19: South America Spinal Cord Electrophysiology Monitor Revenue (billion), by Types 2025 & 2033
- Figure 20: South America Spinal Cord Electrophysiology Monitor Volume (K), by Types 2025 & 2033
- Figure 21: South America Spinal Cord Electrophysiology Monitor Revenue Share (%), by Types 2025 & 2033
- Figure 22: South America Spinal Cord Electrophysiology Monitor Volume Share (%), by Types 2025 & 2033
- Figure 23: South America Spinal Cord Electrophysiology Monitor Revenue (billion), by Country 2025 & 2033
- Figure 24: South America Spinal Cord Electrophysiology Monitor Volume (K), by Country 2025 & 2033
- Figure 25: South America Spinal Cord Electrophysiology Monitor Revenue Share (%), by Country 2025 & 2033
- Figure 26: South America Spinal Cord Electrophysiology Monitor Volume Share (%), by Country 2025 & 2033
- Figure 27: Europe Spinal Cord Electrophysiology Monitor Revenue (billion), by Application 2025 & 2033
- Figure 28: Europe Spinal Cord Electrophysiology Monitor Volume (K), by Application 2025 & 2033
- Figure 29: Europe Spinal Cord Electrophysiology Monitor Revenue Share (%), by Application 2025 & 2033
- Figure 30: Europe Spinal Cord Electrophysiology Monitor Volume Share (%), by Application 2025 & 2033
- Figure 31: Europe Spinal Cord Electrophysiology Monitor Revenue (billion), by Types 2025 & 2033
- Figure 32: Europe Spinal Cord Electrophysiology Monitor Volume (K), by Types 2025 & 2033
- Figure 33: Europe Spinal Cord Electrophysiology Monitor Revenue Share (%), by Types 2025 & 2033
- Figure 34: Europe Spinal Cord Electrophysiology Monitor Volume Share (%), by Types 2025 & 2033
- Figure 35: Europe Spinal Cord Electrophysiology Monitor Revenue (billion), by Country 2025 & 2033
- Figure 36: Europe Spinal Cord Electrophysiology Monitor Volume (K), by Country 2025 & 2033
- Figure 37: Europe Spinal Cord Electrophysiology Monitor Revenue Share (%), by Country 2025 & 2033
- Figure 38: Europe Spinal Cord Electrophysiology Monitor Volume Share (%), by Country 2025 & 2033
- Figure 39: Middle East & Africa Spinal Cord Electrophysiology Monitor Revenue (billion), by Application 2025 & 2033
- Figure 40: Middle East & Africa Spinal Cord Electrophysiology Monitor Volume (K), by Application 2025 & 2033
- Figure 41: Middle East & Africa Spinal Cord Electrophysiology Monitor Revenue Share (%), by Application 2025 & 2033
- Figure 42: Middle East & Africa Spinal Cord Electrophysiology Monitor Volume Share (%), by Application 2025 & 2033
- Figure 43: Middle East & Africa Spinal Cord Electrophysiology Monitor Revenue (billion), by Types 2025 & 2033
- Figure 44: Middle East & Africa Spinal Cord Electrophysiology Monitor Volume (K), by Types 2025 & 2033
- Figure 45: Middle East & Africa Spinal Cord Electrophysiology Monitor Revenue Share (%), by Types 2025 & 2033
- Figure 46: Middle East & Africa Spinal Cord Electrophysiology Monitor Volume Share (%), by Types 2025 & 2033
- Figure 47: Middle East & Africa Spinal Cord Electrophysiology Monitor Revenue (billion), by Country 2025 & 2033
- Figure 48: Middle East & Africa Spinal Cord Electrophysiology Monitor Volume (K), by Country 2025 & 2033
- Figure 49: Middle East & Africa Spinal Cord Electrophysiology Monitor Revenue Share (%), by Country 2025 & 2033
- Figure 50: Middle East & Africa Spinal Cord Electrophysiology Monitor Volume Share (%), by Country 2025 & 2033
- Figure 51: Asia Pacific Spinal Cord Electrophysiology Monitor Revenue (billion), by Application 2025 & 2033
- Figure 52: Asia Pacific Spinal Cord Electrophysiology Monitor Volume (K), by Application 2025 & 2033
- Figure 53: Asia Pacific Spinal Cord Electrophysiology Monitor Revenue Share (%), by Application 2025 & 2033
- Figure 54: Asia Pacific Spinal Cord Electrophysiology Monitor Volume Share (%), by Application 2025 & 2033
- Figure 55: Asia Pacific Spinal Cord Electrophysiology Monitor Revenue (billion), by Types 2025 & 2033
- Figure 56: Asia Pacific Spinal Cord Electrophysiology Monitor Volume (K), by Types 2025 & 2033
- Figure 57: Asia Pacific Spinal Cord Electrophysiology Monitor Revenue Share (%), by Types 2025 & 2033
- Figure 58: Asia Pacific Spinal Cord Electrophysiology Monitor Volume Share (%), by Types 2025 & 2033
- Figure 59: Asia Pacific Spinal Cord Electrophysiology Monitor Revenue (billion), by Country 2025 & 2033
- Figure 60: Asia Pacific Spinal Cord Electrophysiology Monitor Volume (K), by Country 2025 & 2033
- Figure 61: Asia Pacific Spinal Cord Electrophysiology Monitor Revenue Share (%), by Country 2025 & 2033
- Figure 62: Asia Pacific Spinal Cord Electrophysiology Monitor Volume Share (%), by Country 2025 & 2033
List of Tables
- Table 1: Global Spinal Cord Electrophysiology Monitor Revenue billion Forecast, by Application 2020 & 2033
- Table 2: Global Spinal Cord Electrophysiology Monitor Volume K Forecast, by Application 2020 & 2033
- Table 3: Global Spinal Cord Electrophysiology Monitor Revenue billion Forecast, by Types 2020 & 2033
- Table 4: Global Spinal Cord Electrophysiology Monitor Volume K Forecast, by Types 2020 & 2033
- Table 5: Global Spinal Cord Electrophysiology Monitor Revenue billion Forecast, by Region 2020 & 2033
- Table 6: Global Spinal Cord Electrophysiology Monitor Volume K Forecast, by Region 2020 & 2033
- Table 7: Global Spinal Cord Electrophysiology Monitor Revenue billion Forecast, by Application 2020 & 2033
- Table 8: Global Spinal Cord Electrophysiology Monitor Volume K Forecast, by Application 2020 & 2033
- Table 9: Global Spinal Cord Electrophysiology Monitor Revenue billion Forecast, by Types 2020 & 2033
- Table 10: Global Spinal Cord Electrophysiology Monitor Volume K Forecast, by Types 2020 & 2033
- Table 11: Global Spinal Cord Electrophysiology Monitor Revenue billion Forecast, by Country 2020 & 2033
- Table 12: Global Spinal Cord Electrophysiology Monitor Volume K Forecast, by Country 2020 & 2033
- Table 13: United States Spinal Cord Electrophysiology Monitor Revenue (billion) Forecast, by Application 2020 & 2033
- Table 14: United States Spinal Cord Electrophysiology Monitor Volume (K) Forecast, by Application 2020 & 2033
- Table 15: Canada Spinal Cord Electrophysiology Monitor Revenue (billion) Forecast, by Application 2020 & 2033
- Table 16: Canada Spinal Cord Electrophysiology Monitor Volume (K) Forecast, by Application 2020 & 2033
- Table 17: Mexico Spinal Cord Electrophysiology Monitor Revenue (billion) Forecast, by Application 2020 & 2033
- Table 18: Mexico Spinal Cord Electrophysiology Monitor Volume (K) Forecast, by Application 2020 & 2033
- Table 19: Global Spinal Cord Electrophysiology Monitor Revenue billion Forecast, by Application 2020 & 2033
- Table 20: Global Spinal Cord Electrophysiology Monitor Volume K Forecast, by Application 2020 & 2033
- Table 21: Global Spinal Cord Electrophysiology Monitor Revenue billion Forecast, by Types 2020 & 2033
- Table 22: Global Spinal Cord Electrophysiology Monitor Volume K Forecast, by Types 2020 & 2033
- Table 23: Global Spinal Cord Electrophysiology Monitor Revenue billion Forecast, by Country 2020 & 2033
- Table 24: Global Spinal Cord Electrophysiology Monitor Volume K Forecast, by Country 2020 & 2033
- Table 25: Brazil Spinal Cord Electrophysiology Monitor Revenue (billion) Forecast, by Application 2020 & 2033
- Table 26: Brazil Spinal Cord Electrophysiology Monitor Volume (K) Forecast, by Application 2020 & 2033
- Table 27: Argentina Spinal Cord Electrophysiology Monitor Revenue (billion) Forecast, by Application 2020 & 2033
- Table 28: Argentina Spinal Cord Electrophysiology Monitor Volume (K) Forecast, by Application 2020 & 2033
- Table 29: Rest of South America Spinal Cord Electrophysiology Monitor Revenue (billion) Forecast, by Application 2020 & 2033
- Table 30: Rest of South America Spinal Cord Electrophysiology Monitor Volume (K) Forecast, by Application 2020 & 2033
- Table 31: Global Spinal Cord Electrophysiology Monitor Revenue billion Forecast, by Application 2020 & 2033
- Table 32: Global Spinal Cord Electrophysiology Monitor Volume K Forecast, by Application 2020 & 2033
- Table 33: Global Spinal Cord Electrophysiology Monitor Revenue billion Forecast, by Types 2020 & 2033
- Table 34: Global Spinal Cord Electrophysiology Monitor Volume K Forecast, by Types 2020 & 2033
- Table 35: Global Spinal Cord Electrophysiology Monitor Revenue billion Forecast, by Country 2020 & 2033
- Table 36: Global Spinal Cord Electrophysiology Monitor Volume K Forecast, by Country 2020 & 2033
- Table 37: United Kingdom Spinal Cord Electrophysiology Monitor Revenue (billion) Forecast, by Application 2020 & 2033
- Table 38: United Kingdom Spinal Cord Electrophysiology Monitor Volume (K) Forecast, by Application 2020 & 2033
- Table 39: Germany Spinal Cord Electrophysiology Monitor Revenue (billion) Forecast, by Application 2020 & 2033
- Table 40: Germany Spinal Cord Electrophysiology Monitor Volume (K) Forecast, by Application 2020 & 2033
- Table 41: France Spinal Cord Electrophysiology Monitor Revenue (billion) Forecast, by Application 2020 & 2033
- Table 42: France Spinal Cord Electrophysiology Monitor Volume (K) Forecast, by Application 2020 & 2033
- Table 43: Italy Spinal Cord Electrophysiology Monitor Revenue (billion) Forecast, by Application 2020 & 2033
- Table 44: Italy Spinal Cord Electrophysiology Monitor Volume (K) Forecast, by Application 2020 & 2033
- Table 45: Spain Spinal Cord Electrophysiology Monitor Revenue (billion) Forecast, by Application 2020 & 2033
- Table 46: Spain Spinal Cord Electrophysiology Monitor Volume (K) Forecast, by Application 2020 & 2033
- Table 47: Russia Spinal Cord Electrophysiology Monitor Revenue (billion) Forecast, by Application 2020 & 2033
- Table 48: Russia Spinal Cord Electrophysiology Monitor Volume (K) Forecast, by Application 2020 & 2033
- Table 49: Benelux Spinal Cord Electrophysiology Monitor Revenue (billion) Forecast, by Application 2020 & 2033
- Table 50: Benelux Spinal Cord Electrophysiology Monitor Volume (K) Forecast, by Application 2020 & 2033
- Table 51: Nordics Spinal Cord Electrophysiology Monitor Revenue (billion) Forecast, by Application 2020 & 2033
- Table 52: Nordics Spinal Cord Electrophysiology Monitor Volume (K) Forecast, by Application 2020 & 2033
- Table 53: Rest of Europe Spinal Cord Electrophysiology Monitor Revenue (billion) Forecast, by Application 2020 & 2033
- Table 54: Rest of Europe Spinal Cord Electrophysiology Monitor Volume (K) Forecast, by Application 2020 & 2033
- Table 55: Global Spinal Cord Electrophysiology Monitor Revenue billion Forecast, by Application 2020 & 2033
- Table 56: Global Spinal Cord Electrophysiology Monitor Volume K Forecast, by Application 2020 & 2033
- Table 57: Global Spinal Cord Electrophysiology Monitor Revenue billion Forecast, by Types 2020 & 2033
- Table 58: Global Spinal Cord Electrophysiology Monitor Volume K Forecast, by Types 2020 & 2033
- Table 59: Global Spinal Cord Electrophysiology Monitor Revenue billion Forecast, by Country 2020 & 2033
- Table 60: Global Spinal Cord Electrophysiology Monitor Volume K Forecast, by Country 2020 & 2033
- Table 61: Turkey Spinal Cord Electrophysiology Monitor Revenue (billion) Forecast, by Application 2020 & 2033
- Table 62: Turkey Spinal Cord Electrophysiology Monitor Volume (K) Forecast, by Application 2020 & 2033
- Table 63: Israel Spinal Cord Electrophysiology Monitor Revenue (billion) Forecast, by Application 2020 & 2033
- Table 64: Israel Spinal Cord Electrophysiology Monitor Volume (K) Forecast, by Application 2020 & 2033
- Table 65: GCC Spinal Cord Electrophysiology Monitor Revenue (billion) Forecast, by Application 2020 & 2033
- Table 66: GCC Spinal Cord Electrophysiology Monitor Volume (K) Forecast, by Application 2020 & 2033
- Table 67: North Africa Spinal Cord Electrophysiology Monitor Revenue (billion) Forecast, by Application 2020 & 2033
- Table 68: North Africa Spinal Cord Electrophysiology Monitor Volume (K) Forecast, by Application 2020 & 2033
- Table 69: South Africa Spinal Cord Electrophysiology Monitor Revenue (billion) Forecast, by Application 2020 & 2033
- Table 70: South Africa Spinal Cord Electrophysiology Monitor Volume (K) Forecast, by Application 2020 & 2033
- Table 71: Rest of Middle East & Africa Spinal Cord Electrophysiology Monitor Revenue (billion) Forecast, by Application 2020 & 2033
- Table 72: Rest of Middle East & Africa Spinal Cord Electrophysiology Monitor Volume (K) Forecast, by Application 2020 & 2033
- Table 73: Global Spinal Cord Electrophysiology Monitor Revenue billion Forecast, by Application 2020 & 2033
- Table 74: Global Spinal Cord Electrophysiology Monitor Volume K Forecast, by Application 2020 & 2033
- Table 75: Global Spinal Cord Electrophysiology Monitor Revenue billion Forecast, by Types 2020 & 2033
- Table 76: Global Spinal Cord Electrophysiology Monitor Volume K Forecast, by Types 2020 & 2033
- Table 77: Global Spinal Cord Electrophysiology Monitor Revenue billion Forecast, by Country 2020 & 2033
- Table 78: Global Spinal Cord Electrophysiology Monitor Volume K Forecast, by Country 2020 & 2033
- Table 79: China Spinal Cord Electrophysiology Monitor Revenue (billion) Forecast, by Application 2020 & 2033
- Table 80: China Spinal Cord Electrophysiology Monitor Volume (K) Forecast, by Application 2020 & 2033
- Table 81: India Spinal Cord Electrophysiology Monitor Revenue (billion) Forecast, by Application 2020 & 2033
- Table 82: India Spinal Cord Electrophysiology Monitor Volume (K) Forecast, by Application 2020 & 2033
- Table 83: Japan Spinal Cord Electrophysiology Monitor Revenue (billion) Forecast, by Application 2020 & 2033
- Table 84: Japan Spinal Cord Electrophysiology Monitor Volume (K) Forecast, by Application 2020 & 2033
- Table 85: South Korea Spinal Cord Electrophysiology Monitor Revenue (billion) Forecast, by Application 2020 & 2033
- Table 86: South Korea Spinal Cord Electrophysiology Monitor Volume (K) Forecast, by Application 2020 & 2033
- Table 87: ASEAN Spinal Cord Electrophysiology Monitor Revenue (billion) Forecast, by Application 2020 & 2033
- Table 88: ASEAN Spinal Cord Electrophysiology Monitor Volume (K) Forecast, by Application 2020 & 2033
- Table 89: Oceania Spinal Cord Electrophysiology Monitor Revenue (billion) Forecast, by Application 2020 & 2033
- Table 90: Oceania Spinal Cord Electrophysiology Monitor Volume (K) Forecast, by Application 2020 & 2033
- Table 91: Rest of Asia Pacific Spinal Cord Electrophysiology Monitor Revenue (billion) Forecast, by Application 2020 & 2033
- Table 92: Rest of Asia Pacific Spinal Cord Electrophysiology Monitor Volume (K) Forecast, by Application 2020 & 2033
Frequently Asked Questions
1. What is the projected Compound Annual Growth Rate (CAGR) of the Spinal Cord Electrophysiology Monitor?
The projected CAGR is approximately 5.46%.
2. Which companies are prominent players in the Spinal Cord Electrophysiology Monitor?
Key companies in the market include Nihon Kohden, Thermo Nicolet Corporation (Thermo Fisher), Natus Medical, Boston Scientific, Medtronic, NuVasive, Nipro, Cadwell.
3. What are the main segments of the Spinal Cord Electrophysiology Monitor?
The market segments include Application, Types.
4. Can you provide details about the market size?
The market size is estimated to be USD 3.65 billion as of 2022.
5. What are some drivers contributing to market growth?
N/A
6. What are the notable trends driving market growth?
N/A
7. Are there any restraints impacting market growth?
N/A
8. Can you provide examples of recent developments in the market?
N/A
9. What pricing options are available for accessing the report?
Pricing options include single-user, multi-user, and enterprise licenses priced at USD 3950.00, USD 5925.00, and USD 7900.00 respectively.
10. Is the market size provided in terms of value or volume?
The market size is provided in terms of value, measured in billion and volume, measured in K.
11. Are there any specific market keywords associated with the report?
Yes, the market keyword associated with the report is "Spinal Cord Electrophysiology Monitor," which aids in identifying and referencing the specific market segment covered.
12. How do I determine which pricing option suits my needs best?
The pricing options vary based on user requirements and access needs. Individual users may opt for single-user licenses, while businesses requiring broader access may choose multi-user or enterprise licenses for cost-effective access to the report.
13. Are there any additional resources or data provided in the Spinal Cord Electrophysiology Monitor report?
While the report offers comprehensive insights, it's advisable to review the specific contents or supplementary materials provided to ascertain if additional resources or data are available.
14. How can I stay updated on further developments or reports in the Spinal Cord Electrophysiology Monitor?
To stay informed about further developments, trends, and reports in the Spinal Cord Electrophysiology Monitor, consider subscribing to industry newsletters, following relevant companies and organizations, or regularly checking reputable industry news sources and publications.
Methodology
Step 1 - Identification of Relevant Samples Size from Population Database


Step 2 - Approaches for Defining Global Market Size (Value, Volume* & Price*)

Note*: In applicable scenarios
Step 3 - Data Sources
Primary Research
- Web Analytics
- Survey Reports
- Research Institute
- Latest Research Reports
- Opinion Leaders
Secondary Research
- Annual Reports
- White Paper
- Latest Press Release
- Industry Association
- Paid Database
- Investor Presentations

Step 4 - Data Triangulation
Involves using different sources of information in order to increase the validity of a study
These sources are likely to be stakeholders in a program - participants, other researchers, program staff, other community members, and so on.
Then we put all data in single framework & apply various statistical tools to find out the dynamic on the market.
During the analysis stage, feedback from the stakeholder groups would be compared to determine areas of agreement as well as areas of divergence