
Key Insights
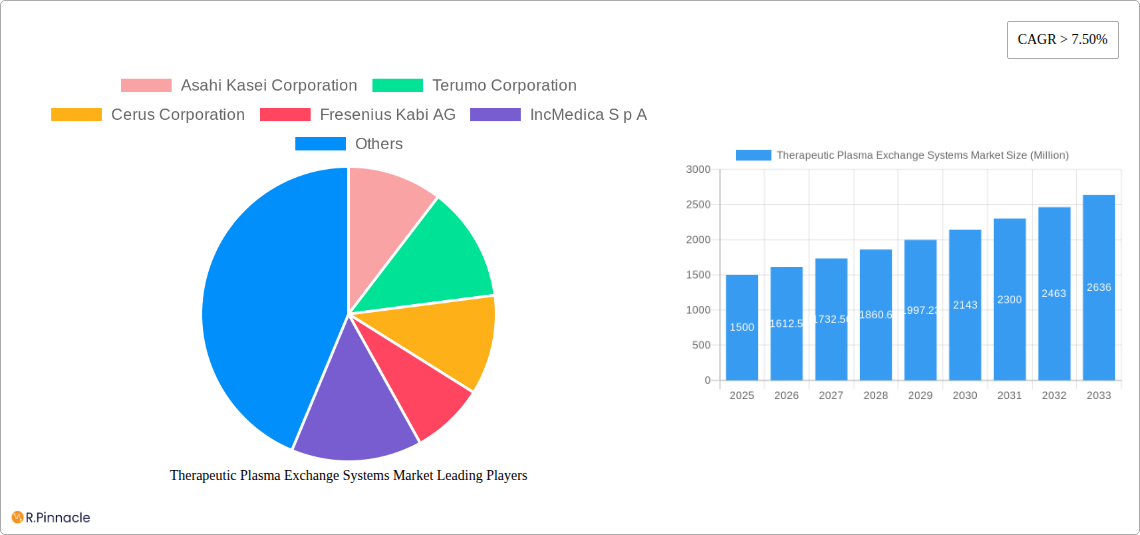
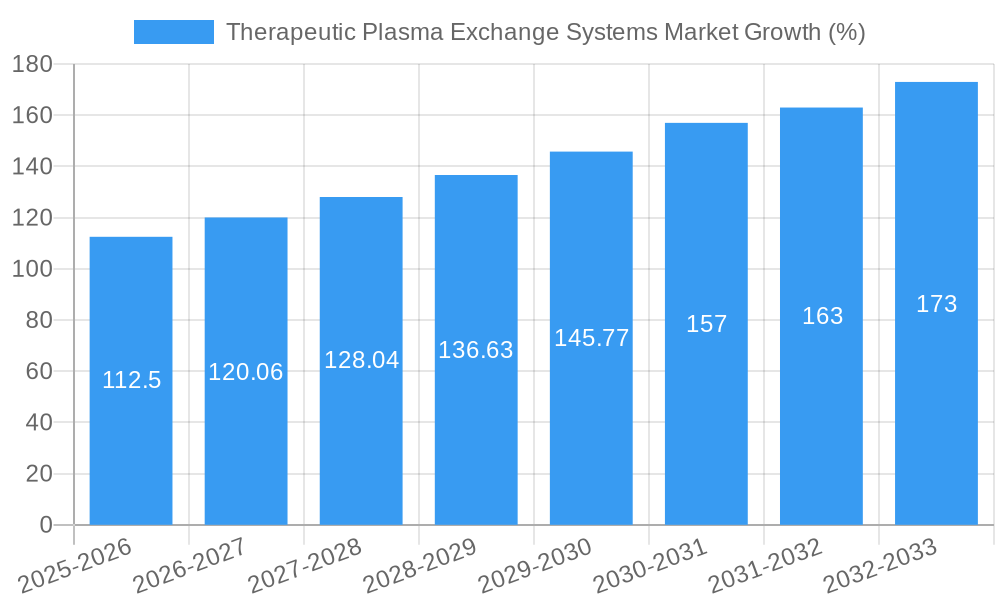
The Therapeutic Plasma Exchange (TPE) Systems market is experiencing robust growth, driven by increasing prevalence of autoimmune diseases, rising geriatric population, and technological advancements leading to improved TPE systems. The market, valued at approximately $1.5 billion in 2025, is projected to maintain a Compound Annual Growth Rate (CAGR) exceeding 7.5% from 2025 to 2033. This growth is fueled by the expanding applications of TPE in treating various disorders, including neurological conditions (like Guillain-Barré syndrome and myasthenia gravis), cardiovascular diseases, hematological disorders, and renal diseases. The adoption of advanced apheresis machines with enhanced features like automation and improved efficiency is significantly impacting market expansion. Furthermore, the increasing preference for ambulatory surgical centers and the growing awareness of TPE procedures among healthcare professionals contribute to market growth. However, factors like high procedural costs and potential risks associated with TPE might restrain market growth to some extent.
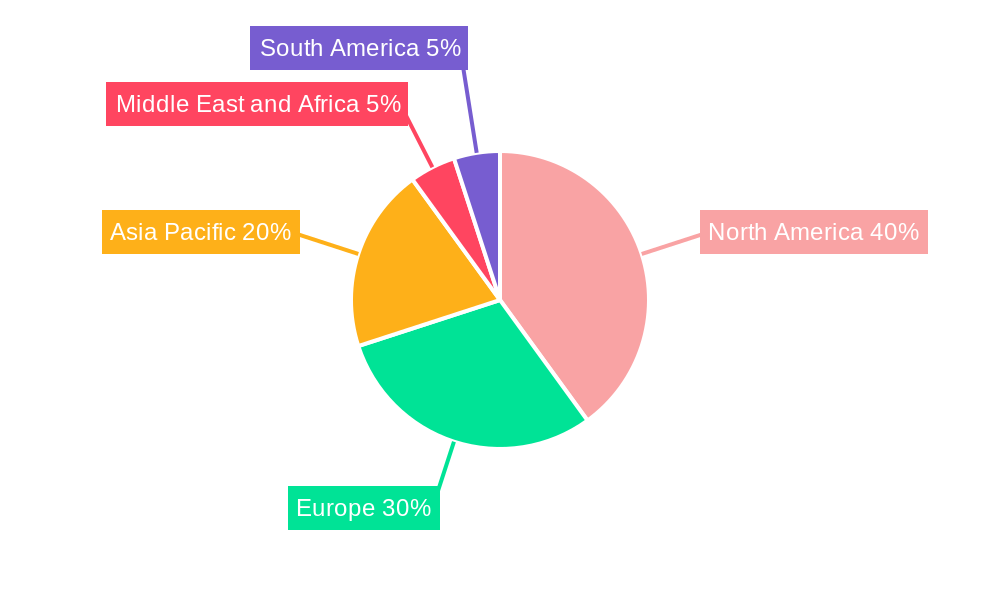
Segmentation analysis reveals significant contributions from apheresis machines, which dominate the product segment, followed by filters and other related consumables. Among indications, neurological disorders represent a major application area, followed by cardiovascular and hematological disorders. Hospitals form the largest end-user segment, accounting for a substantial share of market revenue. Geographically, North America and Europe currently hold significant market shares due to established healthcare infrastructure and high adoption rates. However, the Asia-Pacific region is poised for substantial growth in the coming years driven by rising healthcare expenditure and increasing disease prevalence. Key market players like Asahi Kasei Corporation, Terumo Corporation, and Haemonetics Corporation are actively engaged in research and development, and strategic partnerships, contributing to the overall market dynamism.
Therapeutic Plasma Exchange Systems Market: A Comprehensive Report (2019-2033)
This comprehensive report provides a detailed analysis of the Therapeutic Plasma Exchange Systems market, offering actionable insights for industry professionals. Covering the period from 2019 to 2033, with a focus on 2025, this study delves into market dynamics, segmentation, competitive landscape, and future projections. The report leverages extensive data analysis to provide a clear understanding of current market trends and future growth potential. The market size in 2025 is estimated at xx Million.
Therapeutic Plasma Exchange Systems Market Market Structure & Innovation Trends
The Therapeutic Plasma Exchange Systems market exhibits a moderately concentrated structure, with key players such as Asahi Kasei Corporation, Terumo Corporation, and Fresenius Kabi AG holding significant market share. Precise market share figures are detailed within the full report, along with analysis of the competitive landscape. Innovation in this market is driven by advancements in apheresis technology, the development of improved filters, and the expansion of therapeutic applications. Regulatory frameworks, particularly concerning device approvals and safety standards, play a crucial role in shaping market dynamics. The market has seen some M&A activity in recent years; the report analyzes several significant transactions, evaluating their impact on market consolidation and innovation. The total value of M&A deals in the past 5 years is estimated at xx Million. Product substitutes, while limited, include alternative blood purification techniques; the report assesses their impact on market growth. End-user demographics are primarily focused on hospitals and specialized healthcare facilities; the report analyzes their respective roles in the demand for plasma exchange systems.
Therapeutic Plasma Exchange Systems Market Market Dynamics & Trends
The Therapeutic Plasma Exchange Systems market is projected to experience a CAGR of xx% during the forecast period (2025-2033). This growth is fueled by several factors, including the increasing prevalence of chronic diseases requiring plasma exchange therapy, technological advancements leading to more efficient and compact systems, and expanding healthcare infrastructure, particularly in emerging economies. Technological disruptions, such as the integration of automation and digital technologies into apheresis machines, are significantly impacting market dynamics. Consumer preferences are leaning towards systems that offer enhanced patient comfort, reduced treatment times, and improved safety features. The competitive dynamics are characterized by ongoing innovation, strategic partnerships, and geographic expansion by leading players. Market penetration is highest in developed regions, with significant growth potential in developing markets.
Dominant Regions & Segments in Therapeutic Plasma Exchange Systems Market
The report identifies [Region Name] as the leading region in the Therapeutic Plasma Exchange Systems market, driven by factors such as [Specific driver 1, e.g., high prevalence of target diseases], [Specific driver 2, e.g., robust healthcare infrastructure], and [Specific driver 3, e.g., favorable regulatory environment]. Detailed analysis within the report breaks down regional and country-level performances, providing insights into the growth trajectories of each segment.
- Products: The Apheresis Machine segment dominates the market, driven by technological advancements and increasing demand. Filters represent a significant portion of the market, with continuous innovation focusing on improved efficiency and biocompatibility. The "Others" category includes ancillary equipment and consumables, showcasing steady growth.
- Indication: Neurological disorders constitute the largest indication segment due to the high prevalence of related conditions requiring plasma exchange. Cardiovascular and hematological disorders also represent significant segments, with continuous growth potential. The "Others" segment encompasses various applications, including autoimmune diseases and other rare conditions.
- End-User: Hospitals dominate the end-user segment due to their comprehensive treatment capabilities. Ambulatory surgical centers contribute significantly, reflecting the increasing trend towards outpatient procedures. The "Others" category includes specialized clinics and research institutions.
Therapeutic Plasma Exchange Systems Market Product Innovations
Recent product developments focus on miniaturization, improved automation, and enhanced safety features in apheresis machines. New filter technologies are emphasizing higher efficiency and biocompatibility to minimize patient risks. These innovations are enhancing the market fit by offering more convenient, safer, and effective treatment options, thereby driving market expansion.
Report Scope & Segmentation Analysis
The report comprehensively segments the Therapeutic Plasma Exchange Systems market based on products (Apheresis Machines, Filters, Others), indications (Neurological Disorders, Cardiovascular Disorders, Hematology Disorders, Renal Disorders, Others), and end-users (Hospitals, Ambulatory Surgical Centers, Others). Each segment's growth projection, market size, and competitive dynamics are thoroughly analyzed in the full report. For example, the Apheresis Machine segment is anticipated to witness substantial growth driven by technological improvements and increasing demand.
Key Drivers of Therapeutic Plasma Exchange Systems Market Growth
The Therapeutic Plasma Exchange Systems market is driven by rising prevalence of chronic diseases, technological advancements leading to improved efficiency and safety of plasma exchange systems, and increasing healthcare spending. Furthermore, favorable regulatory environments in key markets are stimulating market growth.
Challenges in the Therapeutic Plasma Exchange Systems Market Sector
High cost of treatment, stringent regulatory approvals, complex supply chain management, and intense competition among manufacturers pose significant challenges to market expansion. The impact of these factors is quantitatively analyzed in the full report.
Emerging Opportunities in Therapeutic Plasma Exchange Systems Market
Emerging markets in developing economies present significant growth opportunities, along with technological advancements like automation and artificial intelligence integration for enhanced efficiency and precision. Further research and development of novel therapeutic applications are also potential drivers of market expansion.
Leading Players in the Therapeutic Plasma Exchange Systems Market Market
- Asahi Kasei Corporation
- Terumo Corporation
- Cerus Corporation
- Fresenius Kabi AG
- IncMedica S p A
- Hemacare Corporation
- B Braun Melsungen AG
- Haemonetics Corporation
- Baxter International Inc
- Kawasumi Laboratories
Key Developments in Therapeutic Plasma Exchange Systems Market Industry
- [Month, Year]: [Company Name] launched a new apheresis machine with enhanced automation capabilities.
- [Month, Year]: [Company Name] secured regulatory approval for a novel filter technology.
- [Month, Year]: [Company A] and [Company B] announced a strategic partnership to develop advanced plasma exchange systems. (Further details of key developments are included in the full report.)
Future Outlook for Therapeutic Plasma Exchange Systems Market Market
The Therapeutic Plasma Exchange Systems market is poised for significant growth in the coming years, driven by continuous technological advancements, increasing prevalence of target diseases, and expansion into new markets. Strategic investments in research and development, along with collaborative partnerships, are expected to further fuel market expansion and create lucrative opportunities for market participants.
Therapeutic Plasma Exchange Systems Market Segmentation
-
1. Products
- 1.1. Apheresis Machine
- 1.2. Filters
- 1.3. Others
-
2. Indication
- 2.1. Neurological Disorders
- 2.2. Cardiovascular Disorders
- 2.3. Hematology Disorders
- 2.4. Renal Disorders
- 2.5. Others
-
3. End-User
- 3.1. Hospitals
- 3.2. Ambulatory Surgical Centers
- 3.3. Others
Therapeutic Plasma Exchange Systems Market Segmentation By Geography
-
1. North America
- 1.1. United states
- 1.2. Canada
- 1.3. Mexico
-
2. Europe
- 2.1. Germany
- 2.2. United Kingdom
- 2.3. France
- 2.4. Italy
- 2.5. Spain
- 2.6. Rest of Europe
-
3. Asia Pacific
- 3.1. China
- 3.2. Japan
- 3.3. India
- 3.4. Australia
- 3.5. South Korea
- 3.6. Rest of Asia Pacific
-
4. Middle East and Africa
- 4.1. GCC
- 4.2. South Africa
- 4.3. Rest of Middle East and Africa
-
5. South America
- 5.1. Brazil
- 5.2. Argentina
- 5.3. Rest of South America
Therapeutic Plasma Exchange Systems Market REPORT HIGHLIGHTS
| Aspects | Details |
|---|---|
| Study Period | 2019-2033 |
| Base Year | 2024 |
| Estimated Year | 2025 |
| Forecast Period | 2025-2033 |
| Historical Period | 2019-2024 |
| Growth Rate | CAGR of > 7.50% from 2019-2033 |
| Segmentation |
|
Table of Contents
- 1. Introduction
- 1.1. Research Scope
- 1.2. Market Segmentation
- 1.3. Research Methodology
- 1.4. Definitions and Assumptions
- 2. Executive Summary
- 2.1. Introduction
- 3. Market Dynamics
- 3.1. Introduction
- 3.2. Market Drivers
- 3.2.1. ; Rise in Global Prevalence of Autoimmune and Cardiac Diseases; Growing R&D Activities and Clinical Trials to Increase the Application in Various Indications
- 3.3. Market Restrains
- 3.3.1. ; High Cost of Treatment and Devices; Lack of Skilled Healthcare Professionals in Emerging Markets
- 3.4. Market Trends
- 3.4.1. The Neurological Disorders by Indication Segment is Expected to Hold the Largest Market Share in the Therapeutic Plasma Exchange Systems Market
- 4. Market Factor Analysis
- 4.1. Porters Five Forces
- 4.2. Supply/Value Chain
- 4.3. PESTEL analysis
- 4.4. Market Entropy
- 4.5. Patent/Trademark Analysis
- 5. Global Therapeutic Plasma Exchange Systems Market Analysis, Insights and Forecast, 2019-2031
- 5.1. Market Analysis, Insights and Forecast - by Products
- 5.1.1. Apheresis Machine
- 5.1.2. Filters
- 5.1.3. Others
- 5.2. Market Analysis, Insights and Forecast - by Indication
- 5.2.1. Neurological Disorders
- 5.2.2. Cardiovascular Disorders
- 5.2.3. Hematology Disorders
- 5.2.4. Renal Disorders
- 5.2.5. Others
- 5.3. Market Analysis, Insights and Forecast - by End-User
- 5.3.1. Hospitals
- 5.3.2. Ambulatory Surgical Centers
- 5.3.3. Others
- 5.4. Market Analysis, Insights and Forecast - by Region
- 5.4.1. North America
- 5.4.2. Europe
- 5.4.3. Asia Pacific
- 5.4.4. Middle East and Africa
- 5.4.5. South America
- 5.1. Market Analysis, Insights and Forecast - by Products
- 6. North America Therapeutic Plasma Exchange Systems Market Analysis, Insights and Forecast, 2019-2031
- 6.1. Market Analysis, Insights and Forecast - by Products
- 6.1.1. Apheresis Machine
- 6.1.2. Filters
- 6.1.3. Others
- 6.2. Market Analysis, Insights and Forecast - by Indication
- 6.2.1. Neurological Disorders
- 6.2.2. Cardiovascular Disorders
- 6.2.3. Hematology Disorders
- 6.2.4. Renal Disorders
- 6.2.5. Others
- 6.3. Market Analysis, Insights and Forecast - by End-User
- 6.3.1. Hospitals
- 6.3.2. Ambulatory Surgical Centers
- 6.3.3. Others
- 6.1. Market Analysis, Insights and Forecast - by Products
- 7. Europe Therapeutic Plasma Exchange Systems Market Analysis, Insights and Forecast, 2019-2031
- 7.1. Market Analysis, Insights and Forecast - by Products
- 7.1.1. Apheresis Machine
- 7.1.2. Filters
- 7.1.3. Others
- 7.2. Market Analysis, Insights and Forecast - by Indication
- 7.2.1. Neurological Disorders
- 7.2.2. Cardiovascular Disorders
- 7.2.3. Hematology Disorders
- 7.2.4. Renal Disorders
- 7.2.5. Others
- 7.3. Market Analysis, Insights and Forecast - by End-User
- 7.3.1. Hospitals
- 7.3.2. Ambulatory Surgical Centers
- 7.3.3. Others
- 7.1. Market Analysis, Insights and Forecast - by Products
- 8. Asia Pacific Therapeutic Plasma Exchange Systems Market Analysis, Insights and Forecast, 2019-2031
- 8.1. Market Analysis, Insights and Forecast - by Products
- 8.1.1. Apheresis Machine
- 8.1.2. Filters
- 8.1.3. Others
- 8.2. Market Analysis, Insights and Forecast - by Indication
- 8.2.1. Neurological Disorders
- 8.2.2. Cardiovascular Disorders
- 8.2.3. Hematology Disorders
- 8.2.4. Renal Disorders
- 8.2.5. Others
- 8.3. Market Analysis, Insights and Forecast - by End-User
- 8.3.1. Hospitals
- 8.3.2. Ambulatory Surgical Centers
- 8.3.3. Others
- 8.1. Market Analysis, Insights and Forecast - by Products
- 9. Middle East and Africa Therapeutic Plasma Exchange Systems Market Analysis, Insights and Forecast, 2019-2031
- 9.1. Market Analysis, Insights and Forecast - by Products
- 9.1.1. Apheresis Machine
- 9.1.2. Filters
- 9.1.3. Others
- 9.2. Market Analysis, Insights and Forecast - by Indication
- 9.2.1. Neurological Disorders
- 9.2.2. Cardiovascular Disorders
- 9.2.3. Hematology Disorders
- 9.2.4. Renal Disorders
- 9.2.5. Others
- 9.3. Market Analysis, Insights and Forecast - by End-User
- 9.3.1. Hospitals
- 9.3.2. Ambulatory Surgical Centers
- 9.3.3. Others
- 9.1. Market Analysis, Insights and Forecast - by Products
- 10. South America Therapeutic Plasma Exchange Systems Market Analysis, Insights and Forecast, 2019-2031
- 10.1. Market Analysis, Insights and Forecast - by Products
- 10.1.1. Apheresis Machine
- 10.1.2. Filters
- 10.1.3. Others
- 10.2. Market Analysis, Insights and Forecast - by Indication
- 10.2.1. Neurological Disorders
- 10.2.2. Cardiovascular Disorders
- 10.2.3. Hematology Disorders
- 10.2.4. Renal Disorders
- 10.2.5. Others
- 10.3. Market Analysis, Insights and Forecast - by End-User
- 10.3.1. Hospitals
- 10.3.2. Ambulatory Surgical Centers
- 10.3.3. Others
- 10.1. Market Analysis, Insights and Forecast - by Products
- 11. North America Therapeutic Plasma Exchange Systems Market Analysis, Insights and Forecast, 2019-2031
- 11.1. Market Analysis, Insights and Forecast - By Country/Sub-region
- 11.1.1. undefined
- 12. Europe Therapeutic Plasma Exchange Systems Market Analysis, Insights and Forecast, 2019-2031
- 12.1. Market Analysis, Insights and Forecast - By Country/Sub-region
- 12.1.1. undefined
- 13. Asia Pacific Therapeutic Plasma Exchange Systems Market Analysis, Insights and Forecast, 2019-2031
- 13.1. Market Analysis, Insights and Forecast - By Country/Sub-region
- 13.1.1. undefined
- 14. Middle East and Africa Therapeutic Plasma Exchange Systems Market Analysis, Insights and Forecast, 2019-2031
- 14.1. Market Analysis, Insights and Forecast - By Country/Sub-region
- 14.1.1. undefined
- 15. South America Therapeutic Plasma Exchange Systems Market Analysis, Insights and Forecast, 2019-2031
- 15.1. Market Analysis, Insights and Forecast - By Country/Sub-region
- 15.1.1. undefined
- 16. Competitive Analysis
- 16.1. Global Market Share Analysis 2024
- 16.2. Company Profiles
- 16.2.1 Asahi Kasei Corporation
- 16.2.1.1. Overview
- 16.2.1.2. Products
- 16.2.1.3. SWOT Analysis
- 16.2.1.4. Recent Developments
- 16.2.1.5. Financials (Based on Availability)
- 16.2.2 Terumo Corporation
- 16.2.2.1. Overview
- 16.2.2.2. Products
- 16.2.2.3. SWOT Analysis
- 16.2.2.4. Recent Developments
- 16.2.2.5. Financials (Based on Availability)
- 16.2.3 Cerus Corporation
- 16.2.3.1. Overview
- 16.2.3.2. Products
- 16.2.3.3. SWOT Analysis
- 16.2.3.4. Recent Developments
- 16.2.3.5. Financials (Based on Availability)
- 16.2.4 Fresenius Kabi AG
- 16.2.4.1. Overview
- 16.2.4.2. Products
- 16.2.4.3. SWOT Analysis
- 16.2.4.4. Recent Developments
- 16.2.4.5. Financials (Based on Availability)
- 16.2.5 IncMedica S p A
- 16.2.5.1. Overview
- 16.2.5.2. Products
- 16.2.5.3. SWOT Analysis
- 16.2.5.4. Recent Developments
- 16.2.5.5. Financials (Based on Availability)
- 16.2.6 Hemacare Corporation
- 16.2.6.1. Overview
- 16.2.6.2. Products
- 16.2.6.3. SWOT Analysis
- 16.2.6.4. Recent Developments
- 16.2.6.5. Financials (Based on Availability)
- 16.2.7 B Braun Melsungen AG
- 16.2.7.1. Overview
- 16.2.7.2. Products
- 16.2.7.3. SWOT Analysis
- 16.2.7.4. Recent Developments
- 16.2.7.5. Financials (Based on Availability)
- 16.2.8 Haemonetics Corporation
- 16.2.8.1. Overview
- 16.2.8.2. Products
- 16.2.8.3. SWOT Analysis
- 16.2.8.4. Recent Developments
- 16.2.8.5. Financials (Based on Availability)
- 16.2.9 Baxter International Inc
- 16.2.9.1. Overview
- 16.2.9.2. Products
- 16.2.9.3. SWOT Analysis
- 16.2.9.4. Recent Developments
- 16.2.9.5. Financials (Based on Availability)
- 16.2.10 Kawasumi Laboratories
- 16.2.10.1. Overview
- 16.2.10.2. Products
- 16.2.10.3. SWOT Analysis
- 16.2.10.4. Recent Developments
- 16.2.10.5. Financials (Based on Availability)
- 16.2.1 Asahi Kasei Corporation
List of Figures
- Figure 1: Global Therapeutic Plasma Exchange Systems Market Revenue Breakdown (Million, %) by Region 2024 & 2032
- Figure 2: Global Therapeutic Plasma Exchange Systems Market Volume Breakdown (K Unit, %) by Region 2024 & 2032
- Figure 3: North America Therapeutic Plasma Exchange Systems Market Revenue (Million), by Country 2024 & 2032
- Figure 4: North America Therapeutic Plasma Exchange Systems Market Volume (K Unit), by Country 2024 & 2032
- Figure 5: North America Therapeutic Plasma Exchange Systems Market Revenue Share (%), by Country 2024 & 2032
- Figure 6: North America Therapeutic Plasma Exchange Systems Market Volume Share (%), by Country 2024 & 2032
- Figure 7: Europe Therapeutic Plasma Exchange Systems Market Revenue (Million), by Country 2024 & 2032
- Figure 8: Europe Therapeutic Plasma Exchange Systems Market Volume (K Unit), by Country 2024 & 2032
- Figure 9: Europe Therapeutic Plasma Exchange Systems Market Revenue Share (%), by Country 2024 & 2032
- Figure 10: Europe Therapeutic Plasma Exchange Systems Market Volume Share (%), by Country 2024 & 2032
- Figure 11: Asia Pacific Therapeutic Plasma Exchange Systems Market Revenue (Million), by Country 2024 & 2032
- Figure 12: Asia Pacific Therapeutic Plasma Exchange Systems Market Volume (K Unit), by Country 2024 & 2032
- Figure 13: Asia Pacific Therapeutic Plasma Exchange Systems Market Revenue Share (%), by Country 2024 & 2032
- Figure 14: Asia Pacific Therapeutic Plasma Exchange Systems Market Volume Share (%), by Country 2024 & 2032
- Figure 15: Middle East and Africa Therapeutic Plasma Exchange Systems Market Revenue (Million), by Country 2024 & 2032
- Figure 16: Middle East and Africa Therapeutic Plasma Exchange Systems Market Volume (K Unit), by Country 2024 & 2032
- Figure 17: Middle East and Africa Therapeutic Plasma Exchange Systems Market Revenue Share (%), by Country 2024 & 2032
- Figure 18: Middle East and Africa Therapeutic Plasma Exchange Systems Market Volume Share (%), by Country 2024 & 2032
- Figure 19: South America Therapeutic Plasma Exchange Systems Market Revenue (Million), by Country 2024 & 2032
- Figure 20: South America Therapeutic Plasma Exchange Systems Market Volume (K Unit), by Country 2024 & 2032
- Figure 21: South America Therapeutic Plasma Exchange Systems Market Revenue Share (%), by Country 2024 & 2032
- Figure 22: South America Therapeutic Plasma Exchange Systems Market Volume Share (%), by Country 2024 & 2032
- Figure 23: North America Therapeutic Plasma Exchange Systems Market Revenue (Million), by Products 2024 & 2032
- Figure 24: North America Therapeutic Plasma Exchange Systems Market Volume (K Unit), by Products 2024 & 2032
- Figure 25: North America Therapeutic Plasma Exchange Systems Market Revenue Share (%), by Products 2024 & 2032
- Figure 26: North America Therapeutic Plasma Exchange Systems Market Volume Share (%), by Products 2024 & 2032
- Figure 27: North America Therapeutic Plasma Exchange Systems Market Revenue (Million), by Indication 2024 & 2032
- Figure 28: North America Therapeutic Plasma Exchange Systems Market Volume (K Unit), by Indication 2024 & 2032
- Figure 29: North America Therapeutic Plasma Exchange Systems Market Revenue Share (%), by Indication 2024 & 2032
- Figure 30: North America Therapeutic Plasma Exchange Systems Market Volume Share (%), by Indication 2024 & 2032
- Figure 31: North America Therapeutic Plasma Exchange Systems Market Revenue (Million), by End-User 2024 & 2032
- Figure 32: North America Therapeutic Plasma Exchange Systems Market Volume (K Unit), by End-User 2024 & 2032
- Figure 33: North America Therapeutic Plasma Exchange Systems Market Revenue Share (%), by End-User 2024 & 2032
- Figure 34: North America Therapeutic Plasma Exchange Systems Market Volume Share (%), by End-User 2024 & 2032
- Figure 35: North America Therapeutic Plasma Exchange Systems Market Revenue (Million), by Country 2024 & 2032
- Figure 36: North America Therapeutic Plasma Exchange Systems Market Volume (K Unit), by Country 2024 & 2032
- Figure 37: North America Therapeutic Plasma Exchange Systems Market Revenue Share (%), by Country 2024 & 2032
- Figure 38: North America Therapeutic Plasma Exchange Systems Market Volume Share (%), by Country 2024 & 2032
- Figure 39: Europe Therapeutic Plasma Exchange Systems Market Revenue (Million), by Products 2024 & 2032
- Figure 40: Europe Therapeutic Plasma Exchange Systems Market Volume (K Unit), by Products 2024 & 2032
- Figure 41: Europe Therapeutic Plasma Exchange Systems Market Revenue Share (%), by Products 2024 & 2032
- Figure 42: Europe Therapeutic Plasma Exchange Systems Market Volume Share (%), by Products 2024 & 2032
- Figure 43: Europe Therapeutic Plasma Exchange Systems Market Revenue (Million), by Indication 2024 & 2032
- Figure 44: Europe Therapeutic Plasma Exchange Systems Market Volume (K Unit), by Indication 2024 & 2032
- Figure 45: Europe Therapeutic Plasma Exchange Systems Market Revenue Share (%), by Indication 2024 & 2032
- Figure 46: Europe Therapeutic Plasma Exchange Systems Market Volume Share (%), by Indication 2024 & 2032
- Figure 47: Europe Therapeutic Plasma Exchange Systems Market Revenue (Million), by End-User 2024 & 2032
- Figure 48: Europe Therapeutic Plasma Exchange Systems Market Volume (K Unit), by End-User 2024 & 2032
- Figure 49: Europe Therapeutic Plasma Exchange Systems Market Revenue Share (%), by End-User 2024 & 2032
- Figure 50: Europe Therapeutic Plasma Exchange Systems Market Volume Share (%), by End-User 2024 & 2032
- Figure 51: Europe Therapeutic Plasma Exchange Systems Market Revenue (Million), by Country 2024 & 2032
- Figure 52: Europe Therapeutic Plasma Exchange Systems Market Volume (K Unit), by Country 2024 & 2032
- Figure 53: Europe Therapeutic Plasma Exchange Systems Market Revenue Share (%), by Country 2024 & 2032
- Figure 54: Europe Therapeutic Plasma Exchange Systems Market Volume Share (%), by Country 2024 & 2032
- Figure 55: Asia Pacific Therapeutic Plasma Exchange Systems Market Revenue (Million), by Products 2024 & 2032
- Figure 56: Asia Pacific Therapeutic Plasma Exchange Systems Market Volume (K Unit), by Products 2024 & 2032
- Figure 57: Asia Pacific Therapeutic Plasma Exchange Systems Market Revenue Share (%), by Products 2024 & 2032
- Figure 58: Asia Pacific Therapeutic Plasma Exchange Systems Market Volume Share (%), by Products 2024 & 2032
- Figure 59: Asia Pacific Therapeutic Plasma Exchange Systems Market Revenue (Million), by Indication 2024 & 2032
- Figure 60: Asia Pacific Therapeutic Plasma Exchange Systems Market Volume (K Unit), by Indication 2024 & 2032
- Figure 61: Asia Pacific Therapeutic Plasma Exchange Systems Market Revenue Share (%), by Indication 2024 & 2032
- Figure 62: Asia Pacific Therapeutic Plasma Exchange Systems Market Volume Share (%), by Indication 2024 & 2032
- Figure 63: Asia Pacific Therapeutic Plasma Exchange Systems Market Revenue (Million), by End-User 2024 & 2032
- Figure 64: Asia Pacific Therapeutic Plasma Exchange Systems Market Volume (K Unit), by End-User 2024 & 2032
- Figure 65: Asia Pacific Therapeutic Plasma Exchange Systems Market Revenue Share (%), by End-User 2024 & 2032
- Figure 66: Asia Pacific Therapeutic Plasma Exchange Systems Market Volume Share (%), by End-User 2024 & 2032
- Figure 67: Asia Pacific Therapeutic Plasma Exchange Systems Market Revenue (Million), by Country 2024 & 2032
- Figure 68: Asia Pacific Therapeutic Plasma Exchange Systems Market Volume (K Unit), by Country 2024 & 2032
- Figure 69: Asia Pacific Therapeutic Plasma Exchange Systems Market Revenue Share (%), by Country 2024 & 2032
- Figure 70: Asia Pacific Therapeutic Plasma Exchange Systems Market Volume Share (%), by Country 2024 & 2032
- Figure 71: Middle East and Africa Therapeutic Plasma Exchange Systems Market Revenue (Million), by Products 2024 & 2032
- Figure 72: Middle East and Africa Therapeutic Plasma Exchange Systems Market Volume (K Unit), by Products 2024 & 2032
- Figure 73: Middle East and Africa Therapeutic Plasma Exchange Systems Market Revenue Share (%), by Products 2024 & 2032
- Figure 74: Middle East and Africa Therapeutic Plasma Exchange Systems Market Volume Share (%), by Products 2024 & 2032
- Figure 75: Middle East and Africa Therapeutic Plasma Exchange Systems Market Revenue (Million), by Indication 2024 & 2032
- Figure 76: Middle East and Africa Therapeutic Plasma Exchange Systems Market Volume (K Unit), by Indication 2024 & 2032
- Figure 77: Middle East and Africa Therapeutic Plasma Exchange Systems Market Revenue Share (%), by Indication 2024 & 2032
- Figure 78: Middle East and Africa Therapeutic Plasma Exchange Systems Market Volume Share (%), by Indication 2024 & 2032
- Figure 79: Middle East and Africa Therapeutic Plasma Exchange Systems Market Revenue (Million), by End-User 2024 & 2032
- Figure 80: Middle East and Africa Therapeutic Plasma Exchange Systems Market Volume (K Unit), by End-User 2024 & 2032
- Figure 81: Middle East and Africa Therapeutic Plasma Exchange Systems Market Revenue Share (%), by End-User 2024 & 2032
- Figure 82: Middle East and Africa Therapeutic Plasma Exchange Systems Market Volume Share (%), by End-User 2024 & 2032
- Figure 83: Middle East and Africa Therapeutic Plasma Exchange Systems Market Revenue (Million), by Country 2024 & 2032
- Figure 84: Middle East and Africa Therapeutic Plasma Exchange Systems Market Volume (K Unit), by Country 2024 & 2032
- Figure 85: Middle East and Africa Therapeutic Plasma Exchange Systems Market Revenue Share (%), by Country 2024 & 2032
- Figure 86: Middle East and Africa Therapeutic Plasma Exchange Systems Market Volume Share (%), by Country 2024 & 2032
- Figure 87: South America Therapeutic Plasma Exchange Systems Market Revenue (Million), by Products 2024 & 2032
- Figure 88: South America Therapeutic Plasma Exchange Systems Market Volume (K Unit), by Products 2024 & 2032
- Figure 89: South America Therapeutic Plasma Exchange Systems Market Revenue Share (%), by Products 2024 & 2032
- Figure 90: South America Therapeutic Plasma Exchange Systems Market Volume Share (%), by Products 2024 & 2032
- Figure 91: South America Therapeutic Plasma Exchange Systems Market Revenue (Million), by Indication 2024 & 2032
- Figure 92: South America Therapeutic Plasma Exchange Systems Market Volume (K Unit), by Indication 2024 & 2032
- Figure 93: South America Therapeutic Plasma Exchange Systems Market Revenue Share (%), by Indication 2024 & 2032
- Figure 94: South America Therapeutic Plasma Exchange Systems Market Volume Share (%), by Indication 2024 & 2032
- Figure 95: South America Therapeutic Plasma Exchange Systems Market Revenue (Million), by End-User 2024 & 2032
- Figure 96: South America Therapeutic Plasma Exchange Systems Market Volume (K Unit), by End-User 2024 & 2032
- Figure 97: South America Therapeutic Plasma Exchange Systems Market Revenue Share (%), by End-User 2024 & 2032
- Figure 98: South America Therapeutic Plasma Exchange Systems Market Volume Share (%), by End-User 2024 & 2032
- Figure 99: South America Therapeutic Plasma Exchange Systems Market Revenue (Million), by Country 2024 & 2032
- Figure 100: South America Therapeutic Plasma Exchange Systems Market Volume (K Unit), by Country 2024 & 2032
- Figure 101: South America Therapeutic Plasma Exchange Systems Market Revenue Share (%), by Country 2024 & 2032
- Figure 102: South America Therapeutic Plasma Exchange Systems Market Volume Share (%), by Country 2024 & 2032
List of Tables
- Table 1: Global Therapeutic Plasma Exchange Systems Market Revenue Million Forecast, by Region 2019 & 2032
- Table 2: Global Therapeutic Plasma Exchange Systems Market Volume K Unit Forecast, by Region 2019 & 2032
- Table 3: Global Therapeutic Plasma Exchange Systems Market Revenue Million Forecast, by Products 2019 & 2032
- Table 4: Global Therapeutic Plasma Exchange Systems Market Volume K Unit Forecast, by Products 2019 & 2032
- Table 5: Global Therapeutic Plasma Exchange Systems Market Revenue Million Forecast, by Indication 2019 & 2032
- Table 6: Global Therapeutic Plasma Exchange Systems Market Volume K Unit Forecast, by Indication 2019 & 2032
- Table 7: Global Therapeutic Plasma Exchange Systems Market Revenue Million Forecast, by End-User 2019 & 2032
- Table 8: Global Therapeutic Plasma Exchange Systems Market Volume K Unit Forecast, by End-User 2019 & 2032
- Table 9: Global Therapeutic Plasma Exchange Systems Market Revenue Million Forecast, by Region 2019 & 2032
- Table 10: Global Therapeutic Plasma Exchange Systems Market Volume K Unit Forecast, by Region 2019 & 2032
- Table 11: Global Therapeutic Plasma Exchange Systems Market Revenue Million Forecast, by Country 2019 & 2032
- Table 12: Global Therapeutic Plasma Exchange Systems Market Volume K Unit Forecast, by Country 2019 & 2032
- Table 13: Global Therapeutic Plasma Exchange Systems Market Revenue Million Forecast, by Country 2019 & 2032
- Table 14: Global Therapeutic Plasma Exchange Systems Market Volume K Unit Forecast, by Country 2019 & 2032
- Table 15: Global Therapeutic Plasma Exchange Systems Market Revenue Million Forecast, by Country 2019 & 2032
- Table 16: Global Therapeutic Plasma Exchange Systems Market Volume K Unit Forecast, by Country 2019 & 2032
- Table 17: Global Therapeutic Plasma Exchange Systems Market Revenue Million Forecast, by Country 2019 & 2032
- Table 18: Global Therapeutic Plasma Exchange Systems Market Volume K Unit Forecast, by Country 2019 & 2032
- Table 19: Global Therapeutic Plasma Exchange Systems Market Revenue Million Forecast, by Country 2019 & 2032
- Table 20: Global Therapeutic Plasma Exchange Systems Market Volume K Unit Forecast, by Country 2019 & 2032
- Table 21: Global Therapeutic Plasma Exchange Systems Market Revenue Million Forecast, by Products 2019 & 2032
- Table 22: Global Therapeutic Plasma Exchange Systems Market Volume K Unit Forecast, by Products 2019 & 2032
- Table 23: Global Therapeutic Plasma Exchange Systems Market Revenue Million Forecast, by Indication 2019 & 2032
- Table 24: Global Therapeutic Plasma Exchange Systems Market Volume K Unit Forecast, by Indication 2019 & 2032
- Table 25: Global Therapeutic Plasma Exchange Systems Market Revenue Million Forecast, by End-User 2019 & 2032
- Table 26: Global Therapeutic Plasma Exchange Systems Market Volume K Unit Forecast, by End-User 2019 & 2032
- Table 27: Global Therapeutic Plasma Exchange Systems Market Revenue Million Forecast, by Country 2019 & 2032
- Table 28: Global Therapeutic Plasma Exchange Systems Market Volume K Unit Forecast, by Country 2019 & 2032
- Table 29: United states Therapeutic Plasma Exchange Systems Market Revenue (Million) Forecast, by Application 2019 & 2032
- Table 30: United states Therapeutic Plasma Exchange Systems Market Volume (K Unit) Forecast, by Application 2019 & 2032
- Table 31: Canada Therapeutic Plasma Exchange Systems Market Revenue (Million) Forecast, by Application 2019 & 2032
- Table 32: Canada Therapeutic Plasma Exchange Systems Market Volume (K Unit) Forecast, by Application 2019 & 2032
- Table 33: Mexico Therapeutic Plasma Exchange Systems Market Revenue (Million) Forecast, by Application 2019 & 2032
- Table 34: Mexico Therapeutic Plasma Exchange Systems Market Volume (K Unit) Forecast, by Application 2019 & 2032
- Table 35: Global Therapeutic Plasma Exchange Systems Market Revenue Million Forecast, by Products 2019 & 2032
- Table 36: Global Therapeutic Plasma Exchange Systems Market Volume K Unit Forecast, by Products 2019 & 2032
- Table 37: Global Therapeutic Plasma Exchange Systems Market Revenue Million Forecast, by Indication 2019 & 2032
- Table 38: Global Therapeutic Plasma Exchange Systems Market Volume K Unit Forecast, by Indication 2019 & 2032
- Table 39: Global Therapeutic Plasma Exchange Systems Market Revenue Million Forecast, by End-User 2019 & 2032
- Table 40: Global Therapeutic Plasma Exchange Systems Market Volume K Unit Forecast, by End-User 2019 & 2032
- Table 41: Global Therapeutic Plasma Exchange Systems Market Revenue Million Forecast, by Country 2019 & 2032
- Table 42: Global Therapeutic Plasma Exchange Systems Market Volume K Unit Forecast, by Country 2019 & 2032
- Table 43: Germany Therapeutic Plasma Exchange Systems Market Revenue (Million) Forecast, by Application 2019 & 2032
- Table 44: Germany Therapeutic Plasma Exchange Systems Market Volume (K Unit) Forecast, by Application 2019 & 2032
- Table 45: United Kingdom Therapeutic Plasma Exchange Systems Market Revenue (Million) Forecast, by Application 2019 & 2032
- Table 46: United Kingdom Therapeutic Plasma Exchange Systems Market Volume (K Unit) Forecast, by Application 2019 & 2032
- Table 47: France Therapeutic Plasma Exchange Systems Market Revenue (Million) Forecast, by Application 2019 & 2032
- Table 48: France Therapeutic Plasma Exchange Systems Market Volume (K Unit) Forecast, by Application 2019 & 2032
- Table 49: Italy Therapeutic Plasma Exchange Systems Market Revenue (Million) Forecast, by Application 2019 & 2032
- Table 50: Italy Therapeutic Plasma Exchange Systems Market Volume (K Unit) Forecast, by Application 2019 & 2032
- Table 51: Spain Therapeutic Plasma Exchange Systems Market Revenue (Million) Forecast, by Application 2019 & 2032
- Table 52: Spain Therapeutic Plasma Exchange Systems Market Volume (K Unit) Forecast, by Application 2019 & 2032
- Table 53: Rest of Europe Therapeutic Plasma Exchange Systems Market Revenue (Million) Forecast, by Application 2019 & 2032
- Table 54: Rest of Europe Therapeutic Plasma Exchange Systems Market Volume (K Unit) Forecast, by Application 2019 & 2032
- Table 55: Global Therapeutic Plasma Exchange Systems Market Revenue Million Forecast, by Products 2019 & 2032
- Table 56: Global Therapeutic Plasma Exchange Systems Market Volume K Unit Forecast, by Products 2019 & 2032
- Table 57: Global Therapeutic Plasma Exchange Systems Market Revenue Million Forecast, by Indication 2019 & 2032
- Table 58: Global Therapeutic Plasma Exchange Systems Market Volume K Unit Forecast, by Indication 2019 & 2032
- Table 59: Global Therapeutic Plasma Exchange Systems Market Revenue Million Forecast, by End-User 2019 & 2032
- Table 60: Global Therapeutic Plasma Exchange Systems Market Volume K Unit Forecast, by End-User 2019 & 2032
- Table 61: Global Therapeutic Plasma Exchange Systems Market Revenue Million Forecast, by Country 2019 & 2032
- Table 62: Global Therapeutic Plasma Exchange Systems Market Volume K Unit Forecast, by Country 2019 & 2032
- Table 63: China Therapeutic Plasma Exchange Systems Market Revenue (Million) Forecast, by Application 2019 & 2032
- Table 64: China Therapeutic Plasma Exchange Systems Market Volume (K Unit) Forecast, by Application 2019 & 2032
- Table 65: Japan Therapeutic Plasma Exchange Systems Market Revenue (Million) Forecast, by Application 2019 & 2032
- Table 66: Japan Therapeutic Plasma Exchange Systems Market Volume (K Unit) Forecast, by Application 2019 & 2032
- Table 67: India Therapeutic Plasma Exchange Systems Market Revenue (Million) Forecast, by Application 2019 & 2032
- Table 68: India Therapeutic Plasma Exchange Systems Market Volume (K Unit) Forecast, by Application 2019 & 2032
- Table 69: Australia Therapeutic Plasma Exchange Systems Market Revenue (Million) Forecast, by Application 2019 & 2032
- Table 70: Australia Therapeutic Plasma Exchange Systems Market Volume (K Unit) Forecast, by Application 2019 & 2032
- Table 71: South Korea Therapeutic Plasma Exchange Systems Market Revenue (Million) Forecast, by Application 2019 & 2032
- Table 72: South Korea Therapeutic Plasma Exchange Systems Market Volume (K Unit) Forecast, by Application 2019 & 2032
- Table 73: Rest of Asia Pacific Therapeutic Plasma Exchange Systems Market Revenue (Million) Forecast, by Application 2019 & 2032
- Table 74: Rest of Asia Pacific Therapeutic Plasma Exchange Systems Market Volume (K Unit) Forecast, by Application 2019 & 2032
- Table 75: Global Therapeutic Plasma Exchange Systems Market Revenue Million Forecast, by Products 2019 & 2032
- Table 76: Global Therapeutic Plasma Exchange Systems Market Volume K Unit Forecast, by Products 2019 & 2032
- Table 77: Global Therapeutic Plasma Exchange Systems Market Revenue Million Forecast, by Indication 2019 & 2032
- Table 78: Global Therapeutic Plasma Exchange Systems Market Volume K Unit Forecast, by Indication 2019 & 2032
- Table 79: Global Therapeutic Plasma Exchange Systems Market Revenue Million Forecast, by End-User 2019 & 2032
- Table 80: Global Therapeutic Plasma Exchange Systems Market Volume K Unit Forecast, by End-User 2019 & 2032
- Table 81: Global Therapeutic Plasma Exchange Systems Market Revenue Million Forecast, by Country 2019 & 2032
- Table 82: Global Therapeutic Plasma Exchange Systems Market Volume K Unit Forecast, by Country 2019 & 2032
- Table 83: GCC Therapeutic Plasma Exchange Systems Market Revenue (Million) Forecast, by Application 2019 & 2032
- Table 84: GCC Therapeutic Plasma Exchange Systems Market Volume (K Unit) Forecast, by Application 2019 & 2032
- Table 85: South Africa Therapeutic Plasma Exchange Systems Market Revenue (Million) Forecast, by Application 2019 & 2032
- Table 86: South Africa Therapeutic Plasma Exchange Systems Market Volume (K Unit) Forecast, by Application 2019 & 2032
- Table 87: Rest of Middle East and Africa Therapeutic Plasma Exchange Systems Market Revenue (Million) Forecast, by Application 2019 & 2032
- Table 88: Rest of Middle East and Africa Therapeutic Plasma Exchange Systems Market Volume (K Unit) Forecast, by Application 2019 & 2032
- Table 89: Global Therapeutic Plasma Exchange Systems Market Revenue Million Forecast, by Products 2019 & 2032
- Table 90: Global Therapeutic Plasma Exchange Systems Market Volume K Unit Forecast, by Products 2019 & 2032
- Table 91: Global Therapeutic Plasma Exchange Systems Market Revenue Million Forecast, by Indication 2019 & 2032
- Table 92: Global Therapeutic Plasma Exchange Systems Market Volume K Unit Forecast, by Indication 2019 & 2032
- Table 93: Global Therapeutic Plasma Exchange Systems Market Revenue Million Forecast, by End-User 2019 & 2032
- Table 94: Global Therapeutic Plasma Exchange Systems Market Volume K Unit Forecast, by End-User 2019 & 2032
- Table 95: Global Therapeutic Plasma Exchange Systems Market Revenue Million Forecast, by Country 2019 & 2032
- Table 96: Global Therapeutic Plasma Exchange Systems Market Volume K Unit Forecast, by Country 2019 & 2032
- Table 97: Brazil Therapeutic Plasma Exchange Systems Market Revenue (Million) Forecast, by Application 2019 & 2032
- Table 98: Brazil Therapeutic Plasma Exchange Systems Market Volume (K Unit) Forecast, by Application 2019 & 2032
- Table 99: Argentina Therapeutic Plasma Exchange Systems Market Revenue (Million) Forecast, by Application 2019 & 2032
- Table 100: Argentina Therapeutic Plasma Exchange Systems Market Volume (K Unit) Forecast, by Application 2019 & 2032
- Table 101: Rest of South America Therapeutic Plasma Exchange Systems Market Revenue (Million) Forecast, by Application 2019 & 2032
- Table 102: Rest of South America Therapeutic Plasma Exchange Systems Market Volume (K Unit) Forecast, by Application 2019 & 2032
Frequently Asked Questions
1. What is the projected Compound Annual Growth Rate (CAGR) of the Therapeutic Plasma Exchange Systems Market?
The projected CAGR is approximately > 7.50%.
2. Which companies are prominent players in the Therapeutic Plasma Exchange Systems Market?
Key companies in the market include Asahi Kasei Corporation, Terumo Corporation, Cerus Corporation, Fresenius Kabi AG, IncMedica S p A, Hemacare Corporation, B Braun Melsungen AG, Haemonetics Corporation, Baxter International Inc, Kawasumi Laboratories.
3. What are the main segments of the Therapeutic Plasma Exchange Systems Market?
The market segments include Products, Indication, End-User.
4. Can you provide details about the market size?
The market size is estimated to be USD XX Million as of 2022.
5. What are some drivers contributing to market growth?
; Rise in Global Prevalence of Autoimmune and Cardiac Diseases; Growing R&D Activities and Clinical Trials to Increase the Application in Various Indications.
6. What are the notable trends driving market growth?
The Neurological Disorders by Indication Segment is Expected to Hold the Largest Market Share in the Therapeutic Plasma Exchange Systems Market.
7. Are there any restraints impacting market growth?
; High Cost of Treatment and Devices; Lack of Skilled Healthcare Professionals in Emerging Markets.
8. Can you provide examples of recent developments in the market?
N/A
9. What pricing options are available for accessing the report?
Pricing options include single-user, multi-user, and enterprise licenses priced at USD 4750, USD 5250, and USD 8750 respectively.
10. Is the market size provided in terms of value or volume?
The market size is provided in terms of value, measured in Million and volume, measured in K Unit.
11. Are there any specific market keywords associated with the report?
Yes, the market keyword associated with the report is "Therapeutic Plasma Exchange Systems Market," which aids in identifying and referencing the specific market segment covered.
12. How do I determine which pricing option suits my needs best?
The pricing options vary based on user requirements and access needs. Individual users may opt for single-user licenses, while businesses requiring broader access may choose multi-user or enterprise licenses for cost-effective access to the report.
13. Are there any additional resources or data provided in the Therapeutic Plasma Exchange Systems Market report?
While the report offers comprehensive insights, it's advisable to review the specific contents or supplementary materials provided to ascertain if additional resources or data are available.
14. How can I stay updated on further developments or reports in the Therapeutic Plasma Exchange Systems Market?
To stay informed about further developments, trends, and reports in the Therapeutic Plasma Exchange Systems Market, consider subscribing to industry newsletters, following relevant companies and organizations, or regularly checking reputable industry news sources and publications.
Methodology
Step 1 - Identification of Relevant Samples Size from Population Database


Step 2 - Approaches for Defining Global Market Size (Value, Volume* & Price*)

Note*: In applicable scenarios
Step 3 - Data Sources
Primary Research
- Web Analytics
- Survey Reports
- Research Institute
- Latest Research Reports
- Opinion Leaders
Secondary Research
- Annual Reports
- White Paper
- Latest Press Release
- Industry Association
- Paid Database
- Investor Presentations

Step 4 - Data Triangulation
Involves using different sources of information in order to increase the validity of a study
These sources are likely to be stakeholders in a program - participants, other researchers, program staff, other community members, and so on.
Then we put all data in single framework & apply various statistical tools to find out the dynamic on the market.
During the analysis stage, feedback from the stakeholder groups would be compared to determine areas of agreement as well as areas of divergence


