
Key Insights
The thermoplastic composites market is experiencing robust growth, driven by the increasing demand for lightweight, high-strength materials across diverse industries. A 5.06% CAGR from 2019 to 2024 suggests a significant market expansion, projected to continue throughout the forecast period (2025-2033). Key drivers include the automotive industry's shift towards fuel-efficient vehicles, the burgeoning aerospace and defense sector requiring advanced composite materials, and the growing electronics market demanding lightweight and durable components. The rising adoption of short fiber thermoplastic (SFT) composites, owing to their cost-effectiveness and ease of processing, further fuels market expansion. Specific resin types like polypropylene (PP) and polyamide (PA) dominate the market due to their versatility and established applications. However, the market faces restraints such as the relatively high cost of high-performance materials like PEEK and the need for specialized manufacturing processes. Technological advancements focusing on improved fiber-matrix interfaces and the development of recyclable composites are key trends shaping the market's future trajectory. Regional growth is expected to be particularly strong in the Asia-Pacific region, driven by increasing manufacturing activity and infrastructure development in countries like China and India. North America and Europe maintain significant market shares due to established industries and technological innovation.
The competitive landscape is characterized by a mix of large multinational corporations and specialized manufacturers. Companies like BASF SE, SABIC, and Solvay are major players, leveraging their extensive research and development capabilities to innovate and cater to specific industry needs. Smaller, specialized companies focus on niche applications and provide customized solutions. The market's future depends on further technological advancements leading to enhanced material properties, cost reduction strategies, and expanding applications in emerging sectors like renewable energy and medical devices. The continued adoption of sustainable manufacturing practices and the development of recyclable thermoplastic composites will play a critical role in shaping market growth in the coming years. Understanding the varying needs of different end-user industries, such as the stringent requirements of the aerospace sector versus the cost-sensitivity of the automotive industry, is vital for successful market participation.

Thermoplastic Composites Market Report: 2019-2033 Forecast
This comprehensive report provides an in-depth analysis of the global Thermoplastic Composites market, offering actionable insights for industry professionals, investors, and strategic decision-makers. The study period covers 2019-2033, with 2025 as the base year and a forecast period of 2025-2033. The report segments the market by resin type, fiber type, product type, and end-user industry, providing a granular understanding of market dynamics and growth potential. Expected market size in Million is provided throughout the report.
Thermoplastic Composites Market Structure & Innovation Trends
The thermoplastic composites market is characterized by a moderately consolidated structure with several key players holding significant market share. Market concentration is expected to remain relatively stable during the forecast period, although strategic alliances and M&A activities could influence this. Key innovation drivers include the increasing demand for lightweight, high-strength materials across various industries, coupled with advancements in material science and manufacturing technologies. Stringent regulatory frameworks concerning environmental sustainability are also driving innovation towards eco-friendly composite materials. The market faces competition from traditional materials such as metals and thermoset composites; however, thermoplastic composites offer advantages in terms of recyclability and processing efficiency.
- Market Share: The top five players collectively hold approximately xx% of the global market share in 2025.
- M&A Activity: The market has witnessed significant M&A activity in recent years, with deal values exceeding xx Million in 2024. These activities primarily focus on expanding product portfolios, gaining access to new technologies, and enhancing global reach.

Thermoplastic Composites Market Dynamics & Trends
The global thermoplastic composites market is experiencing robust growth, driven by factors such as the burgeoning automotive and aerospace industries, increased demand for lightweight and high-performance materials, and technological advancements in manufacturing processes. The market is expected to register a CAGR of xx% during the forecast period (2025-2033). Technological disruptions, particularly in additive manufacturing and automated fiber placement, are accelerating market penetration. Consumer preferences for sustainable and recyclable materials are also boosting demand for thermoplastic composites. Intense competition among major players is driving innovation and price optimization, benefiting end-users.
Dominant Regions & Segments in Thermoplastic Composites Market
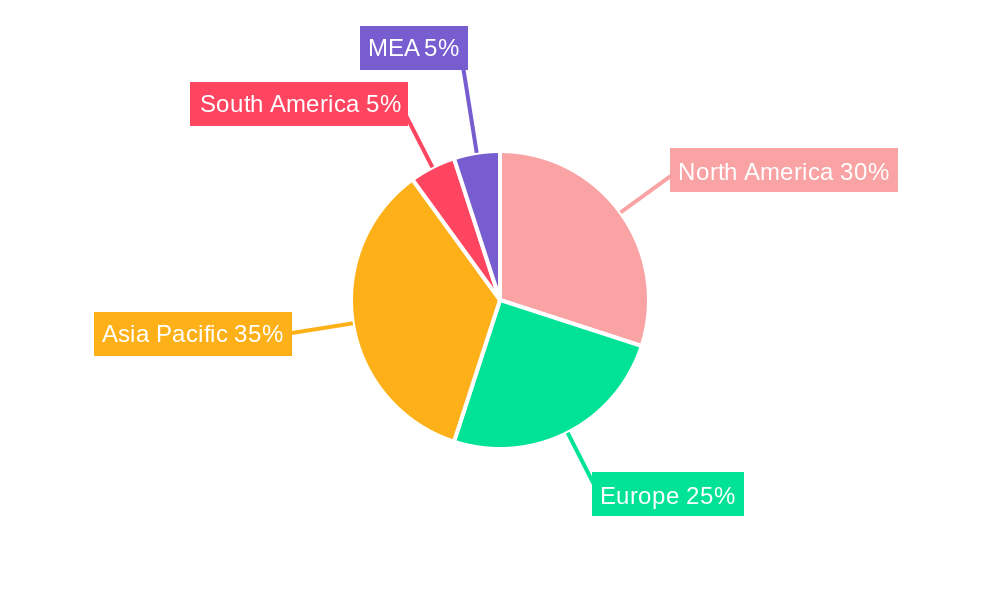
The dominant region for thermoplastic composites in 2025 is North America, followed by Europe and Asia-Pacific. The high adoption in North America is attributed to substantial growth in the aerospace and automotive sectors. Within the segments, the following hold the largest market shares:
- Resin Type: Polypropylene (PP) and Polyamide (PA) dominate due to cost-effectiveness and versatility.
- Fiber Type: Glass fiber accounts for the largest market share due to its relatively low cost.
- Product Type: Short Fiber Thermoplastic (SFT) holds the largest market share, owing to its widespread application across multiple industries.
- End-user Industry: The automotive industry is a major driver, fueled by stringent fuel efficiency standards. Aerospace and defense represent a high-growth segment.
Key Drivers:
- Automotive: Stringent fuel efficiency regulations and the rising demand for lightweight vehicles are primary growth drivers.
- Aerospace & Defense: Demand for high-performance, lightweight materials in aircraft and defense systems is significant.
- Construction: Growing adoption of thermoplastic composites in construction materials for improved durability and strength.
- Economic Factors: Government incentives and investments in infrastructure development are boosting market growth in certain regions.
Thermoplastic Composites Market Product Innovations
Recent advancements in thermoplastic composites include the development of high-performance materials with enhanced strength-to-weight ratios, improved processing capabilities through the use of innovative manufacturing techniques (e.g., 3D printing), and the introduction of bio-based resins for enhanced sustainability. These innovations address growing market demands for lightweight, high-strength, and eco-friendly materials, expanding application possibilities across various end-user industries and creating competitive advantages for manufacturers.
Report Scope & Segmentation Analysis
This report offers a comprehensive segmentation analysis of the thermoplastic composites market across various parameters:
Resin Type: Polypropylene (PP), Polyamide (PA), Polyetheretherketone (PEEK), and Other Resin Types, each with unique properties and applications. PP and PA are projected to witness the highest growth, driven by their cost-effectiveness and versatility.
Fiber Type: Glass Fiber, Carbon Fiber, and Other Fiber Types, each impacting material properties and cost. Glass fiber continues to dominate due to its price-performance ratio.
Product Type: Short Fiber Thermoplastic (SFT), Long Fiber Thermoplastic (LFT), Continuous Fiber Thermoplastic (CFT), and Glass Mat Thermoplastic (GMT) each cater to specific application requirements. SFT dominates due to its versatility and cost-effectiveness.
End-user Industry: Aerospace and Defense, Electrical and Electronics, Automotive, Construction, Medical, and Other End-user Industries each drive unique demands and innovations within the thermoplastic composites sector. The automotive segment is expected to maintain its dominance due to the growing adoption of lightweighting strategies.
Key Drivers of Thermoplastic Composites Market Growth
The thermoplastic composites market is experiencing significant growth, driven by a confluence of factors impacting various industries. This expansion is fueled by several key elements:
- Lightweighting & Enhanced Fuel Efficiency: The imperative to reduce weight in automotive, aerospace, and other transportation sectors is a primary driver. Lighter vehicles and aircraft translate to improved fuel efficiency, reduced emissions, and lower operational costs. This is particularly crucial in the context of increasing environmental regulations and consumer demand for sustainable transportation.
- Superior Strength and Performance: Thermoplastic composites offer exceptional strength-to-weight ratios, surpassing traditional materials like metals and thermosets in many applications. This superior performance enables the creation of stronger, more durable, and reliable components, leading to enhanced product lifespan and reduced maintenance needs.
- Design Flexibility and Complex Part Integration: Thermoplastic composites provide unparalleled design flexibility, allowing for the creation of complex shapes and geometries that would be impossible or impractical with traditional materials. This opens doors to innovative product designs with enhanced functionality and optimized performance, leading to improved product differentiation.
- Sustainability and Recyclability: The increasing focus on sustainability is a major catalyst for growth. Unlike many thermoset composites, thermoplastics can be repeatedly melted and reshaped, facilitating recycling and reducing waste. This aligns perfectly with the growing demand for eco-friendly materials and circular economy principles. Furthermore, the ability to use recycled materials in the manufacturing process further enhances sustainability.
- Cost-Effectiveness in the Long Run: While initial investment costs might be higher compared to some traditional materials, thermoplastic composites often demonstrate long-term cost advantages due to their durability, recyclability, and reduced maintenance requirements. The lifecycle cost analysis frequently favors thermoplastics over alternatives.
Challenges in the Thermoplastic Composites Market Sector
Despite the significant growth potential, the thermoplastic composites market faces certain challenges that need to be addressed for continued expansion:
- High Initial Investment Costs and Processing Complexity: The specialized processing equipment and expertise required for manufacturing thermoplastic composites can represent a high initial investment barrier to entry for some manufacturers. Optimizing processing techniques and reducing equipment costs are crucial for wider adoption.
- Supply Chain Vulnerabilities and Raw Material Price Fluctuations: Global supply chain disruptions and fluctuations in the price of raw materials can impact the overall cost and availability of thermoplastic composites. Diversification of supply chains and development of sustainable sourcing strategies are necessary to mitigate these risks.
- Competition from Established Materials: Thermoplastic composites face competition from well-established materials like metals, thermosets, and other advanced materials. Continuous innovation and demonstrating clear value propositions are vital to secure market share.
- Performance Limitations in Certain High-Temperature Applications: While advancements are continually being made, some thermoplastic composites may exhibit performance limitations compared to thermosets in certain high-temperature applications. Further material development is required to expand their applicability in such demanding environments.
Emerging Opportunities in Thermoplastic Composites Market
The thermoplastic composites market presents several exciting emerging opportunities:
- Expansion into New Applications: Significant growth potential exists in expanding into new application areas, including additive manufacturing (3D printing), construction, consumer goods, and medical devices. Tailoring material properties to meet specific application requirements is crucial for success.
- Advancements in Material Science and Novel Composites: Ongoing research and development efforts are focused on creating novel thermoplastic composites with enhanced properties, such as improved strength, higher temperature resistance, and enhanced chemical resistance. These advancements will open up new application possibilities.
- Sustainable Manufacturing Practices and Circular Economy Integration: Implementing environmentally friendly manufacturing processes and promoting the use of recycled materials are vital for meeting growing sustainability requirements and gaining a competitive edge.
- Industry Collaboration and Standardization Efforts: Fostering collaboration between material suppliers, manufacturers, and end-users will facilitate the development of industry standards, promote wider adoption, and accelerate market growth.
Leading Players in the Thermoplastic Composites Market Market
- SGL Carbon
- Arkema SA
- Solvay
- Celanese Corporation
- Avient Corporation
- LANXESS
- BASF SE
- SABIC
- DSM
- Daicel Corporation
- Toray Industries Inc
- Mitsubishi Chemical Group Corporation
- Hexcel Corporation
- AVANCO Group
- TechnoCompound GmbH
- LyondellBasell Industries Holdings BV
Key Developments in Thermoplastic Composites Market Industry
- April 2023: LANXESS and Advent International launched a joint venture focused on engineering materials.
- April 2023: Solvay and GKN Aerospace extended their partnership to develop thermoplastic composites for aircraft structures.
Future Outlook for Thermoplastic Composites Market Market
The thermoplastic composites market is poised for significant growth, driven by continued innovation, increasing demand from key end-user industries, and a growing focus on sustainability. Strategic partnerships, investments in R&D, and the expansion into new application areas will further accelerate market growth, creating lucrative opportunities for market players.
Thermoplastic Composites Market Segmentation
-
1. Resin Type
- 1.1. Polypropylene (PP)
- 1.2. Polyamide (PA)
- 1.3. Polyetheretherketone (PEEK)
- 1.4. Other Resin Types
-
2. Fiber Type
- 2.1. Glass Fiber
- 2.2. Carbon Fiber
- 2.3. Other Fiber Types
-
3. Product Type
- 3.1. Short Fiber Thermoplastic (SFT)
- 3.2. Long Fiber Thermoplastic (LFT)
- 3.3. Continuous Fiber Thermoplastic (CFT)
- 3.4. Glass Mat Thermoplastic (GMT)
-
4. End-user Industry
- 4.1. Automotive
- 4.2. Construction
- 4.3. Medical
- 4.4. Other End-user Industries
Thermoplastic Composites Market Segmentation By Geography
-
1. Asia Pacific
- 1.1. China
- 1.2. India
- 1.3. Japan
- 1.4. South Korea
- 1.5. ASEAN Countries
- 1.6. Rest of Asia Pacific
-
2. North America
- 2.1. United States
- 2.2. Canada
- 2.3. Mexico
-
3. Europe
- 3.1. Germany
- 3.2. United Kingdom
- 3.3. France
- 3.4. Italy
- 3.5. Rest of Europe
-
4. South America
- 4.1. Brazil
- 4.2. Argentina
- 4.3. Rest of South America
-
5. Middle East and Africa
- 5.1. Saudi Arabia
- 5.2. South Africa
- 5.3. Rest of Middle East and Africa
Thermoplastic Composites Market REPORT HIGHLIGHTS
| Aspects | Details |
|---|---|
| Study Period | 2019-2033 |
| Base Year | 2024 |
| Estimated Year | 2025 |
| Forecast Period | 2025-2033 |
| Historical Period | 2019-2024 |
| Growth Rate | CAGR of 5.06% from 2019-2033 |
| Segmentation |
|
Table of Contents
- 1. Introduction
- 1.1. Research Scope
- 1.2. Market Segmentation
- 1.3. Research Methodology
- 1.4. Definitions and Assumptions
- 2. Executive Summary
- 2.1. Introduction
- 3. Market Dynamics
- 3.1. Introduction
- 3.2. Market Drivers
- 3.2.1. Increasing Demand from the Automotive Industry; Rising Consumption in the Construction Industry
- 3.3. Market Restrains
- 3.3.1. High Cost of Raw Materials and Challenges to Form Thermoplastic Composites; Other Restraints
- 3.4. Market Trends
- 3.4.1. Automotive Industry to Dominate the Market
- 4. Market Factor Analysis
- 4.1. Porters Five Forces
- 4.2. Supply/Value Chain
- 4.3. PESTEL analysis
- 4.4. Market Entropy
- 4.5. Patent/Trademark Analysis
- 5. Global Thermoplastic Composites Market Analysis, Insights and Forecast, 2019-2031
- 5.1. Market Analysis, Insights and Forecast - by Resin Type
- 5.1.1. Polypropylene (PP)
- 5.1.2. Polyamide (PA)
- 5.1.3. Polyetheretherketone (PEEK)
- 5.1.4. Other Resin Types
- 5.2. Market Analysis, Insights and Forecast - by Fiber Type
- 5.2.1. Glass Fiber
- 5.2.2. Carbon Fiber
- 5.2.3. Other Fiber Types
- 5.3. Market Analysis, Insights and Forecast - by Product Type
- 5.3.1. Short Fiber Thermoplastic (SFT)
- 5.3.2. Long Fiber Thermoplastic (LFT)
- 5.3.3. Continuous Fiber Thermoplastic (CFT)
- 5.3.4. Glass Mat Thermoplastic (GMT)
- 5.4. Market Analysis, Insights and Forecast - by End-user Industry
- 5.4.1. Automotive
- 5.4.2. Construction
- 5.4.3. Medical
- 5.4.4. Other End-user Industries
- 5.5. Market Analysis, Insights and Forecast - by Region
- 5.5.1. Asia Pacific
- 5.5.2. North America
- 5.5.3. Europe
- 5.5.4. South America
- 5.5.5. Middle East and Africa
- 5.1. Market Analysis, Insights and Forecast - by Resin Type
- 6. Asia Pacific Thermoplastic Composites Market Analysis, Insights and Forecast, 2019-2031
- 6.1. Market Analysis, Insights and Forecast - by Resin Type
- 6.1.1. Polypropylene (PP)
- 6.1.2. Polyamide (PA)
- 6.1.3. Polyetheretherketone (PEEK)
- 6.1.4. Other Resin Types
- 6.2. Market Analysis, Insights and Forecast - by Fiber Type
- 6.2.1. Glass Fiber
- 6.2.2. Carbon Fiber
- 6.2.3. Other Fiber Types
- 6.3. Market Analysis, Insights and Forecast - by Product Type
- 6.3.1. Short Fiber Thermoplastic (SFT)
- 6.3.2. Long Fiber Thermoplastic (LFT)
- 6.3.3. Continuous Fiber Thermoplastic (CFT)
- 6.3.4. Glass Mat Thermoplastic (GMT)
- 6.4. Market Analysis, Insights and Forecast - by End-user Industry
- 6.4.1. Automotive
- 6.4.2. Construction
- 6.4.3. Medical
- 6.4.4. Other End-user Industries
- 6.1. Market Analysis, Insights and Forecast - by Resin Type
- 7. North America Thermoplastic Composites Market Analysis, Insights and Forecast, 2019-2031
- 7.1. Market Analysis, Insights and Forecast - by Resin Type
- 7.1.1. Polypropylene (PP)
- 7.1.2. Polyamide (PA)
- 7.1.3. Polyetheretherketone (PEEK)
- 7.1.4. Other Resin Types
- 7.2. Market Analysis, Insights and Forecast - by Fiber Type
- 7.2.1. Glass Fiber
- 7.2.2. Carbon Fiber
- 7.2.3. Other Fiber Types
- 7.3. Market Analysis, Insights and Forecast - by Product Type
- 7.3.1. Short Fiber Thermoplastic (SFT)
- 7.3.2. Long Fiber Thermoplastic (LFT)
- 7.3.3. Continuous Fiber Thermoplastic (CFT)
- 7.3.4. Glass Mat Thermoplastic (GMT)
- 7.4. Market Analysis, Insights and Forecast - by End-user Industry
- 7.4.1. Automotive
- 7.4.2. Construction
- 7.4.3. Medical
- 7.4.4. Other End-user Industries
- 7.1. Market Analysis, Insights and Forecast - by Resin Type
- 8. Europe Thermoplastic Composites Market Analysis, Insights and Forecast, 2019-2031
- 8.1. Market Analysis, Insights and Forecast - by Resin Type
- 8.1.1. Polypropylene (PP)
- 8.1.2. Polyamide (PA)
- 8.1.3. Polyetheretherketone (PEEK)
- 8.1.4. Other Resin Types
- 8.2. Market Analysis, Insights and Forecast - by Fiber Type
- 8.2.1. Glass Fiber
- 8.2.2. Carbon Fiber
- 8.2.3. Other Fiber Types
- 8.3. Market Analysis, Insights and Forecast - by Product Type
- 8.3.1. Short Fiber Thermoplastic (SFT)
- 8.3.2. Long Fiber Thermoplastic (LFT)
- 8.3.3. Continuous Fiber Thermoplastic (CFT)
- 8.3.4. Glass Mat Thermoplastic (GMT)
- 8.4. Market Analysis, Insights and Forecast - by End-user Industry
- 8.4.1. Automotive
- 8.4.2. Construction
- 8.4.3. Medical
- 8.4.4. Other End-user Industries
- 8.1. Market Analysis, Insights and Forecast - by Resin Type
- 9. South America Thermoplastic Composites Market Analysis, Insights and Forecast, 2019-2031
- 9.1. Market Analysis, Insights and Forecast - by Resin Type
- 9.1.1. Polypropylene (PP)
- 9.1.2. Polyamide (PA)
- 9.1.3. Polyetheretherketone (PEEK)
- 9.1.4. Other Resin Types
- 9.2. Market Analysis, Insights and Forecast - by Fiber Type
- 9.2.1. Glass Fiber
- 9.2.2. Carbon Fiber
- 9.2.3. Other Fiber Types
- 9.3. Market Analysis, Insights and Forecast - by Product Type
- 9.3.1. Short Fiber Thermoplastic (SFT)
- 9.3.2. Long Fiber Thermoplastic (LFT)
- 9.3.3. Continuous Fiber Thermoplastic (CFT)
- 9.3.4. Glass Mat Thermoplastic (GMT)
- 9.4. Market Analysis, Insights and Forecast - by End-user Industry
- 9.4.1. Automotive
- 9.4.2. Construction
- 9.4.3. Medical
- 9.4.4. Other End-user Industries
- 9.1. Market Analysis, Insights and Forecast - by Resin Type
- 10. Middle East and Africa Thermoplastic Composites Market Analysis, Insights and Forecast, 2019-2031
- 10.1. Market Analysis, Insights and Forecast - by Resin Type
- 10.1.1. Polypropylene (PP)
- 10.1.2. Polyamide (PA)
- 10.1.3. Polyetheretherketone (PEEK)
- 10.1.4. Other Resin Types
- 10.2. Market Analysis, Insights and Forecast - by Fiber Type
- 10.2.1. Glass Fiber
- 10.2.2. Carbon Fiber
- 10.2.3. Other Fiber Types
- 10.3. Market Analysis, Insights and Forecast - by Product Type
- 10.3.1. Short Fiber Thermoplastic (SFT)
- 10.3.2. Long Fiber Thermoplastic (LFT)
- 10.3.3. Continuous Fiber Thermoplastic (CFT)
- 10.3.4. Glass Mat Thermoplastic (GMT)
- 10.4. Market Analysis, Insights and Forecast - by End-user Industry
- 10.4.1. Automotive
- 10.4.2. Construction
- 10.4.3. Medical
- 10.4.4. Other End-user Industries
- 10.1. Market Analysis, Insights and Forecast - by Resin Type
- 11. North America Thermoplastic Composites Market Analysis, Insights and Forecast, 2019-2031
- 11.1. Market Analysis, Insights and Forecast - By Country/Sub-region
- 11.1.1 United States
- 11.1.2 Canada
- 11.1.3 Mexico
- 12. Europe Thermoplastic Composites Market Analysis, Insights and Forecast, 2019-2031
- 12.1. Market Analysis, Insights and Forecast - By Country/Sub-region
- 12.1.1 Germany
- 12.1.2 France
- 12.1.3 Italy
- 12.1.4 United Kingdom
- 12.1.5 Netherlands
- 12.1.6 Rest of Europe
- 13. Asia Pacific Thermoplastic Composites Market Analysis, Insights and Forecast, 2019-2031
- 13.1. Market Analysis, Insights and Forecast - By Country/Sub-region
- 13.1.1 China
- 13.1.2 Japan
- 13.1.3 India
- 13.1.4 South Korea
- 13.1.5 Taiwan
- 13.1.6 Australia
- 13.1.7 Rest of Asia-Pacific
- 14. South America Thermoplastic Composites Market Analysis, Insights and Forecast, 2019-2031
- 14.1. Market Analysis, Insights and Forecast - By Country/Sub-region
- 14.1.1 Brazil
- 14.1.2 Argentina
- 14.1.3 Rest of South America
- 15. MEA Thermoplastic Composites Market Analysis, Insights and Forecast, 2019-2031
- 15.1. Market Analysis, Insights and Forecast - By Country/Sub-region
- 15.1.1 Middle East
- 15.1.2 Africa
- 16. Competitive Analysis
- 16.1. Global Market Share Analysis 2024
- 16.2. Company Profiles
- 16.2.1 SGL Carbon
- 16.2.1.1. Overview
- 16.2.1.2. Products
- 16.2.1.3. SWOT Analysis
- 16.2.1.4. Recent Developments
- 16.2.1.5. Financials (Based on Availability)
- 16.2.2 Arkema SA
- 16.2.2.1. Overview
- 16.2.2.2. Products
- 16.2.2.3. SWOT Analysis
- 16.2.2.4. Recent Developments
- 16.2.2.5. Financials (Based on Availability)
- 16.2.3 Solvay
- 16.2.3.1. Overview
- 16.2.3.2. Products
- 16.2.3.3. SWOT Analysis
- 16.2.3.4. Recent Developments
- 16.2.3.5. Financials (Based on Availability)
- 16.2.4 Celanese Corporation
- 16.2.4.1. Overview
- 16.2.4.2. Products
- 16.2.4.3. SWOT Analysis
- 16.2.4.4. Recent Developments
- 16.2.4.5. Financials (Based on Availability)
- 16.2.5 Avient Corporation
- 16.2.5.1. Overview
- 16.2.5.2. Products
- 16.2.5.3. SWOT Analysis
- 16.2.5.4. Recent Developments
- 16.2.5.5. Financials (Based on Availability)
- 16.2.6 LANXESS
- 16.2.6.1. Overview
- 16.2.6.2. Products
- 16.2.6.3. SWOT Analysis
- 16.2.6.4. Recent Developments
- 16.2.6.5. Financials (Based on Availability)
- 16.2.7 BASF SE
- 16.2.7.1. Overview
- 16.2.7.2. Products
- 16.2.7.3. SWOT Analysis
- 16.2.7.4. Recent Developments
- 16.2.7.5. Financials (Based on Availability)
- 16.2.8 SABIC
- 16.2.8.1. Overview
- 16.2.8.2. Products
- 16.2.8.3. SWOT Analysis
- 16.2.8.4. Recent Developments
- 16.2.8.5. Financials (Based on Availability)
- 16.2.9 DSM
- 16.2.9.1. Overview
- 16.2.9.2. Products
- 16.2.9.3. SWOT Analysis
- 16.2.9.4. Recent Developments
- 16.2.9.5. Financials (Based on Availability)
- 16.2.10 Daicel Corporation
- 16.2.10.1. Overview
- 16.2.10.2. Products
- 16.2.10.3. SWOT Analysis
- 16.2.10.4. Recent Developments
- 16.2.10.5. Financials (Based on Availability)
- 16.2.11 Toray Industries Inc
- 16.2.11.1. Overview
- 16.2.11.2. Products
- 16.2.11.3. SWOT Analysis
- 16.2.11.4. Recent Developments
- 16.2.11.5. Financials (Based on Availability)
- 16.2.12 Mitsubishi Chemical Group Corporation
- 16.2.12.1. Overview
- 16.2.12.2. Products
- 16.2.12.3. SWOT Analysis
- 16.2.12.4. Recent Developments
- 16.2.12.5. Financials (Based on Availability)
- 16.2.13 Hexcel Corporation
- 16.2.13.1. Overview
- 16.2.13.2. Products
- 16.2.13.3. SWOT Analysis
- 16.2.13.4. Recent Developments
- 16.2.13.5. Financials (Based on Availability)
- 16.2.14 AVANCO Group
- 16.2.14.1. Overview
- 16.2.14.2. Products
- 16.2.14.3. SWOT Analysis
- 16.2.14.4. Recent Developments
- 16.2.14.5. Financials (Based on Availability)
- 16.2.15 TechnoCompound GmbH
- 16.2.15.1. Overview
- 16.2.15.2. Products
- 16.2.15.3. SWOT Analysis
- 16.2.15.4. Recent Developments
- 16.2.15.5. Financials (Based on Availability)
- 16.2.16 LyondellBasell Industries Holdings BV
- 16.2.16.1. Overview
- 16.2.16.2. Products
- 16.2.16.3. SWOT Analysis
- 16.2.16.4. Recent Developments
- 16.2.16.5. Financials (Based on Availability)
- 16.2.1 SGL Carbon
List of Figures
- Figure 1: Global Thermoplastic Composites Market Revenue Breakdown (Million, %) by Region 2024 & 2032
- Figure 2: Global Thermoplastic Composites Market Volume Breakdown (K Tons, %) by Region 2024 & 2032
- Figure 3: North America Thermoplastic Composites Market Revenue (Million), by Country 2024 & 2032
- Figure 4: North America Thermoplastic Composites Market Volume (K Tons), by Country 2024 & 2032
- Figure 5: North America Thermoplastic Composites Market Revenue Share (%), by Country 2024 & 2032
- Figure 6: North America Thermoplastic Composites Market Volume Share (%), by Country 2024 & 2032
- Figure 7: Europe Thermoplastic Composites Market Revenue (Million), by Country 2024 & 2032
- Figure 8: Europe Thermoplastic Composites Market Volume (K Tons), by Country 2024 & 2032
- Figure 9: Europe Thermoplastic Composites Market Revenue Share (%), by Country 2024 & 2032
- Figure 10: Europe Thermoplastic Composites Market Volume Share (%), by Country 2024 & 2032
- Figure 11: Asia Pacific Thermoplastic Composites Market Revenue (Million), by Country 2024 & 2032
- Figure 12: Asia Pacific Thermoplastic Composites Market Volume (K Tons), by Country 2024 & 2032
- Figure 13: Asia Pacific Thermoplastic Composites Market Revenue Share (%), by Country 2024 & 2032
- Figure 14: Asia Pacific Thermoplastic Composites Market Volume Share (%), by Country 2024 & 2032
- Figure 15: South America Thermoplastic Composites Market Revenue (Million), by Country 2024 & 2032
- Figure 16: South America Thermoplastic Composites Market Volume (K Tons), by Country 2024 & 2032
- Figure 17: South America Thermoplastic Composites Market Revenue Share (%), by Country 2024 & 2032
- Figure 18: South America Thermoplastic Composites Market Volume Share (%), by Country 2024 & 2032
- Figure 19: MEA Thermoplastic Composites Market Revenue (Million), by Country 2024 & 2032
- Figure 20: MEA Thermoplastic Composites Market Volume (K Tons), by Country 2024 & 2032
- Figure 21: MEA Thermoplastic Composites Market Revenue Share (%), by Country 2024 & 2032
- Figure 22: MEA Thermoplastic Composites Market Volume Share (%), by Country 2024 & 2032
- Figure 23: Asia Pacific Thermoplastic Composites Market Revenue (Million), by Resin Type 2024 & 2032
- Figure 24: Asia Pacific Thermoplastic Composites Market Volume (K Tons), by Resin Type 2024 & 2032
- Figure 25: Asia Pacific Thermoplastic Composites Market Revenue Share (%), by Resin Type 2024 & 2032
- Figure 26: Asia Pacific Thermoplastic Composites Market Volume Share (%), by Resin Type 2024 & 2032
- Figure 27: Asia Pacific Thermoplastic Composites Market Revenue (Million), by Fiber Type 2024 & 2032
- Figure 28: Asia Pacific Thermoplastic Composites Market Volume (K Tons), by Fiber Type 2024 & 2032
- Figure 29: Asia Pacific Thermoplastic Composites Market Revenue Share (%), by Fiber Type 2024 & 2032
- Figure 30: Asia Pacific Thermoplastic Composites Market Volume Share (%), by Fiber Type 2024 & 2032
- Figure 31: Asia Pacific Thermoplastic Composites Market Revenue (Million), by Product Type 2024 & 2032
- Figure 32: Asia Pacific Thermoplastic Composites Market Volume (K Tons), by Product Type 2024 & 2032
- Figure 33: Asia Pacific Thermoplastic Composites Market Revenue Share (%), by Product Type 2024 & 2032
- Figure 34: Asia Pacific Thermoplastic Composites Market Volume Share (%), by Product Type 2024 & 2032
- Figure 35: Asia Pacific Thermoplastic Composites Market Revenue (Million), by End-user Industry 2024 & 2032
- Figure 36: Asia Pacific Thermoplastic Composites Market Volume (K Tons), by End-user Industry 2024 & 2032
- Figure 37: Asia Pacific Thermoplastic Composites Market Revenue Share (%), by End-user Industry 2024 & 2032
- Figure 38: Asia Pacific Thermoplastic Composites Market Volume Share (%), by End-user Industry 2024 & 2032
- Figure 39: Asia Pacific Thermoplastic Composites Market Revenue (Million), by Country 2024 & 2032
- Figure 40: Asia Pacific Thermoplastic Composites Market Volume (K Tons), by Country 2024 & 2032
- Figure 41: Asia Pacific Thermoplastic Composites Market Revenue Share (%), by Country 2024 & 2032
- Figure 42: Asia Pacific Thermoplastic Composites Market Volume Share (%), by Country 2024 & 2032
- Figure 43: North America Thermoplastic Composites Market Revenue (Million), by Resin Type 2024 & 2032
- Figure 44: North America Thermoplastic Composites Market Volume (K Tons), by Resin Type 2024 & 2032
- Figure 45: North America Thermoplastic Composites Market Revenue Share (%), by Resin Type 2024 & 2032
- Figure 46: North America Thermoplastic Composites Market Volume Share (%), by Resin Type 2024 & 2032
- Figure 47: North America Thermoplastic Composites Market Revenue (Million), by Fiber Type 2024 & 2032
- Figure 48: North America Thermoplastic Composites Market Volume (K Tons), by Fiber Type 2024 & 2032
- Figure 49: North America Thermoplastic Composites Market Revenue Share (%), by Fiber Type 2024 & 2032
- Figure 50: North America Thermoplastic Composites Market Volume Share (%), by Fiber Type 2024 & 2032
- Figure 51: North America Thermoplastic Composites Market Revenue (Million), by Product Type 2024 & 2032
- Figure 52: North America Thermoplastic Composites Market Volume (K Tons), by Product Type 2024 & 2032
- Figure 53: North America Thermoplastic Composites Market Revenue Share (%), by Product Type 2024 & 2032
- Figure 54: North America Thermoplastic Composites Market Volume Share (%), by Product Type 2024 & 2032
- Figure 55: North America Thermoplastic Composites Market Revenue (Million), by End-user Industry 2024 & 2032
- Figure 56: North America Thermoplastic Composites Market Volume (K Tons), by End-user Industry 2024 & 2032
- Figure 57: North America Thermoplastic Composites Market Revenue Share (%), by End-user Industry 2024 & 2032
- Figure 58: North America Thermoplastic Composites Market Volume Share (%), by End-user Industry 2024 & 2032
- Figure 59: North America Thermoplastic Composites Market Revenue (Million), by Country 2024 & 2032
- Figure 60: North America Thermoplastic Composites Market Volume (K Tons), by Country 2024 & 2032
- Figure 61: North America Thermoplastic Composites Market Revenue Share (%), by Country 2024 & 2032
- Figure 62: North America Thermoplastic Composites Market Volume Share (%), by Country 2024 & 2032
- Figure 63: Europe Thermoplastic Composites Market Revenue (Million), by Resin Type 2024 & 2032
- Figure 64: Europe Thermoplastic Composites Market Volume (K Tons), by Resin Type 2024 & 2032
- Figure 65: Europe Thermoplastic Composites Market Revenue Share (%), by Resin Type 2024 & 2032
- Figure 66: Europe Thermoplastic Composites Market Volume Share (%), by Resin Type 2024 & 2032
- Figure 67: Europe Thermoplastic Composites Market Revenue (Million), by Fiber Type 2024 & 2032
- Figure 68: Europe Thermoplastic Composites Market Volume (K Tons), by Fiber Type 2024 & 2032
- Figure 69: Europe Thermoplastic Composites Market Revenue Share (%), by Fiber Type 2024 & 2032
- Figure 70: Europe Thermoplastic Composites Market Volume Share (%), by Fiber Type 2024 & 2032
- Figure 71: Europe Thermoplastic Composites Market Revenue (Million), by Product Type 2024 & 2032
- Figure 72: Europe Thermoplastic Composites Market Volume (K Tons), by Product Type 2024 & 2032
- Figure 73: Europe Thermoplastic Composites Market Revenue Share (%), by Product Type 2024 & 2032
- Figure 74: Europe Thermoplastic Composites Market Volume Share (%), by Product Type 2024 & 2032
- Figure 75: Europe Thermoplastic Composites Market Revenue (Million), by End-user Industry 2024 & 2032
- Figure 76: Europe Thermoplastic Composites Market Volume (K Tons), by End-user Industry 2024 & 2032
- Figure 77: Europe Thermoplastic Composites Market Revenue Share (%), by End-user Industry 2024 & 2032
- Figure 78: Europe Thermoplastic Composites Market Volume Share (%), by End-user Industry 2024 & 2032
- Figure 79: Europe Thermoplastic Composites Market Revenue (Million), by Country 2024 & 2032
- Figure 80: Europe Thermoplastic Composites Market Volume (K Tons), by Country 2024 & 2032
- Figure 81: Europe Thermoplastic Composites Market Revenue Share (%), by Country 2024 & 2032
- Figure 82: Europe Thermoplastic Composites Market Volume Share (%), by Country 2024 & 2032
- Figure 83: South America Thermoplastic Composites Market Revenue (Million), by Resin Type 2024 & 2032
- Figure 84: South America Thermoplastic Composites Market Volume (K Tons), by Resin Type 2024 & 2032
- Figure 85: South America Thermoplastic Composites Market Revenue Share (%), by Resin Type 2024 & 2032
- Figure 86: South America Thermoplastic Composites Market Volume Share (%), by Resin Type 2024 & 2032
- Figure 87: South America Thermoplastic Composites Market Revenue (Million), by Fiber Type 2024 & 2032
- Figure 88: South America Thermoplastic Composites Market Volume (K Tons), by Fiber Type 2024 & 2032
- Figure 89: South America Thermoplastic Composites Market Revenue Share (%), by Fiber Type 2024 & 2032
- Figure 90: South America Thermoplastic Composites Market Volume Share (%), by Fiber Type 2024 & 2032
- Figure 91: South America Thermoplastic Composites Market Revenue (Million), by Product Type 2024 & 2032
- Figure 92: South America Thermoplastic Composites Market Volume (K Tons), by Product Type 2024 & 2032
- Figure 93: South America Thermoplastic Composites Market Revenue Share (%), by Product Type 2024 & 2032
- Figure 94: South America Thermoplastic Composites Market Volume Share (%), by Product Type 2024 & 2032
- Figure 95: South America Thermoplastic Composites Market Revenue (Million), by End-user Industry 2024 & 2032
- Figure 96: South America Thermoplastic Composites Market Volume (K Tons), by End-user Industry 2024 & 2032
- Figure 97: South America Thermoplastic Composites Market Revenue Share (%), by End-user Industry 2024 & 2032
- Figure 98: South America Thermoplastic Composites Market Volume Share (%), by End-user Industry 2024 & 2032
- Figure 99: South America Thermoplastic Composites Market Revenue (Million), by Country 2024 & 2032
- Figure 100: South America Thermoplastic Composites Market Volume (K Tons), by Country 2024 & 2032
- Figure 101: South America Thermoplastic Composites Market Revenue Share (%), by Country 2024 & 2032
- Figure 102: South America Thermoplastic Composites Market Volume Share (%), by Country 2024 & 2032
- Figure 103: Middle East and Africa Thermoplastic Composites Market Revenue (Million), by Resin Type 2024 & 2032
- Figure 104: Middle East and Africa Thermoplastic Composites Market Volume (K Tons), by Resin Type 2024 & 2032
- Figure 105: Middle East and Africa Thermoplastic Composites Market Revenue Share (%), by Resin Type 2024 & 2032
- Figure 106: Middle East and Africa Thermoplastic Composites Market Volume Share (%), by Resin Type 2024 & 2032
- Figure 107: Middle East and Africa Thermoplastic Composites Market Revenue (Million), by Fiber Type 2024 & 2032
- Figure 108: Middle East and Africa Thermoplastic Composites Market Volume (K Tons), by Fiber Type 2024 & 2032
- Figure 109: Middle East and Africa Thermoplastic Composites Market Revenue Share (%), by Fiber Type 2024 & 2032
- Figure 110: Middle East and Africa Thermoplastic Composites Market Volume Share (%), by Fiber Type 2024 & 2032
- Figure 111: Middle East and Africa Thermoplastic Composites Market Revenue (Million), by Product Type 2024 & 2032
- Figure 112: Middle East and Africa Thermoplastic Composites Market Volume (K Tons), by Product Type 2024 & 2032
- Figure 113: Middle East and Africa Thermoplastic Composites Market Revenue Share (%), by Product Type 2024 & 2032
- Figure 114: Middle East and Africa Thermoplastic Composites Market Volume Share (%), by Product Type 2024 & 2032
- Figure 115: Middle East and Africa Thermoplastic Composites Market Revenue (Million), by End-user Industry 2024 & 2032
- Figure 116: Middle East and Africa Thermoplastic Composites Market Volume (K Tons), by End-user Industry 2024 & 2032
- Figure 117: Middle East and Africa Thermoplastic Composites Market Revenue Share (%), by End-user Industry 2024 & 2032
- Figure 118: Middle East and Africa Thermoplastic Composites Market Volume Share (%), by End-user Industry 2024 & 2032
- Figure 119: Middle East and Africa Thermoplastic Composites Market Revenue (Million), by Country 2024 & 2032
- Figure 120: Middle East and Africa Thermoplastic Composites Market Volume (K Tons), by Country 2024 & 2032
- Figure 121: Middle East and Africa Thermoplastic Composites Market Revenue Share (%), by Country 2024 & 2032
- Figure 122: Middle East and Africa Thermoplastic Composites Market Volume Share (%), by Country 2024 & 2032
List of Tables
- Table 1: Global Thermoplastic Composites Market Revenue Million Forecast, by Region 2019 & 2032
- Table 2: Global Thermoplastic Composites Market Volume K Tons Forecast, by Region 2019 & 2032
- Table 3: Global Thermoplastic Composites Market Revenue Million Forecast, by Resin Type 2019 & 2032
- Table 4: Global Thermoplastic Composites Market Volume K Tons Forecast, by Resin Type 2019 & 2032
- Table 5: Global Thermoplastic Composites Market Revenue Million Forecast, by Fiber Type 2019 & 2032
- Table 6: Global Thermoplastic Composites Market Volume K Tons Forecast, by Fiber Type 2019 & 2032
- Table 7: Global Thermoplastic Composites Market Revenue Million Forecast, by Product Type 2019 & 2032
- Table 8: Global Thermoplastic Composites Market Volume K Tons Forecast, by Product Type 2019 & 2032
- Table 9: Global Thermoplastic Composites Market Revenue Million Forecast, by End-user Industry 2019 & 2032
- Table 10: Global Thermoplastic Composites Market Volume K Tons Forecast, by End-user Industry 2019 & 2032
- Table 11: Global Thermoplastic Composites Market Revenue Million Forecast, by Region 2019 & 2032
- Table 12: Global Thermoplastic Composites Market Volume K Tons Forecast, by Region 2019 & 2032
- Table 13: Global Thermoplastic Composites Market Revenue Million Forecast, by Country 2019 & 2032
- Table 14: Global Thermoplastic Composites Market Volume K Tons Forecast, by Country 2019 & 2032
- Table 15: United States Thermoplastic Composites Market Revenue (Million) Forecast, by Application 2019 & 2032
- Table 16: United States Thermoplastic Composites Market Volume (K Tons) Forecast, by Application 2019 & 2032
- Table 17: Canada Thermoplastic Composites Market Revenue (Million) Forecast, by Application 2019 & 2032
- Table 18: Canada Thermoplastic Composites Market Volume (K Tons) Forecast, by Application 2019 & 2032
- Table 19: Mexico Thermoplastic Composites Market Revenue (Million) Forecast, by Application 2019 & 2032
- Table 20: Mexico Thermoplastic Composites Market Volume (K Tons) Forecast, by Application 2019 & 2032
- Table 21: Global Thermoplastic Composites Market Revenue Million Forecast, by Country 2019 & 2032
- Table 22: Global Thermoplastic Composites Market Volume K Tons Forecast, by Country 2019 & 2032
- Table 23: Germany Thermoplastic Composites Market Revenue (Million) Forecast, by Application 2019 & 2032
- Table 24: Germany Thermoplastic Composites Market Volume (K Tons) Forecast, by Application 2019 & 2032
- Table 25: France Thermoplastic Composites Market Revenue (Million) Forecast, by Application 2019 & 2032
- Table 26: France Thermoplastic Composites Market Volume (K Tons) Forecast, by Application 2019 & 2032
- Table 27: Italy Thermoplastic Composites Market Revenue (Million) Forecast, by Application 2019 & 2032
- Table 28: Italy Thermoplastic Composites Market Volume (K Tons) Forecast, by Application 2019 & 2032
- Table 29: United Kingdom Thermoplastic Composites Market Revenue (Million) Forecast, by Application 2019 & 2032
- Table 30: United Kingdom Thermoplastic Composites Market Volume (K Tons) Forecast, by Application 2019 & 2032
- Table 31: Netherlands Thermoplastic Composites Market Revenue (Million) Forecast, by Application 2019 & 2032
- Table 32: Netherlands Thermoplastic Composites Market Volume (K Tons) Forecast, by Application 2019 & 2032
- Table 33: Rest of Europe Thermoplastic Composites Market Revenue (Million) Forecast, by Application 2019 & 2032
- Table 34: Rest of Europe Thermoplastic Composites Market Volume (K Tons) Forecast, by Application 2019 & 2032
- Table 35: Global Thermoplastic Composites Market Revenue Million Forecast, by Country 2019 & 2032
- Table 36: Global Thermoplastic Composites Market Volume K Tons Forecast, by Country 2019 & 2032
- Table 37: China Thermoplastic Composites Market Revenue (Million) Forecast, by Application 2019 & 2032
- Table 38: China Thermoplastic Composites Market Volume (K Tons) Forecast, by Application 2019 & 2032
- Table 39: Japan Thermoplastic Composites Market Revenue (Million) Forecast, by Application 2019 & 2032
- Table 40: Japan Thermoplastic Composites Market Volume (K Tons) Forecast, by Application 2019 & 2032
- Table 41: India Thermoplastic Composites Market Revenue (Million) Forecast, by Application 2019 & 2032
- Table 42: India Thermoplastic Composites Market Volume (K Tons) Forecast, by Application 2019 & 2032
- Table 43: South Korea Thermoplastic Composites Market Revenue (Million) Forecast, by Application 2019 & 2032
- Table 44: South Korea Thermoplastic Composites Market Volume (K Tons) Forecast, by Application 2019 & 2032
- Table 45: Taiwan Thermoplastic Composites Market Revenue (Million) Forecast, by Application 2019 & 2032
- Table 46: Taiwan Thermoplastic Composites Market Volume (K Tons) Forecast, by Application 2019 & 2032
- Table 47: Australia Thermoplastic Composites Market Revenue (Million) Forecast, by Application 2019 & 2032
- Table 48: Australia Thermoplastic Composites Market Volume (K Tons) Forecast, by Application 2019 & 2032
- Table 49: Rest of Asia-Pacific Thermoplastic Composites Market Revenue (Million) Forecast, by Application 2019 & 2032
- Table 50: Rest of Asia-Pacific Thermoplastic Composites Market Volume (K Tons) Forecast, by Application 2019 & 2032
- Table 51: Global Thermoplastic Composites Market Revenue Million Forecast, by Country 2019 & 2032
- Table 52: Global Thermoplastic Composites Market Volume K Tons Forecast, by Country 2019 & 2032
- Table 53: Brazil Thermoplastic Composites Market Revenue (Million) Forecast, by Application 2019 & 2032
- Table 54: Brazil Thermoplastic Composites Market Volume (K Tons) Forecast, by Application 2019 & 2032
- Table 55: Argentina Thermoplastic Composites Market Revenue (Million) Forecast, by Application 2019 & 2032
- Table 56: Argentina Thermoplastic Composites Market Volume (K Tons) Forecast, by Application 2019 & 2032
- Table 57: Rest of South America Thermoplastic Composites Market Revenue (Million) Forecast, by Application 2019 & 2032
- Table 58: Rest of South America Thermoplastic Composites Market Volume (K Tons) Forecast, by Application 2019 & 2032
- Table 59: Global Thermoplastic Composites Market Revenue Million Forecast, by Country 2019 & 2032
- Table 60: Global Thermoplastic Composites Market Volume K Tons Forecast, by Country 2019 & 2032
- Table 61: Middle East Thermoplastic Composites Market Revenue (Million) Forecast, by Application 2019 & 2032
- Table 62: Middle East Thermoplastic Composites Market Volume (K Tons) Forecast, by Application 2019 & 2032
- Table 63: Africa Thermoplastic Composites Market Revenue (Million) Forecast, by Application 2019 & 2032
- Table 64: Africa Thermoplastic Composites Market Volume (K Tons) Forecast, by Application 2019 & 2032
- Table 65: Global Thermoplastic Composites Market Revenue Million Forecast, by Resin Type 2019 & 2032
- Table 66: Global Thermoplastic Composites Market Volume K Tons Forecast, by Resin Type 2019 & 2032
- Table 67: Global Thermoplastic Composites Market Revenue Million Forecast, by Fiber Type 2019 & 2032
- Table 68: Global Thermoplastic Composites Market Volume K Tons Forecast, by Fiber Type 2019 & 2032
- Table 69: Global Thermoplastic Composites Market Revenue Million Forecast, by Product Type 2019 & 2032
- Table 70: Global Thermoplastic Composites Market Volume K Tons Forecast, by Product Type 2019 & 2032
- Table 71: Global Thermoplastic Composites Market Revenue Million Forecast, by End-user Industry 2019 & 2032
- Table 72: Global Thermoplastic Composites Market Volume K Tons Forecast, by End-user Industry 2019 & 2032
- Table 73: Global Thermoplastic Composites Market Revenue Million Forecast, by Country 2019 & 2032
- Table 74: Global Thermoplastic Composites Market Volume K Tons Forecast, by Country 2019 & 2032
- Table 75: China Thermoplastic Composites Market Revenue (Million) Forecast, by Application 2019 & 2032
- Table 76: China Thermoplastic Composites Market Volume (K Tons) Forecast, by Application 2019 & 2032
- Table 77: India Thermoplastic Composites Market Revenue (Million) Forecast, by Application 2019 & 2032
- Table 78: India Thermoplastic Composites Market Volume (K Tons) Forecast, by Application 2019 & 2032
- Table 79: Japan Thermoplastic Composites Market Revenue (Million) Forecast, by Application 2019 & 2032
- Table 80: Japan Thermoplastic Composites Market Volume (K Tons) Forecast, by Application 2019 & 2032
- Table 81: South Korea Thermoplastic Composites Market Revenue (Million) Forecast, by Application 2019 & 2032
- Table 82: South Korea Thermoplastic Composites Market Volume (K Tons) Forecast, by Application 2019 & 2032
- Table 83: ASEAN Countries Thermoplastic Composites Market Revenue (Million) Forecast, by Application 2019 & 2032
- Table 84: ASEAN Countries Thermoplastic Composites Market Volume (K Tons) Forecast, by Application 2019 & 2032
- Table 85: Rest of Asia Pacific Thermoplastic Composites Market Revenue (Million) Forecast, by Application 2019 & 2032
- Table 86: Rest of Asia Pacific Thermoplastic Composites Market Volume (K Tons) Forecast, by Application 2019 & 2032
- Table 87: Global Thermoplastic Composites Market Revenue Million Forecast, by Resin Type 2019 & 2032
- Table 88: Global Thermoplastic Composites Market Volume K Tons Forecast, by Resin Type 2019 & 2032
- Table 89: Global Thermoplastic Composites Market Revenue Million Forecast, by Fiber Type 2019 & 2032
- Table 90: Global Thermoplastic Composites Market Volume K Tons Forecast, by Fiber Type 2019 & 2032
- Table 91: Global Thermoplastic Composites Market Revenue Million Forecast, by Product Type 2019 & 2032
- Table 92: Global Thermoplastic Composites Market Volume K Tons Forecast, by Product Type 2019 & 2032
- Table 93: Global Thermoplastic Composites Market Revenue Million Forecast, by End-user Industry 2019 & 2032
- Table 94: Global Thermoplastic Composites Market Volume K Tons Forecast, by End-user Industry 2019 & 2032
- Table 95: Global Thermoplastic Composites Market Revenue Million Forecast, by Country 2019 & 2032
- Table 96: Global Thermoplastic Composites Market Volume K Tons Forecast, by Country 2019 & 2032
- Table 97: United States Thermoplastic Composites Market Revenue (Million) Forecast, by Application 2019 & 2032
- Table 98: United States Thermoplastic Composites Market Volume (K Tons) Forecast, by Application 2019 & 2032
- Table 99: Canada Thermoplastic Composites Market Revenue (Million) Forecast, by Application 2019 & 2032
- Table 100: Canada Thermoplastic Composites Market Volume (K Tons) Forecast, by Application 2019 & 2032
- Table 101: Mexico Thermoplastic Composites Market Revenue (Million) Forecast, by Application 2019 & 2032
- Table 102: Mexico Thermoplastic Composites Market Volume (K Tons) Forecast, by Application 2019 & 2032
- Table 103: Global Thermoplastic Composites Market Revenue Million Forecast, by Resin Type 2019 & 2032
- Table 104: Global Thermoplastic Composites Market Volume K Tons Forecast, by Resin Type 2019 & 2032
- Table 105: Global Thermoplastic Composites Market Revenue Million Forecast, by Fiber Type 2019 & 2032
- Table 106: Global Thermoplastic Composites Market Volume K Tons Forecast, by Fiber Type 2019 & 2032
- Table 107: Global Thermoplastic Composites Market Revenue Million Forecast, by Product Type 2019 & 2032
- Table 108: Global Thermoplastic Composites Market Volume K Tons Forecast, by Product Type 2019 & 2032
- Table 109: Global Thermoplastic Composites Market Revenue Million Forecast, by End-user Industry 2019 & 2032
- Table 110: Global Thermoplastic Composites Market Volume K Tons Forecast, by End-user Industry 2019 & 2032
- Table 111: Global Thermoplastic Composites Market Revenue Million Forecast, by Country 2019 & 2032
- Table 112: Global Thermoplastic Composites Market Volume K Tons Forecast, by Country 2019 & 2032
- Table 113: Germany Thermoplastic Composites Market Revenue (Million) Forecast, by Application 2019 & 2032
- Table 114: Germany Thermoplastic Composites Market Volume (K Tons) Forecast, by Application 2019 & 2032
- Table 115: United Kingdom Thermoplastic Composites Market Revenue (Million) Forecast, by Application 2019 & 2032
- Table 116: United Kingdom Thermoplastic Composites Market Volume (K Tons) Forecast, by Application 2019 & 2032
- Table 117: France Thermoplastic Composites Market Revenue (Million) Forecast, by Application 2019 & 2032
- Table 118: France Thermoplastic Composites Market Volume (K Tons) Forecast, by Application 2019 & 2032
- Table 119: Italy Thermoplastic Composites Market Revenue (Million) Forecast, by Application 2019 & 2032
- Table 120: Italy Thermoplastic Composites Market Volume (K Tons) Forecast, by Application 2019 & 2032
- Table 121: Rest of Europe Thermoplastic Composites Market Revenue (Million) Forecast, by Application 2019 & 2032
- Table 122: Rest of Europe Thermoplastic Composites Market Volume (K Tons) Forecast, by Application 2019 & 2032
- Table 123: Global Thermoplastic Composites Market Revenue Million Forecast, by Resin Type 2019 & 2032
- Table 124: Global Thermoplastic Composites Market Volume K Tons Forecast, by Resin Type 2019 & 2032
- Table 125: Global Thermoplastic Composites Market Revenue Million Forecast, by Fiber Type 2019 & 2032
- Table 126: Global Thermoplastic Composites Market Volume K Tons Forecast, by Fiber Type 2019 & 2032
- Table 127: Global Thermoplastic Composites Market Revenue Million Forecast, by Product Type 2019 & 2032
- Table 128: Global Thermoplastic Composites Market Volume K Tons Forecast, by Product Type 2019 & 2032
- Table 129: Global Thermoplastic Composites Market Revenue Million Forecast, by End-user Industry 2019 & 2032
- Table 130: Global Thermoplastic Composites Market Volume K Tons Forecast, by End-user Industry 2019 & 2032
- Table 131: Global Thermoplastic Composites Market Revenue Million Forecast, by Country 2019 & 2032
- Table 132: Global Thermoplastic Composites Market Volume K Tons Forecast, by Country 2019 & 2032
- Table 133: Brazil Thermoplastic Composites Market Revenue (Million) Forecast, by Application 2019 & 2032
- Table 134: Brazil Thermoplastic Composites Market Volume (K Tons) Forecast, by Application 2019 & 2032
- Table 135: Argentina Thermoplastic Composites Market Revenue (Million) Forecast, by Application 2019 & 2032
- Table 136: Argentina Thermoplastic Composites Market Volume (K Tons) Forecast, by Application 2019 & 2032
- Table 137: Rest of South America Thermoplastic Composites Market Revenue (Million) Forecast, by Application 2019 & 2032
- Table 138: Rest of South America Thermoplastic Composites Market Volume (K Tons) Forecast, by Application 2019 & 2032
- Table 139: Global Thermoplastic Composites Market Revenue Million Forecast, by Resin Type 2019 & 2032
- Table 140: Global Thermoplastic Composites Market Volume K Tons Forecast, by Resin Type 2019 & 2032
- Table 141: Global Thermoplastic Composites Market Revenue Million Forecast, by Fiber Type 2019 & 2032
- Table 142: Global Thermoplastic Composites Market Volume K Tons Forecast, by Fiber Type 2019 & 2032
- Table 143: Global Thermoplastic Composites Market Revenue Million Forecast, by Product Type 2019 & 2032
- Table 144: Global Thermoplastic Composites Market Volume K Tons Forecast, by Product Type 2019 & 2032
- Table 145: Global Thermoplastic Composites Market Revenue Million Forecast, by End-user Industry 2019 & 2032
- Table 146: Global Thermoplastic Composites Market Volume K Tons Forecast, by End-user Industry 2019 & 2032
- Table 147: Global Thermoplastic Composites Market Revenue Million Forecast, by Country 2019 & 2032
- Table 148: Global Thermoplastic Composites Market Volume K Tons Forecast, by Country 2019 & 2032
- Table 149: Saudi Arabia Thermoplastic Composites Market Revenue (Million) Forecast, by Application 2019 & 2032
- Table 150: Saudi Arabia Thermoplastic Composites Market Volume (K Tons) Forecast, by Application 2019 & 2032
- Table 151: South Africa Thermoplastic Composites Market Revenue (Million) Forecast, by Application 2019 & 2032
- Table 152: South Africa Thermoplastic Composites Market Volume (K Tons) Forecast, by Application 2019 & 2032
- Table 153: Rest of Middle East and Africa Thermoplastic Composites Market Revenue (Million) Forecast, by Application 2019 & 2032
- Table 154: Rest of Middle East and Africa Thermoplastic Composites Market Volume (K Tons) Forecast, by Application 2019 & 2032
Frequently Asked Questions
1. What is the projected Compound Annual Growth Rate (CAGR) of the Thermoplastic Composites Market?
The projected CAGR is approximately 5.06%.
2. Which companies are prominent players in the Thermoplastic Composites Market?
Key companies in the market include SGL Carbon, Arkema SA, Solvay, Celanese Corporation, Avient Corporation, LANXESS, BASF SE, SABIC, DSM, Daicel Corporation, Toray Industries Inc, Mitsubishi Chemical Group Corporation, Hexcel Corporation, AVANCO Group, TechnoCompound GmbH, LyondellBasell Industries Holdings BV.
3. What are the main segments of the Thermoplastic Composites Market?
The market segments include Resin Type, Fiber Type, Product Type, End-user Industry.
4. Can you provide details about the market size?
The market size is estimated to be USD XX Million as of 2022.
5. What are some drivers contributing to market growth?
Increasing Demand from the Automotive Industry; Rising Consumption in the Construction Industry.
6. What are the notable trends driving market growth?
Automotive Industry to Dominate the Market.
7. Are there any restraints impacting market growth?
High Cost of Raw Materials and Challenges to Form Thermoplastic Composites; Other Restraints.
8. Can you provide examples of recent developments in the market?
April 2023: LANXESS announced the launch of a joint venture with Advent International focused on engineering materials, which began operations on April 1, 2023. DSM's Engineering Materials segment and LANXESS's former High-Performance Materials business joined forces to establish the new joint venture. LANXESS owns around 40% of the joint venture, while Advent International owns approximately 60%.
9. What pricing options are available for accessing the report?
Pricing options include single-user, multi-user, and enterprise licenses priced at USD 4750, USD 5250, and USD 8750 respectively.
10. Is the market size provided in terms of value or volume?
The market size is provided in terms of value, measured in Million and volume, measured in K Tons.
11. Are there any specific market keywords associated with the report?
Yes, the market keyword associated with the report is "Thermoplastic Composites Market," which aids in identifying and referencing the specific market segment covered.
12. How do I determine which pricing option suits my needs best?
The pricing options vary based on user requirements and access needs. Individual users may opt for single-user licenses, while businesses requiring broader access may choose multi-user or enterprise licenses for cost-effective access to the report.
13. Are there any additional resources or data provided in the Thermoplastic Composites Market report?
While the report offers comprehensive insights, it's advisable to review the specific contents or supplementary materials provided to ascertain if additional resources or data are available.
14. How can I stay updated on further developments or reports in the Thermoplastic Composites Market?
To stay informed about further developments, trends, and reports in the Thermoplastic Composites Market, consider subscribing to industry newsletters, following relevant companies and organizations, or regularly checking reputable industry news sources and publications.
Methodology
Step 1 - Identification of Relevant Samples Size from Population Database


Step 2 - Approaches for Defining Global Market Size (Value, Volume* & Price*)

Note*: In applicable scenarios
Step 3 - Data Sources
Primary Research
- Web Analytics
- Survey Reports
- Research Institute
- Latest Research Reports
- Opinion Leaders
Secondary Research
- Annual Reports
- White Paper
- Latest Press Release
- Industry Association
- Paid Database
- Investor Presentations

Step 4 - Data Triangulation
Involves using different sources of information in order to increase the validity of a study
These sources are likely to be stakeholders in a program - participants, other researchers, program staff, other community members, and so on.
Then we put all data in single framework & apply various statistical tools to find out the dynamic on the market.
During the analysis stage, feedback from the stakeholder groups would be compared to determine areas of agreement as well as areas of divergence


