

Key Insights
The global Testing, Inspection, and Certification (TIC) market is demonstrating significant expansion, propelled by stringent regulatory mandates, heightened consumer emphasis on product integrity, and expanding international commerce. This sector is projected to achieve a Compound Annual Growth Rate (CAGR) of 3.6% from 2025 to 2033, with the market size expected to reach 417.76 billion by the end of the forecast period. Key growth drivers include the integration of advanced automation and digital solutions, a growing commitment to sustainability and environmental stewardship, and a surge in demand for specialized TIC services across critical industries such as food & beverage, automotive, and healthcare. Leading organizations are reinforcing their market dominance through strategic mergers, acquisitions, and technology investments. Nevertheless, the industry contends with intense price pressures, fragmented regulatory frameworks, and the imperative to adapt to rapid technological evolution. The market's segmentation by industry and service type presents a complex yet opportunity-rich landscape for specialized providers.
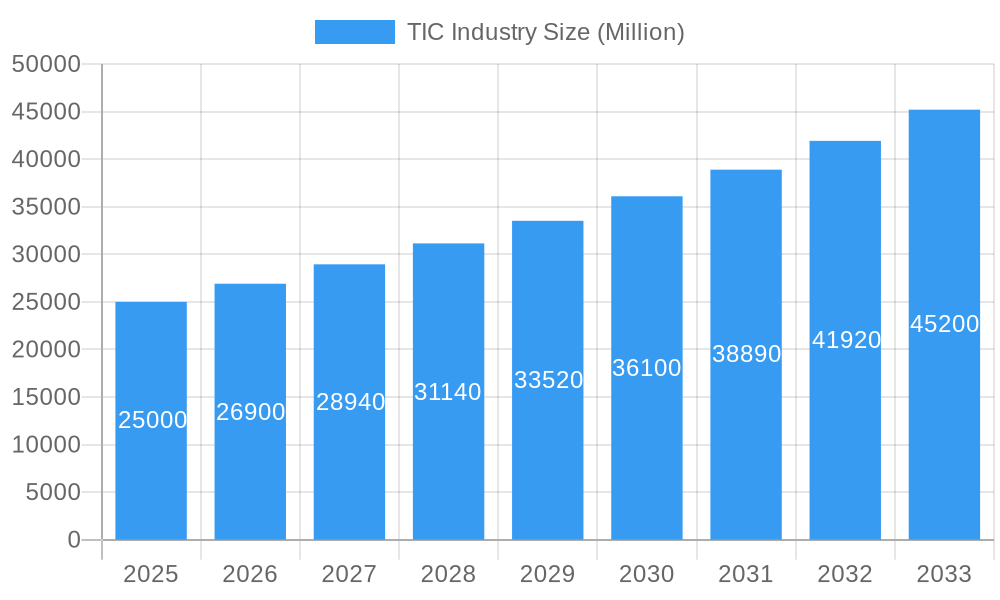
TIC Industry Market Size (In Billion)
Geographically, the TIC market's distribution is dynamic. Developed regions, including North America and Europe, currently lead in market share, while emerging economies in Asia and other developing territories exhibit substantial growth potential, driven by escalating industrialization and infrastructure development. The period leading up to the base year 2025 has laid a robust foundation for the ongoing expansion anticipated throughout the forecast period 2025-2033. This period offers considerable strategic opportunities for all stakeholders, provided they can effectively address industry challenges and leverage emerging trends in technology and consumer demand. A comprehensive understanding of these market dynamics is vital for both established TIC providers and new entrants aiming for competitive success in this evolving global sector.
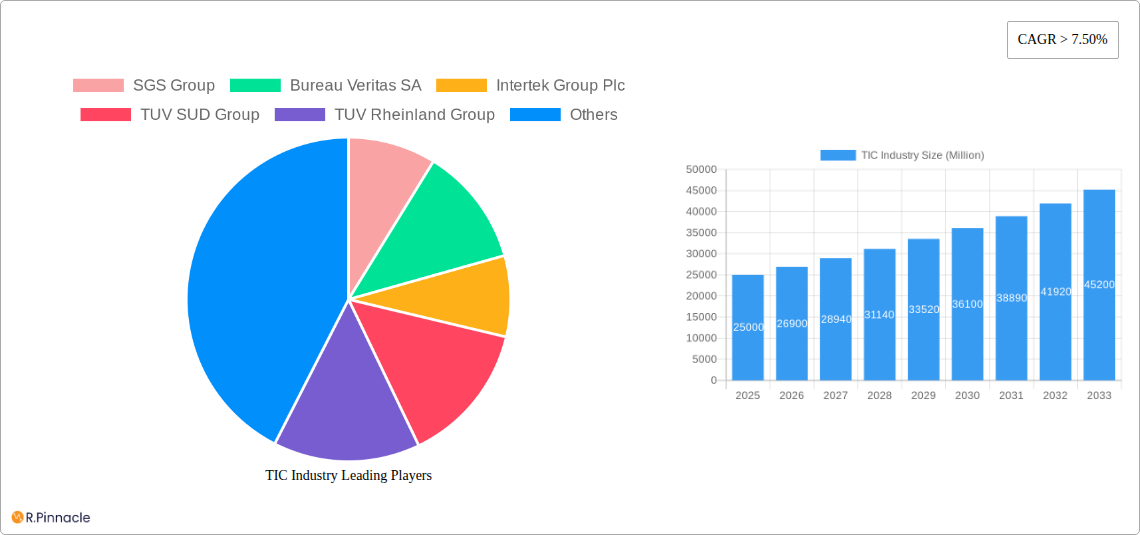
TIC Industry Company Market Share
TIC Industry Market Report: 2019-2033 - A Comprehensive Analysis
This comprehensive report provides an in-depth analysis of the Testing, Inspection, and Certification (TIC) industry, covering market size, growth drivers, competitive landscape, and future outlook. The study period spans from 2019 to 2033, with 2025 as the base and estimated year. This report is essential for industry professionals, investors, and anyone seeking to understand the dynamics of this rapidly evolving $XX Million market.
TIC Industry Market Structure & Innovation Trends
The global TIC market, valued at $XX Million in 2025, exhibits a moderately concentrated structure, with several multinational corporations holding significant market share. Key players such as SGS Group, Bureau Veritas SA, Intertek Group Plc, TÜV SÜD Group, and TÜV Rheinland Group dominate the landscape, accounting for an estimated XX% of the total market. However, numerous smaller, specialized players also exist, particularly in niche segments.
Market Concentration:
- High concentration among top players (XX% market share)
- Significant presence of regional and specialized firms
Innovation Drivers:
- Growing demand for quality and safety assurance across diverse industries.
- Technological advancements, particularly in digitalization and automation.
- Increasing regulatory scrutiny and standardization requirements.
Regulatory Frameworks:
- Stringent regulations across various sectors (e.g., food safety, environmental compliance) are key drivers.
- Variations in regulatory frameworks across regions influence market dynamics.
Product Substitutes:
- Limited direct substitutes exist, however, internal quality control measures can reduce dependence on external TIC services.
End-User Demographics:
- Diverse end-user base spanning manufacturing, healthcare, and infrastructure sectors.
- Growing demand from emerging economies drives expansion.
M&A Activities: The TIC sector has seen significant M&A activity in recent years, with deal values totaling $XX Million over the past five years. Consolidation is expected to continue, driven by economies of scale and expansion into new markets.
TIC Industry Market Dynamics & Trends
The TIC market is experiencing robust growth, driven by factors such as increasing globalization, stricter regulations, and rising consumer awareness of product quality and safety. The Compound Annual Growth Rate (CAGR) is projected to be XX% during the forecast period (2025-2033). This growth is fueled by several key trends:
- Technological Disruptions: Digitalization, automation, and AI are transforming the TIC industry, leading to improved efficiency and enhanced data analysis capabilities. Market penetration of digital TIC services is estimated at XX% in 2025, projected to reach XX% by 2033.
- Consumer Preferences: Heightened awareness of product safety and sustainability is driving demand for comprehensive TIC services. This is particularly evident in sectors such as food, textiles, and consumer electronics.
- Competitive Dynamics: Intense competition among major players necessitates continuous innovation and strategic partnerships.
Dominant Regions & Segments in TIC Industry
The Asia-Pacific region currently holds the largest market share in the TIC industry, driven by rapid industrialization, robust economic growth, and increasing government spending on infrastructure. Europe and North America also represent significant markets.
Key Drivers in Asia-Pacific:
- Rapid industrialization and infrastructure development.
- Rising consumer demand for quality and safety.
- Supportive government policies and regulations.
Dominance Analysis:
The region's dominance is a result of a combination of factors, including a large and growing manufacturing base, increasing consumer spending, and rising regulatory requirements. While developed markets in Europe and North America continue to be important, the dynamic growth in Asia is expected to continue driving overall market expansion. Specific countries such as China and India are key growth drivers within the Asia-Pacific region.
TIC Industry Product Innovations
Recent innovations in the TIC industry focus on digitalization and automation, such as AI-powered inspection systems, blockchain-based traceability solutions, and remote inspection technologies. These advancements enhance efficiency, reduce costs, and improve the accuracy and reliability of testing and certification services. The adoption of these technologies is gaining momentum, improving market fit and providing significant competitive advantages for early adopters.
Report Scope & Segmentation Analysis
This report segments the TIC market based on several key factors: service type (testing, inspection, certification), industry vertical (manufacturing, healthcare, etc.), and geographic region. Each segment demonstrates unique growth characteristics and competitive dynamics. The market size and growth projections for each segment are provided within the full report.
Key Drivers of TIC Industry Growth
The TIC industry's growth is primarily fueled by several interconnected factors:
- Stringent Regulations: Governments worldwide are implementing increasingly stringent regulations to ensure product safety and quality.
- Globalization: Increased global trade necessitates robust quality control and compliance mechanisms.
- Technological Advancements: Automation and digitalization increase efficiency and improve data analysis.
Challenges in the TIC Industry Sector
The TIC industry faces several challenges, including:
- Regulatory Complexity: Navigating diverse and often evolving regulatory landscapes can be costly and time-consuming.
- Supply Chain Disruptions: Global supply chain volatility can impact the availability of testing equipment and personnel.
- Intense Competition: Competition among large multinational corporations and specialized firms is intense.
Emerging Opportunities in TIC Industry
Several emerging opportunities exist for the TIC industry:
- Growth in Emerging Markets: Rapid industrialization in developing economies presents significant growth potential.
- New Technologies: The adoption of AI, IoT, and blockchain technologies creates new service offerings and efficiencies.
- Sustainability Focus: Growing emphasis on sustainability drives demand for eco-friendly testing and certification services.
Leading Players in the TIC Industry Market
- SGS Group
- Bureau Veritas SA
- Intertek Group Plc
- TUV SUD Group
- TUV Rheinland Group
- AsiaInspection Ltd
- British Standards Institution Group
- Keller-Frei Zurich
- Centre Testing International (CTI)
- Hohenstein Institute
- SAI Global Ltd
- TESTEX AG
- Eurofins Scientific
(List Not Exhaustive)
Key Developments in TIC Industry
- January 2022: SGS Group partners with Microsoft to develop a new digital TIC service.
- March 2022: TÜV Rheinland partners with The BHive to offer a seamless chemical testing and management solution for the textile industry.
Future Outlook for TIC Industry Market
The TIC industry is poised for continued growth, driven by technological advancements, increasing regulatory scrutiny, and expanding global trade. Strategic partnerships, investments in digital technologies, and expansion into new markets will be crucial for companies seeking to capitalize on future opportunities. The long-term outlook remains positive, with substantial growth potential across various segments and geographical regions.
TIC Industry Segmentation
-
1. Application
- 1.1. Textile Testing
- 1.2. Textile Inspection
- 1.3. Textile Certification
TIC Industry Segmentation By Geography
- 1. North America
- 2. Asia Pacific
- 3. Europe
- 4. Latin America
- 5. Middle East

TIC Industry Regional Market Share
Geographic Coverage of TIC Industry
TIC Industry REPORT HIGHLIGHTS
| Aspects | Details |
|---|---|
| Study Period | 2020-2034 |
| Base Year | 2025 |
| Estimated Year | 2026 |
| Forecast Period | 2026-2034 |
| Historical Period | 2020-2025 |
| Growth Rate | CAGR of 3.6% from 2020-2034 |
| Segmentation |
|
Table of Contents
- 1. Introduction
- 1.1. Research Scope
- 1.2. Market Segmentation
- 1.3. Research Objective
- 1.4. Definitions and Assumptions
- 2. Executive Summary
- 2.1. Market Snapshot
- 3. Market Dynamics
- 3.1. Market Drivers
- 3.2. Market Restrains
- 3.3. Market Trends
- 3.4. Market Opportunities
- 4. Market Factor Analysis
- 4.1. Porters Five Forces
- 4.1.1. Bargaining Power of Suppliers
- 4.1.2. Bargaining Power of Buyers
- 4.1.3. Threat of New Entrants
- 4.1.4. Threat of Substitutes
- 4.1.5. Competitive Rivalry
- 4.2. PESTEL analysis
- 4.3. BCG Analysis
- 4.3.1. Stars (High Growth, High Market Share)
- 4.3.2. Cash Cows (Low Growth, High Market Share)
- 4.3.3. Question Mark (High Growth, Low Market Share)
- 4.3.4. Dogs (Low Growth, Low Market Share)
- 4.4. Ansoff Matrix Analysis
- 4.5. Supply Chain Analysis
- 4.6. Regulatory Landscape
- 4.7. Current Market Potential and Opportunity Assessment (TAM–SAM–SOM Framework)
- 4.8. PRI Analyst Note
- 4.1. Porters Five Forces
- 5. Market Analysis, Insights and Forecast 2021-2033
- 5.1. Market Analysis, Insights and Forecast - by Application
- 5.1.1. Textile Testing
- 5.1.2. Textile Inspection
- 5.1.3. Textile Certification
- 5.2. Market Analysis, Insights and Forecast - by Region
- 5.2.1. North America
- 5.2.2. Asia Pacific
- 5.2.3. Europe
- 5.2.4. Latin America
- 5.2.5. Middle East
- 5.1. Market Analysis, Insights and Forecast - by Application
- 6. Global TIC Industry Analysis, Insights and Forecast, 2021-2033
- 6.1. Market Analysis, Insights and Forecast - by Application
- 6.1.1. Textile Testing
- 6.1.2. Textile Inspection
- 6.1.3. Textile Certification
- 6.1. Market Analysis, Insights and Forecast - by Application
- 7. North America TIC Industry Analysis, Insights and Forecast, 2020-2032
- 7.1. Market Analysis, Insights and Forecast - by Application
- 7.1.1. Textile Testing
- 7.1.2. Textile Inspection
- 7.1.3. Textile Certification
- 7.1. Market Analysis, Insights and Forecast - by Application
- 8. Asia Pacific TIC Industry Analysis, Insights and Forecast, 2020-2032
- 8.1. Market Analysis, Insights and Forecast - by Application
- 8.1.1. Textile Testing
- 8.1.2. Textile Inspection
- 8.1.3. Textile Certification
- 8.1. Market Analysis, Insights and Forecast - by Application
- 9. Europe TIC Industry Analysis, Insights and Forecast, 2020-2032
- 9.1. Market Analysis, Insights and Forecast - by Application
- 9.1.1. Textile Testing
- 9.1.2. Textile Inspection
- 9.1.3. Textile Certification
- 9.1. Market Analysis, Insights and Forecast - by Application
- 10. Latin America TIC Industry Analysis, Insights and Forecast, 2020-2032
- 10.1. Market Analysis, Insights and Forecast - by Application
- 10.1.1. Textile Testing
- 10.1.2. Textile Inspection
- 10.1.3. Textile Certification
- 10.1. Market Analysis, Insights and Forecast - by Application
- 11. Middle East TIC Industry Analysis, Insights and Forecast, 2020-2032
- 11.1. Market Analysis, Insights and Forecast - by Application
- 11.1.1. Textile Testing
- 11.1.2. Textile Inspection
- 11.1.3. Textile Certification
- 11.1. Market Analysis, Insights and Forecast - by Application
- 12. Competitive Analysis
- 12.1. Company Profiles
- 12.1.1 SGS Group
- 12.1.1.1. Company Overview
- 12.1.1.2. Products
- 12.1.1.3. Company Financials
- 12.1.1.4. SWOT Analysis
- 12.1.2 Bureau Veritas SA
- 12.1.2.1. Company Overview
- 12.1.2.2. Products
- 12.1.2.3. Company Financials
- 12.1.2.4. SWOT Analysis
- 12.1.3 Intertek Group Plc
- 12.1.3.1. Company Overview
- 12.1.3.2. Products
- 12.1.3.3. Company Financials
- 12.1.3.4. SWOT Analysis
- 12.1.4 TUV SUD Group
- 12.1.4.1. Company Overview
- 12.1.4.2. Products
- 12.1.4.3. Company Financials
- 12.1.4.4. SWOT Analysis
- 12.1.5 TUV Rheinland Group
- 12.1.5.1. Company Overview
- 12.1.5.2. Products
- 12.1.5.3. Company Financials
- 12.1.5.4. SWOT Analysis
- 12.1.6 AsiaInspection Ltd
- 12.1.6.1. Company Overview
- 12.1.6.2. Products
- 12.1.6.3. Company Financials
- 12.1.6.4. SWOT Analysis
- 12.1.7 British Standards Institution Group
- 12.1.7.1. Company Overview
- 12.1.7.2. Products
- 12.1.7.3. Company Financials
- 12.1.7.4. SWOT Analysis
- 12.1.8 Keller-Frei Zurich
- 12.1.8.1. Company Overview
- 12.1.8.2. Products
- 12.1.8.3. Company Financials
- 12.1.8.4. SWOT Analysis
- 12.1.9 Centre Testing International (CTI)
- 12.1.9.1. Company Overview
- 12.1.9.2. Products
- 12.1.9.3. Company Financials
- 12.1.9.4. SWOT Analysis
- 12.1.10 Hohenstein Institute
- 12.1.10.1. Company Overview
- 12.1.10.2. Products
- 12.1.10.3. Company Financials
- 12.1.10.4. SWOT Analysis
- 12.1.11 SAI Global Ltd
- 12.1.11.1. Company Overview
- 12.1.11.2. Products
- 12.1.11.3. Company Financials
- 12.1.11.4. SWOT Analysis
- 12.1.12 TESTEX AG
- 12.1.12.1. Company Overview
- 12.1.12.2. Products
- 12.1.12.3. Company Financials
- 12.1.12.4. SWOT Analysis
- 12.1.13 Eurofins Scientific**List Not Exhaustive
- 12.1.13.1. Company Overview
- 12.1.13.2. Products
- 12.1.13.3. Company Financials
- 12.1.13.4. SWOT Analysis
- 12.1.1 SGS Group
- 12.2. Market Entropy
- 12.2.1 Company's Key Areas Served
- 12.2.2 Recent Developments
- 12.3. Company Market Share Analysis 2025
- 12.3.1 Top 5 Companies Market Share Analysis
- 12.3.2 Top 3 Companies Market Share Analysis
- 12.4. List of Potential Customers
- 13. Research Methodology
List of Figures
- Figure 1: Global TIC Industry Revenue Breakdown (billion, %) by Region 2025 & 2033
- Figure 2: North America TIC Industry Revenue (billion), by Application 2025 & 2033
- Figure 3: North America TIC Industry Revenue Share (%), by Application 2025 & 2033
- Figure 4: North America TIC Industry Revenue (billion), by Country 2025 & 2033
- Figure 5: North America TIC Industry Revenue Share (%), by Country 2025 & 2033
- Figure 6: Asia Pacific TIC Industry Revenue (billion), by Application 2025 & 2033
- Figure 7: Asia Pacific TIC Industry Revenue Share (%), by Application 2025 & 2033
- Figure 8: Asia Pacific TIC Industry Revenue (billion), by Country 2025 & 2033
- Figure 9: Asia Pacific TIC Industry Revenue Share (%), by Country 2025 & 2033
- Figure 10: Europe TIC Industry Revenue (billion), by Application 2025 & 2033
- Figure 11: Europe TIC Industry Revenue Share (%), by Application 2025 & 2033
- Figure 12: Europe TIC Industry Revenue (billion), by Country 2025 & 2033
- Figure 13: Europe TIC Industry Revenue Share (%), by Country 2025 & 2033
- Figure 14: Latin America TIC Industry Revenue (billion), by Application 2025 & 2033
- Figure 15: Latin America TIC Industry Revenue Share (%), by Application 2025 & 2033
- Figure 16: Latin America TIC Industry Revenue (billion), by Country 2025 & 2033
- Figure 17: Latin America TIC Industry Revenue Share (%), by Country 2025 & 2033
- Figure 18: Middle East TIC Industry Revenue (billion), by Application 2025 & 2033
- Figure 19: Middle East TIC Industry Revenue Share (%), by Application 2025 & 2033
- Figure 20: Middle East TIC Industry Revenue (billion), by Country 2025 & 2033
- Figure 21: Middle East TIC Industry Revenue Share (%), by Country 2025 & 2033
List of Tables
- Table 1: Global TIC Industry Revenue billion Forecast, by Application 2020 & 2033
- Table 2: Global TIC Industry Revenue billion Forecast, by Region 2020 & 2033
- Table 3: Global TIC Industry Revenue billion Forecast, by Application 2020 & 2033
- Table 4: Global TIC Industry Revenue billion Forecast, by Country 2020 & 2033
- Table 5: Global TIC Industry Revenue billion Forecast, by Application 2020 & 2033
- Table 6: Global TIC Industry Revenue billion Forecast, by Country 2020 & 2033
- Table 7: Global TIC Industry Revenue billion Forecast, by Application 2020 & 2033
- Table 8: Global TIC Industry Revenue billion Forecast, by Country 2020 & 2033
- Table 9: Global TIC Industry Revenue billion Forecast, by Application 2020 & 2033
- Table 10: Global TIC Industry Revenue billion Forecast, by Country 2020 & 2033
- Table 11: Global TIC Industry Revenue billion Forecast, by Application 2020 & 2033
- Table 12: Global TIC Industry Revenue billion Forecast, by Country 2020 & 2033
Frequently Asked Questions
1. What is the projected Compound Annual Growth Rate (CAGR) of the TIC Industry?
The projected CAGR is approximately 3.6%.
2. Which companies are prominent players in the TIC Industry?
Key companies in the market include SGS Group, Bureau Veritas SA, Intertek Group Plc, TUV SUD Group, TUV Rheinland Group, AsiaInspection Ltd, British Standards Institution Group, Keller-Frei Zurich, Centre Testing International (CTI), Hohenstein Institute, SAI Global Ltd, TESTEX AG, Eurofins Scientific**List Not Exhaustive.
3. What are the main segments of the TIC Industry?
The market segments include Application.
4. Can you provide details about the market size?
The market size is estimated to be USD 417.76 billion as of 2022.
5. What are some drivers contributing to market growth?
N/A
6. What are the notable trends driving market growth?
Trade of Textile Products Driving the Market.
7. Are there any restraints impacting market growth?
N/A
8. Can you provide examples of recent developments in the market?
Jan 2022: Switzerland-based testing and certification group SGS announced a partnership with Microsoft to develop a new digital TIC service. This collaboration will leverage Microsoft's cross-industry expertise, advanced data solutions and productivity platforms, integrated with SGS's global service network and leading industry capabilities to develop innovative solutions for customers in the Testing, Inspection and Certification (TIC) industry .
9. What pricing options are available for accessing the report?
Pricing options include single-user, multi-user, and enterprise licenses priced at USD 4750, USD 5250, and USD 8750 respectively.
10. Is the market size provided in terms of value or volume?
The market size is provided in terms of value, measured in billion.
11. Are there any specific market keywords associated with the report?
Yes, the market keyword associated with the report is "TIC Industry," which aids in identifying and referencing the specific market segment covered.
12. How do I determine which pricing option suits my needs best?
The pricing options vary based on user requirements and access needs. Individual users may opt for single-user licenses, while businesses requiring broader access may choose multi-user or enterprise licenses for cost-effective access to the report.
13. Are there any additional resources or data provided in the TIC Industry report?
While the report offers comprehensive insights, it's advisable to review the specific contents or supplementary materials provided to ascertain if additional resources or data are available.
14. How can I stay updated on further developments or reports in the TIC Industry?
To stay informed about further developments, trends, and reports in the TIC Industry, consider subscribing to industry newsletters, following relevant companies and organizations, or regularly checking reputable industry news sources and publications.
Methodology
Step 1 - Identification of Relevant Samples Size from Population Database


Step 2 - Approaches for Defining Global Market Size (Value, Volume* & Price*)

Note*: In applicable scenarios
Step 3 - Data Sources
Primary Research
- Web Analytics
- Survey Reports
- Research Institute
- Latest Research Reports
- Opinion Leaders
Secondary Research
- Annual Reports
- White Paper
- Latest Press Release
- Industry Association
- Paid Database
- Investor Presentations

Step 4 - Data Triangulation
Involves using different sources of information in order to increase the validity of a study
These sources are likely to be stakeholders in a program - participants, other researchers, program staff, other community members, and so on.
Then we put all data in single framework & apply various statistical tools to find out the dynamic on the market.
During the analysis stage, feedback from the stakeholder groups would be compared to determine areas of agreement as well as areas of divergence