
Key Insights
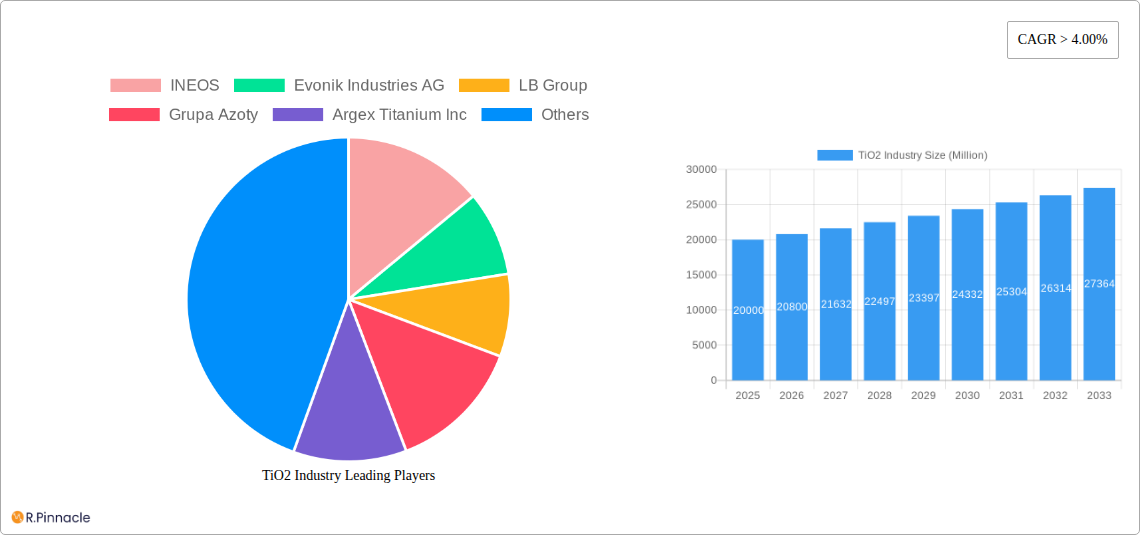
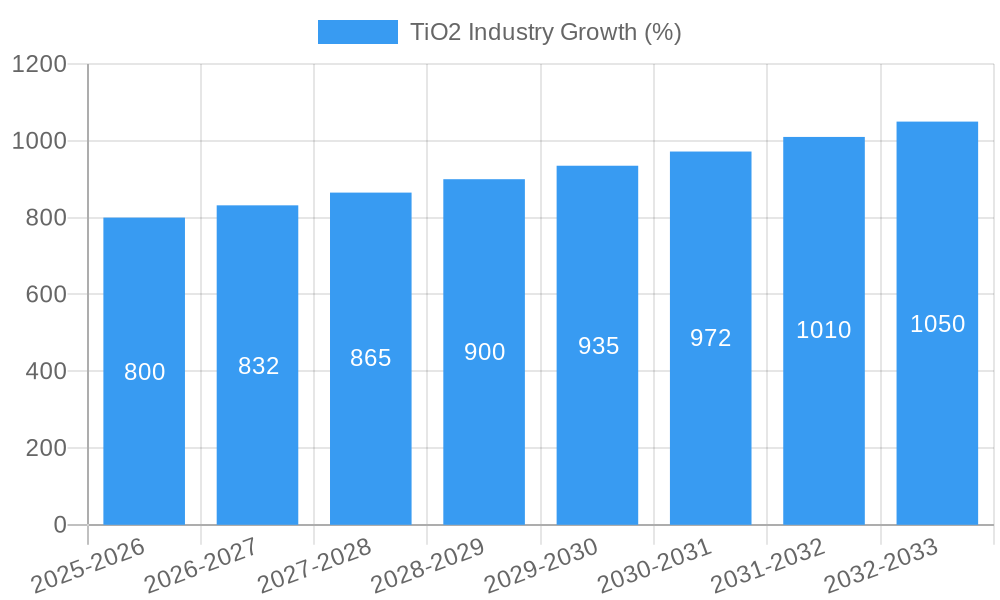
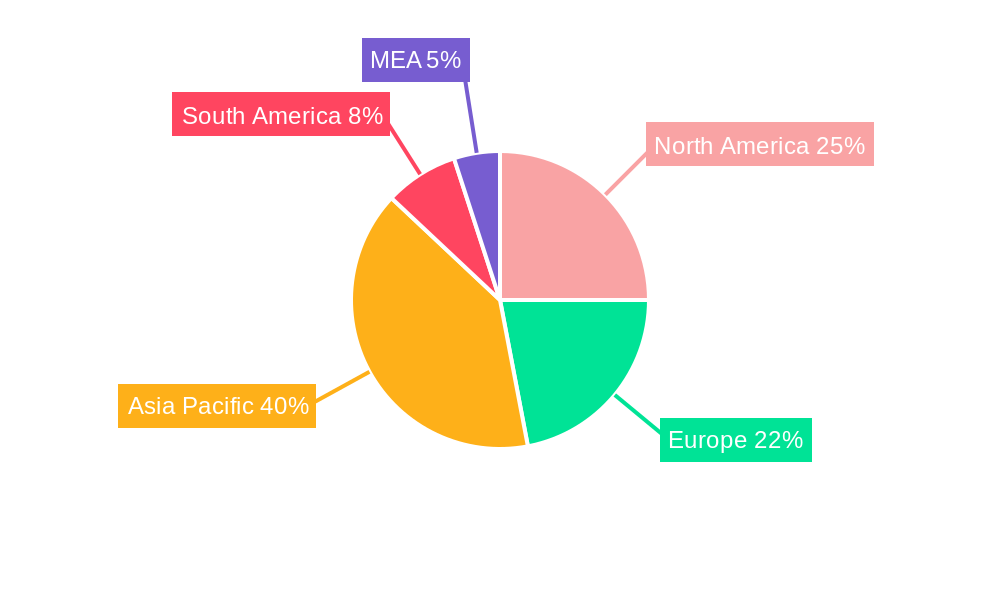
The global titanium dioxide (TiO2) market, valued at approximately $20 billion in 2025, is projected to experience robust growth, exceeding a 4% CAGR through 2033. This expansion is driven primarily by the increasing demand from key application sectors. The paints and coatings industry remains the dominant consumer, fueled by the construction boom and rising aesthetic preferences. Growth in the plastics industry, particularly in packaging and consumer goods, also significantly contributes to TiO2 demand. Furthermore, the paper and pulp sector, albeit with slower growth compared to other sectors, continues to utilize TiO2 for brightness and opacity enhancement. The cosmetics industry represents a niche market with steady growth, driven by the increasing demand for high-quality skincare and makeup products. While regulations surrounding TiO2 usage in certain applications (e.g., some sunscreens) present a restraint, innovation in alternative formulations and sustainable production methods is mitigating this impact. The market is segmented by grade (rutile and anatase) and application, with rutile dominating due to its superior properties. Key players, such as INEOS, Evonik Industries AG, and Tronox Holdings PLC, are strategically investing in capacity expansion and technological advancements to maintain market share and meet growing demands. Regional growth varies, with Asia-Pacific exhibiting the highest growth rate due to rapid industrialization and urbanization, particularly in China and India. North America and Europe maintain significant market shares, driven by established manufacturing and consumption patterns.
The competitive landscape is characterized by both large multinational corporations and specialized producers. Companies are focusing on diversification of product portfolio, strategic partnerships, and mergers and acquisitions to enhance their market position. Furthermore, sustainability initiatives are becoming increasingly important, with companies focusing on reducing their carbon footprint and developing eco-friendly TiO2 production processes. The forecast period will see continued growth in demand driven by several factors, including infrastructure development across various regions, increasing disposable incomes in developing countries, and innovations in material science and coating technologies. However, raw material price fluctuations and potential environmental regulations will likely influence the market dynamics in the coming years.
TiO2 Industry Report: 2019-2033 Market Analysis & Forecast
This comprehensive report provides a detailed analysis of the TiO2 industry, covering market size, growth drivers, competitive landscape, and future outlook. The study period spans from 2019 to 2033, with 2025 serving as the base and estimated year. This report is essential for industry professionals, investors, and anyone seeking a deep understanding of this dynamic market.
TiO2 Industry Market Structure & Innovation Trends
The TiO2 market is moderately concentrated, with several major players holding significant market share. INEOS, Evonik Industries AG, and Tronox Holdings PLC are among the leading companies, collectively accounting for approximately xx% of the global market in 2024. Market share dynamics are influenced by factors such as production capacity, technological advancements, and strategic acquisitions. Innovation is driven by the need for enhanced pigment properties (brightness, opacity, durability), cost reduction through process optimization, and the development of sustainable production methods. Regulatory frameworks, particularly concerning environmental regulations and product safety, significantly impact industry operations. Product substitutes, such as alternative pigments and coatings, pose a competitive threat, albeit a limited one due to TiO2's superior performance characteristics in many applications. End-user demographics, particularly in the paints and coatings sector, drive demand, with growth influenced by construction activity and consumer preferences. M&A activity has been moderate in recent years, with deal values ranging from USD xx Million to USD xx Million, primarily focused on expanding production capacity and gaining access to new technologies or markets.
TiO2 Industry Market Dynamics & Trends
The TiO2 market is projected to experience a Compound Annual Growth Rate (CAGR) of xx% during the forecast period (2025-2033). Key growth drivers include increasing demand from the paints and coatings sector, fueled by robust global construction activity and rising infrastructure development. Technological disruptions, such as advancements in pigment synthesis and surface treatment technologies, are leading to improved product performance and efficiency gains. Consumer preferences for environmentally friendly products are driving the adoption of sustainable TiO2 production methods and increasing demand for low-VOC coatings. Competitive dynamics are characterized by price competition, product differentiation, and continuous innovation. Market penetration in emerging economies remains substantial, with significant growth potential.
Dominant Regions & Segments in TiO2 Industry
Asia-Pacific is the dominant region in the TiO2 market, driven by robust economic growth, expanding infrastructure projects, and a burgeoning construction sector. Within this region, China stands out as the leading consumer.
Grade: Rutile grade TiO2 holds a larger market share compared to anatase, due to its superior properties such as higher brightness and opacity.
Application: Paints and coatings constitute the largest application segment, accounting for over xx% of global TiO2 consumption. This is followed by plastics, paper and pulp, cosmetics, and other applications, with plastics showing significant growth potential in emerging markets.
Key Drivers (Asia-Pacific):
- Rapid urbanization and infrastructure development.
- Strong economic growth driving construction activity.
- Increasing disposable incomes and consumer spending.
TiO2 Industry Product Innovations
Recent product innovations focus on enhancing TiO2's performance characteristics, such as improved brightness, opacity, and dispersibility, while minimizing environmental impact. Developments in surface treatment technologies and nanoparticle synthesis are leading to higher-performance pigments with improved cost-effectiveness. These advancements cater to the growing demand for sustainable and high-performance coatings across diverse applications, boosting market competitiveness.
Report Scope & Segmentation Analysis
This report segments the TiO2 market by grade (Rutile and Anatase) and application (Paints and Coatings, Plastics, Paper and Pulp, Cosmetics, and Other Applications). Each segment's growth projections, market sizes, and competitive dynamics are analyzed. The Rutile segment is expected to witness a xx% CAGR, driven by its superior properties. The Paints and Coatings segment dominates the application market, with strong growth anticipated in the forecast period. The Plastics segment demonstrates promising growth potential due to increasing demand in the packaging and automotive sectors. The Paper and Pulp segment exhibits steady growth, while the Cosmetics segment displays a relatively moderate growth trajectory. Lastly, the Other Applications segment showcases niche growth prospects.
Key Drivers of TiO2 Industry Growth
The TiO2 industry's growth is primarily driven by several factors: increasing demand from the construction sector, particularly in emerging economies, advancements in TiO2 synthesis and surface treatment technologies resulting in enhanced product performance, and the expanding use of TiO2 in various applications such as high-performance coatings, plastics, and cosmetics. Stringent environmental regulations are also pushing for the development of more sustainable production methods, stimulating innovation.
Challenges in the TiO2 Industry Sector
The TiO2 industry faces challenges such as fluctuating raw material prices (e.g., ilmenite), stringent environmental regulations leading to increased compliance costs, and intense competition among established players, causing price pressure. Supply chain disruptions can also significantly impact production and profitability. These factors can constrain market growth and profitability.
Emerging Opportunities in TiO2 Industry
Emerging opportunities lie in the development of high-performance TiO2 pigments with enhanced properties, the growth of the bio-based TiO2 market, expanding applications in renewable energy technologies (solar cells, etc.), and the increasing demand for sustainable and environmentally friendly production methods. These factors present significant growth potential in the coming years.
Leading Players in the TiO2 Industry Market
- INEOS
- Evonik Industries AG
- LB Group
- Grupa Azoty
- Argex Titanium Inc
- Kemipex
- Venator Materials PLC
- TAYCA
- The Chemours Company
- Tronox Holdings PLC
- Precheza
- KRONOS Worldwide Inc
- The Kish Company Inc
Key Developments in TiO2 Industry
- August 2022: Chemours commenced mining at its new Florida sand mine, boosting TiO2 production capacity.
- January 2022: LB Group invested USD 157.6 Million in a new 200ktpa TiO2 pigment finishing plant in Xiangyang, China.
Future Outlook for TiO2 Industry Market
The TiO2 market is poised for continued growth, driven by robust demand from key application sectors, particularly paints and coatings. Technological advancements, the adoption of sustainable production methods, and expansion into new and emerging markets are set to further fuel market expansion. Strategic partnerships, acquisitions, and capacity expansions will play a crucial role in shaping the industry landscape. The focus on sustainability and innovation will continue to drive market evolution.
TiO2 Industry Segmentation
-
1. Grade
- 1.1. Rutile
- 1.2. Anatase
-
2. Application
- 2.1. Paints and Coatings
- 2.2. Plastics
- 2.3. Paper and Pulp
- 2.4. Cosmetics
- 2.5. Other Applications (Leather, Textiles)
TiO2 Industry Segmentation By Geography
-
1. Asia Pacific
- 1.1. China
- 1.2. India
- 1.3. Japan
- 1.4. South Korea
- 1.5. Rest of Asia Pacific
-
2. North America
- 2.1. United States
- 2.2. Canada
- 2.3. Mexico
-
3. Europe
- 3.1. Germany
- 3.2. United Kingdom
- 3.3. France
- 3.4. Italy
- 3.5. Rest of Europe
-
4. South America
- 4.1. Brazil
- 4.2. Argentina
- 4.3. Rest of South America
-
5. Middle East and Africa
- 5.1. Saudi Arabia
- 5.2. South Africa
- 5.3. Rest of Middle East and Africa
TiO2 Industry REPORT HIGHLIGHTS
| Aspects | Details |
|---|---|
| Study Period | 2019-2033 |
| Base Year | 2024 |
| Estimated Year | 2025 |
| Forecast Period | 2025-2033 |
| Historical Period | 2019-2024 |
| Growth Rate | CAGR of > 4.00% from 2019-2033 |
| Segmentation |
|
Table of Contents
- 1. Introduction
- 1.1. Research Scope
- 1.2. Market Segmentation
- 1.3. Research Methodology
- 1.4. Definitions and Assumptions
- 2. Executive Summary
- 2.1. Introduction
- 3. Market Dynamics
- 3.1. Introduction
- 3.2. Market Drivers
- 3.2.1. Rapidly Increasing Demand for Paints and Coatings; Other Drivers
- 3.3. Market Restrains
- 3.3.1. Toxicity and Stringent Environmental Policies of Titanium Dioxide; Other Restraints
- 3.4. Market Trends
- 3.4.1. Paints and Coatings Segment is Expected to Dominate the Market
- 4. Market Factor Analysis
- 4.1. Porters Five Forces
- 4.2. Supply/Value Chain
- 4.3. PESTEL analysis
- 4.4. Market Entropy
- 4.5. Patent/Trademark Analysis
- 5. Global TiO2 Industry Analysis, Insights and Forecast, 2019-2031
- 5.1. Market Analysis, Insights and Forecast - by Grade
- 5.1.1. Rutile
- 5.1.2. Anatase
- 5.2. Market Analysis, Insights and Forecast - by Application
- 5.2.1. Paints and Coatings
- 5.2.2. Plastics
- 5.2.3. Paper and Pulp
- 5.2.4. Cosmetics
- 5.2.5. Other Applications (Leather, Textiles)
- 5.3. Market Analysis, Insights and Forecast - by Region
- 5.3.1. Asia Pacific
- 5.3.2. North America
- 5.3.3. Europe
- 5.3.4. South America
- 5.3.5. Middle East and Africa
- 5.1. Market Analysis, Insights and Forecast - by Grade
- 6. Asia Pacific TiO2 Industry Analysis, Insights and Forecast, 2019-2031
- 6.1. Market Analysis, Insights and Forecast - by Grade
- 6.1.1. Rutile
- 6.1.2. Anatase
- 6.2. Market Analysis, Insights and Forecast - by Application
- 6.2.1. Paints and Coatings
- 6.2.2. Plastics
- 6.2.3. Paper and Pulp
- 6.2.4. Cosmetics
- 6.2.5. Other Applications (Leather, Textiles)
- 6.1. Market Analysis, Insights and Forecast - by Grade
- 7. North America TiO2 Industry Analysis, Insights and Forecast, 2019-2031
- 7.1. Market Analysis, Insights and Forecast - by Grade
- 7.1.1. Rutile
- 7.1.2. Anatase
- 7.2. Market Analysis, Insights and Forecast - by Application
- 7.2.1. Paints and Coatings
- 7.2.2. Plastics
- 7.2.3. Paper and Pulp
- 7.2.4. Cosmetics
- 7.2.5. Other Applications (Leather, Textiles)
- 7.1. Market Analysis, Insights and Forecast - by Grade
- 8. Europe TiO2 Industry Analysis, Insights and Forecast, 2019-2031
- 8.1. Market Analysis, Insights and Forecast - by Grade
- 8.1.1. Rutile
- 8.1.2. Anatase
- 8.2. Market Analysis, Insights and Forecast - by Application
- 8.2.1. Paints and Coatings
- 8.2.2. Plastics
- 8.2.3. Paper and Pulp
- 8.2.4. Cosmetics
- 8.2.5. Other Applications (Leather, Textiles)
- 8.1. Market Analysis, Insights and Forecast - by Grade
- 9. South America TiO2 Industry Analysis, Insights and Forecast, 2019-2031
- 9.1. Market Analysis, Insights and Forecast - by Grade
- 9.1.1. Rutile
- 9.1.2. Anatase
- 9.2. Market Analysis, Insights and Forecast - by Application
- 9.2.1. Paints and Coatings
- 9.2.2. Plastics
- 9.2.3. Paper and Pulp
- 9.2.4. Cosmetics
- 9.2.5. Other Applications (Leather, Textiles)
- 9.1. Market Analysis, Insights and Forecast - by Grade
- 10. Middle East and Africa TiO2 Industry Analysis, Insights and Forecast, 2019-2031
- 10.1. Market Analysis, Insights and Forecast - by Grade
- 10.1.1. Rutile
- 10.1.2. Anatase
- 10.2. Market Analysis, Insights and Forecast - by Application
- 10.2.1. Paints and Coatings
- 10.2.2. Plastics
- 10.2.3. Paper and Pulp
- 10.2.4. Cosmetics
- 10.2.5. Other Applications (Leather, Textiles)
- 10.1. Market Analysis, Insights and Forecast - by Grade
- 11. North America TiO2 Industry Analysis, Insights and Forecast, 2019-2031
- 11.1. Market Analysis, Insights and Forecast - By Country/Sub-region
- 11.1.1 United States
- 11.1.2 Canada
- 11.1.3 Mexico
- 12. Europe TiO2 Industry Analysis, Insights and Forecast, 2019-2031
- 12.1. Market Analysis, Insights and Forecast - By Country/Sub-region
- 12.1.1 Germany
- 12.1.2 France
- 12.1.3 Italy
- 12.1.4 United Kingdom
- 12.1.5 Netherlands
- 12.1.6 Rest of Europe
- 13. Asia Pacific TiO2 Industry Analysis, Insights and Forecast, 2019-2031
- 13.1. Market Analysis, Insights and Forecast - By Country/Sub-region
- 13.1.1 China
- 13.1.2 Japan
- 13.1.3 India
- 13.1.4 South Korea
- 13.1.5 Taiwan
- 13.1.6 Australia
- 13.1.7 Rest of Asia-Pacific
- 14. South America TiO2 Industry Analysis, Insights and Forecast, 2019-2031
- 14.1. Market Analysis, Insights and Forecast - By Country/Sub-region
- 14.1.1 Brazil
- 14.1.2 Argentina
- 14.1.3 Rest of South America
- 15. MEA TiO2 Industry Analysis, Insights and Forecast, 2019-2031
- 15.1. Market Analysis, Insights and Forecast - By Country/Sub-region
- 15.1.1 Middle East
- 15.1.2 Africa
- 16. Competitive Analysis
- 16.1. Global Market Share Analysis 2024
- 16.2. Company Profiles
- 16.2.1 INEOS
- 16.2.1.1. Overview
- 16.2.1.2. Products
- 16.2.1.3. SWOT Analysis
- 16.2.1.4. Recent Developments
- 16.2.1.5. Financials (Based on Availability)
- 16.2.2 Evonik Industries AG
- 16.2.2.1. Overview
- 16.2.2.2. Products
- 16.2.2.3. SWOT Analysis
- 16.2.2.4. Recent Developments
- 16.2.2.5. Financials (Based on Availability)
- 16.2.3 LB Group
- 16.2.3.1. Overview
- 16.2.3.2. Products
- 16.2.3.3. SWOT Analysis
- 16.2.3.4. Recent Developments
- 16.2.3.5. Financials (Based on Availability)
- 16.2.4 Grupa Azoty
- 16.2.4.1. Overview
- 16.2.4.2. Products
- 16.2.4.3. SWOT Analysis
- 16.2.4.4. Recent Developments
- 16.2.4.5. Financials (Based on Availability)
- 16.2.5 Argex Titanium Inc
- 16.2.5.1. Overview
- 16.2.5.2. Products
- 16.2.5.3. SWOT Analysis
- 16.2.5.4. Recent Developments
- 16.2.5.5. Financials (Based on Availability)
- 16.2.6 Kemipex
- 16.2.6.1. Overview
- 16.2.6.2. Products
- 16.2.6.3. SWOT Analysis
- 16.2.6.4. Recent Developments
- 16.2.6.5. Financials (Based on Availability)
- 16.2.7 Venator Materials PLC
- 16.2.7.1. Overview
- 16.2.7.2. Products
- 16.2.7.3. SWOT Analysis
- 16.2.7.4. Recent Developments
- 16.2.7.5. Financials (Based on Availability)
- 16.2.8 TAYCA
- 16.2.8.1. Overview
- 16.2.8.2. Products
- 16.2.8.3. SWOT Analysis
- 16.2.8.4. Recent Developments
- 16.2.8.5. Financials (Based on Availability)
- 16.2.9 The Chemours Company
- 16.2.9.1. Overview
- 16.2.9.2. Products
- 16.2.9.3. SWOT Analysis
- 16.2.9.4. Recent Developments
- 16.2.9.5. Financials (Based on Availability)
- 16.2.10 Tronox Holdings PLC
- 16.2.10.1. Overview
- 16.2.10.2. Products
- 16.2.10.3. SWOT Analysis
- 16.2.10.4. Recent Developments
- 16.2.10.5. Financials (Based on Availability)
- 16.2.11 Precheza
- 16.2.11.1. Overview
- 16.2.11.2. Products
- 16.2.11.3. SWOT Analysis
- 16.2.11.4. Recent Developments
- 16.2.11.5. Financials (Based on Availability)
- 16.2.12 KRONOS Worldwide Inc
- 16.2.12.1. Overview
- 16.2.12.2. Products
- 16.2.12.3. SWOT Analysis
- 16.2.12.4. Recent Developments
- 16.2.12.5. Financials (Based on Availability)
- 16.2.13 The Kish Company Inc
- 16.2.13.1. Overview
- 16.2.13.2. Products
- 16.2.13.3. SWOT Analysis
- 16.2.13.4. Recent Developments
- 16.2.13.5. Financials (Based on Availability)
- 16.2.1 INEOS
List of Figures
- Figure 1: Global TiO2 Industry Revenue Breakdown (Million, %) by Region 2024 & 2032
- Figure 2: Global TiO2 Industry Volume Breakdown (K Tons, %) by Region 2024 & 2032
- Figure 3: North America TiO2 Industry Revenue (Million), by Country 2024 & 2032
- Figure 4: North America TiO2 Industry Volume (K Tons), by Country 2024 & 2032
- Figure 5: North America TiO2 Industry Revenue Share (%), by Country 2024 & 2032
- Figure 6: North America TiO2 Industry Volume Share (%), by Country 2024 & 2032
- Figure 7: Europe TiO2 Industry Revenue (Million), by Country 2024 & 2032
- Figure 8: Europe TiO2 Industry Volume (K Tons), by Country 2024 & 2032
- Figure 9: Europe TiO2 Industry Revenue Share (%), by Country 2024 & 2032
- Figure 10: Europe TiO2 Industry Volume Share (%), by Country 2024 & 2032
- Figure 11: Asia Pacific TiO2 Industry Revenue (Million), by Country 2024 & 2032
- Figure 12: Asia Pacific TiO2 Industry Volume (K Tons), by Country 2024 & 2032
- Figure 13: Asia Pacific TiO2 Industry Revenue Share (%), by Country 2024 & 2032
- Figure 14: Asia Pacific TiO2 Industry Volume Share (%), by Country 2024 & 2032
- Figure 15: South America TiO2 Industry Revenue (Million), by Country 2024 & 2032
- Figure 16: South America TiO2 Industry Volume (K Tons), by Country 2024 & 2032
- Figure 17: South America TiO2 Industry Revenue Share (%), by Country 2024 & 2032
- Figure 18: South America TiO2 Industry Volume Share (%), by Country 2024 & 2032
- Figure 19: MEA TiO2 Industry Revenue (Million), by Country 2024 & 2032
- Figure 20: MEA TiO2 Industry Volume (K Tons), by Country 2024 & 2032
- Figure 21: MEA TiO2 Industry Revenue Share (%), by Country 2024 & 2032
- Figure 22: MEA TiO2 Industry Volume Share (%), by Country 2024 & 2032
- Figure 23: Asia Pacific TiO2 Industry Revenue (Million), by Grade 2024 & 2032
- Figure 24: Asia Pacific TiO2 Industry Volume (K Tons), by Grade 2024 & 2032
- Figure 25: Asia Pacific TiO2 Industry Revenue Share (%), by Grade 2024 & 2032
- Figure 26: Asia Pacific TiO2 Industry Volume Share (%), by Grade 2024 & 2032
- Figure 27: Asia Pacific TiO2 Industry Revenue (Million), by Application 2024 & 2032
- Figure 28: Asia Pacific TiO2 Industry Volume (K Tons), by Application 2024 & 2032
- Figure 29: Asia Pacific TiO2 Industry Revenue Share (%), by Application 2024 & 2032
- Figure 30: Asia Pacific TiO2 Industry Volume Share (%), by Application 2024 & 2032
- Figure 31: Asia Pacific TiO2 Industry Revenue (Million), by Country 2024 & 2032
- Figure 32: Asia Pacific TiO2 Industry Volume (K Tons), by Country 2024 & 2032
- Figure 33: Asia Pacific TiO2 Industry Revenue Share (%), by Country 2024 & 2032
- Figure 34: Asia Pacific TiO2 Industry Volume Share (%), by Country 2024 & 2032
- Figure 35: North America TiO2 Industry Revenue (Million), by Grade 2024 & 2032
- Figure 36: North America TiO2 Industry Volume (K Tons), by Grade 2024 & 2032
- Figure 37: North America TiO2 Industry Revenue Share (%), by Grade 2024 & 2032
- Figure 38: North America TiO2 Industry Volume Share (%), by Grade 2024 & 2032
- Figure 39: North America TiO2 Industry Revenue (Million), by Application 2024 & 2032
- Figure 40: North America TiO2 Industry Volume (K Tons), by Application 2024 & 2032
- Figure 41: North America TiO2 Industry Revenue Share (%), by Application 2024 & 2032
- Figure 42: North America TiO2 Industry Volume Share (%), by Application 2024 & 2032
- Figure 43: North America TiO2 Industry Revenue (Million), by Country 2024 & 2032
- Figure 44: North America TiO2 Industry Volume (K Tons), by Country 2024 & 2032
- Figure 45: North America TiO2 Industry Revenue Share (%), by Country 2024 & 2032
- Figure 46: North America TiO2 Industry Volume Share (%), by Country 2024 & 2032
- Figure 47: Europe TiO2 Industry Revenue (Million), by Grade 2024 & 2032
- Figure 48: Europe TiO2 Industry Volume (K Tons), by Grade 2024 & 2032
- Figure 49: Europe TiO2 Industry Revenue Share (%), by Grade 2024 & 2032
- Figure 50: Europe TiO2 Industry Volume Share (%), by Grade 2024 & 2032
- Figure 51: Europe TiO2 Industry Revenue (Million), by Application 2024 & 2032
- Figure 52: Europe TiO2 Industry Volume (K Tons), by Application 2024 & 2032
- Figure 53: Europe TiO2 Industry Revenue Share (%), by Application 2024 & 2032
- Figure 54: Europe TiO2 Industry Volume Share (%), by Application 2024 & 2032
- Figure 55: Europe TiO2 Industry Revenue (Million), by Country 2024 & 2032
- Figure 56: Europe TiO2 Industry Volume (K Tons), by Country 2024 & 2032
- Figure 57: Europe TiO2 Industry Revenue Share (%), by Country 2024 & 2032
- Figure 58: Europe TiO2 Industry Volume Share (%), by Country 2024 & 2032
- Figure 59: South America TiO2 Industry Revenue (Million), by Grade 2024 & 2032
- Figure 60: South America TiO2 Industry Volume (K Tons), by Grade 2024 & 2032
- Figure 61: South America TiO2 Industry Revenue Share (%), by Grade 2024 & 2032
- Figure 62: South America TiO2 Industry Volume Share (%), by Grade 2024 & 2032
- Figure 63: South America TiO2 Industry Revenue (Million), by Application 2024 & 2032
- Figure 64: South America TiO2 Industry Volume (K Tons), by Application 2024 & 2032
- Figure 65: South America TiO2 Industry Revenue Share (%), by Application 2024 & 2032
- Figure 66: South America TiO2 Industry Volume Share (%), by Application 2024 & 2032
- Figure 67: South America TiO2 Industry Revenue (Million), by Country 2024 & 2032
- Figure 68: South America TiO2 Industry Volume (K Tons), by Country 2024 & 2032
- Figure 69: South America TiO2 Industry Revenue Share (%), by Country 2024 & 2032
- Figure 70: South America TiO2 Industry Volume Share (%), by Country 2024 & 2032
- Figure 71: Middle East and Africa TiO2 Industry Revenue (Million), by Grade 2024 & 2032
- Figure 72: Middle East and Africa TiO2 Industry Volume (K Tons), by Grade 2024 & 2032
- Figure 73: Middle East and Africa TiO2 Industry Revenue Share (%), by Grade 2024 & 2032
- Figure 74: Middle East and Africa TiO2 Industry Volume Share (%), by Grade 2024 & 2032
- Figure 75: Middle East and Africa TiO2 Industry Revenue (Million), by Application 2024 & 2032
- Figure 76: Middle East and Africa TiO2 Industry Volume (K Tons), by Application 2024 & 2032
- Figure 77: Middle East and Africa TiO2 Industry Revenue Share (%), by Application 2024 & 2032
- Figure 78: Middle East and Africa TiO2 Industry Volume Share (%), by Application 2024 & 2032
- Figure 79: Middle East and Africa TiO2 Industry Revenue (Million), by Country 2024 & 2032
- Figure 80: Middle East and Africa TiO2 Industry Volume (K Tons), by Country 2024 & 2032
- Figure 81: Middle East and Africa TiO2 Industry Revenue Share (%), by Country 2024 & 2032
- Figure 82: Middle East and Africa TiO2 Industry Volume Share (%), by Country 2024 & 2032
List of Tables
- Table 1: Global TiO2 Industry Revenue Million Forecast, by Region 2019 & 2032
- Table 2: Global TiO2 Industry Volume K Tons Forecast, by Region 2019 & 2032
- Table 3: Global TiO2 Industry Revenue Million Forecast, by Grade 2019 & 2032
- Table 4: Global TiO2 Industry Volume K Tons Forecast, by Grade 2019 & 2032
- Table 5: Global TiO2 Industry Revenue Million Forecast, by Application 2019 & 2032
- Table 6: Global TiO2 Industry Volume K Tons Forecast, by Application 2019 & 2032
- Table 7: Global TiO2 Industry Revenue Million Forecast, by Region 2019 & 2032
- Table 8: Global TiO2 Industry Volume K Tons Forecast, by Region 2019 & 2032
- Table 9: Global TiO2 Industry Revenue Million Forecast, by Country 2019 & 2032
- Table 10: Global TiO2 Industry Volume K Tons Forecast, by Country 2019 & 2032
- Table 11: United States TiO2 Industry Revenue (Million) Forecast, by Application 2019 & 2032
- Table 12: United States TiO2 Industry Volume (K Tons) Forecast, by Application 2019 & 2032
- Table 13: Canada TiO2 Industry Revenue (Million) Forecast, by Application 2019 & 2032
- Table 14: Canada TiO2 Industry Volume (K Tons) Forecast, by Application 2019 & 2032
- Table 15: Mexico TiO2 Industry Revenue (Million) Forecast, by Application 2019 & 2032
- Table 16: Mexico TiO2 Industry Volume (K Tons) Forecast, by Application 2019 & 2032
- Table 17: Global TiO2 Industry Revenue Million Forecast, by Country 2019 & 2032
- Table 18: Global TiO2 Industry Volume K Tons Forecast, by Country 2019 & 2032
- Table 19: Germany TiO2 Industry Revenue (Million) Forecast, by Application 2019 & 2032
- Table 20: Germany TiO2 Industry Volume (K Tons) Forecast, by Application 2019 & 2032
- Table 21: France TiO2 Industry Revenue (Million) Forecast, by Application 2019 & 2032
- Table 22: France TiO2 Industry Volume (K Tons) Forecast, by Application 2019 & 2032
- Table 23: Italy TiO2 Industry Revenue (Million) Forecast, by Application 2019 & 2032
- Table 24: Italy TiO2 Industry Volume (K Tons) Forecast, by Application 2019 & 2032
- Table 25: United Kingdom TiO2 Industry Revenue (Million) Forecast, by Application 2019 & 2032
- Table 26: United Kingdom TiO2 Industry Volume (K Tons) Forecast, by Application 2019 & 2032
- Table 27: Netherlands TiO2 Industry Revenue (Million) Forecast, by Application 2019 & 2032
- Table 28: Netherlands TiO2 Industry Volume (K Tons) Forecast, by Application 2019 & 2032
- Table 29: Rest of Europe TiO2 Industry Revenue (Million) Forecast, by Application 2019 & 2032
- Table 30: Rest of Europe TiO2 Industry Volume (K Tons) Forecast, by Application 2019 & 2032
- Table 31: Global TiO2 Industry Revenue Million Forecast, by Country 2019 & 2032
- Table 32: Global TiO2 Industry Volume K Tons Forecast, by Country 2019 & 2032
- Table 33: China TiO2 Industry Revenue (Million) Forecast, by Application 2019 & 2032
- Table 34: China TiO2 Industry Volume (K Tons) Forecast, by Application 2019 & 2032
- Table 35: Japan TiO2 Industry Revenue (Million) Forecast, by Application 2019 & 2032
- Table 36: Japan TiO2 Industry Volume (K Tons) Forecast, by Application 2019 & 2032
- Table 37: India TiO2 Industry Revenue (Million) Forecast, by Application 2019 & 2032
- Table 38: India TiO2 Industry Volume (K Tons) Forecast, by Application 2019 & 2032
- Table 39: South Korea TiO2 Industry Revenue (Million) Forecast, by Application 2019 & 2032
- Table 40: South Korea TiO2 Industry Volume (K Tons) Forecast, by Application 2019 & 2032
- Table 41: Taiwan TiO2 Industry Revenue (Million) Forecast, by Application 2019 & 2032
- Table 42: Taiwan TiO2 Industry Volume (K Tons) Forecast, by Application 2019 & 2032
- Table 43: Australia TiO2 Industry Revenue (Million) Forecast, by Application 2019 & 2032
- Table 44: Australia TiO2 Industry Volume (K Tons) Forecast, by Application 2019 & 2032
- Table 45: Rest of Asia-Pacific TiO2 Industry Revenue (Million) Forecast, by Application 2019 & 2032
- Table 46: Rest of Asia-Pacific TiO2 Industry Volume (K Tons) Forecast, by Application 2019 & 2032
- Table 47: Global TiO2 Industry Revenue Million Forecast, by Country 2019 & 2032
- Table 48: Global TiO2 Industry Volume K Tons Forecast, by Country 2019 & 2032
- Table 49: Brazil TiO2 Industry Revenue (Million) Forecast, by Application 2019 & 2032
- Table 50: Brazil TiO2 Industry Volume (K Tons) Forecast, by Application 2019 & 2032
- Table 51: Argentina TiO2 Industry Revenue (Million) Forecast, by Application 2019 & 2032
- Table 52: Argentina TiO2 Industry Volume (K Tons) Forecast, by Application 2019 & 2032
- Table 53: Rest of South America TiO2 Industry Revenue (Million) Forecast, by Application 2019 & 2032
- Table 54: Rest of South America TiO2 Industry Volume (K Tons) Forecast, by Application 2019 & 2032
- Table 55: Global TiO2 Industry Revenue Million Forecast, by Country 2019 & 2032
- Table 56: Global TiO2 Industry Volume K Tons Forecast, by Country 2019 & 2032
- Table 57: Middle East TiO2 Industry Revenue (Million) Forecast, by Application 2019 & 2032
- Table 58: Middle East TiO2 Industry Volume (K Tons) Forecast, by Application 2019 & 2032
- Table 59: Africa TiO2 Industry Revenue (Million) Forecast, by Application 2019 & 2032
- Table 60: Africa TiO2 Industry Volume (K Tons) Forecast, by Application 2019 & 2032
- Table 61: Global TiO2 Industry Revenue Million Forecast, by Grade 2019 & 2032
- Table 62: Global TiO2 Industry Volume K Tons Forecast, by Grade 2019 & 2032
- Table 63: Global TiO2 Industry Revenue Million Forecast, by Application 2019 & 2032
- Table 64: Global TiO2 Industry Volume K Tons Forecast, by Application 2019 & 2032
- Table 65: Global TiO2 Industry Revenue Million Forecast, by Country 2019 & 2032
- Table 66: Global TiO2 Industry Volume K Tons Forecast, by Country 2019 & 2032
- Table 67: China TiO2 Industry Revenue (Million) Forecast, by Application 2019 & 2032
- Table 68: China TiO2 Industry Volume (K Tons) Forecast, by Application 2019 & 2032
- Table 69: India TiO2 Industry Revenue (Million) Forecast, by Application 2019 & 2032
- Table 70: India TiO2 Industry Volume (K Tons) Forecast, by Application 2019 & 2032
- Table 71: Japan TiO2 Industry Revenue (Million) Forecast, by Application 2019 & 2032
- Table 72: Japan TiO2 Industry Volume (K Tons) Forecast, by Application 2019 & 2032
- Table 73: South Korea TiO2 Industry Revenue (Million) Forecast, by Application 2019 & 2032
- Table 74: South Korea TiO2 Industry Volume (K Tons) Forecast, by Application 2019 & 2032
- Table 75: Rest of Asia Pacific TiO2 Industry Revenue (Million) Forecast, by Application 2019 & 2032
- Table 76: Rest of Asia Pacific TiO2 Industry Volume (K Tons) Forecast, by Application 2019 & 2032
- Table 77: Global TiO2 Industry Revenue Million Forecast, by Grade 2019 & 2032
- Table 78: Global TiO2 Industry Volume K Tons Forecast, by Grade 2019 & 2032
- Table 79: Global TiO2 Industry Revenue Million Forecast, by Application 2019 & 2032
- Table 80: Global TiO2 Industry Volume K Tons Forecast, by Application 2019 & 2032
- Table 81: Global TiO2 Industry Revenue Million Forecast, by Country 2019 & 2032
- Table 82: Global TiO2 Industry Volume K Tons Forecast, by Country 2019 & 2032
- Table 83: United States TiO2 Industry Revenue (Million) Forecast, by Application 2019 & 2032
- Table 84: United States TiO2 Industry Volume (K Tons) Forecast, by Application 2019 & 2032
- Table 85: Canada TiO2 Industry Revenue (Million) Forecast, by Application 2019 & 2032
- Table 86: Canada TiO2 Industry Volume (K Tons) Forecast, by Application 2019 & 2032
- Table 87: Mexico TiO2 Industry Revenue (Million) Forecast, by Application 2019 & 2032
- Table 88: Mexico TiO2 Industry Volume (K Tons) Forecast, by Application 2019 & 2032
- Table 89: Global TiO2 Industry Revenue Million Forecast, by Grade 2019 & 2032
- Table 90: Global TiO2 Industry Volume K Tons Forecast, by Grade 2019 & 2032
- Table 91: Global TiO2 Industry Revenue Million Forecast, by Application 2019 & 2032
- Table 92: Global TiO2 Industry Volume K Tons Forecast, by Application 2019 & 2032
- Table 93: Global TiO2 Industry Revenue Million Forecast, by Country 2019 & 2032
- Table 94: Global TiO2 Industry Volume K Tons Forecast, by Country 2019 & 2032
- Table 95: Germany TiO2 Industry Revenue (Million) Forecast, by Application 2019 & 2032
- Table 96: Germany TiO2 Industry Volume (K Tons) Forecast, by Application 2019 & 2032
- Table 97: United Kingdom TiO2 Industry Revenue (Million) Forecast, by Application 2019 & 2032
- Table 98: United Kingdom TiO2 Industry Volume (K Tons) Forecast, by Application 2019 & 2032
- Table 99: France TiO2 Industry Revenue (Million) Forecast, by Application 2019 & 2032
- Table 100: France TiO2 Industry Volume (K Tons) Forecast, by Application 2019 & 2032
- Table 101: Italy TiO2 Industry Revenue (Million) Forecast, by Application 2019 & 2032
- Table 102: Italy TiO2 Industry Volume (K Tons) Forecast, by Application 2019 & 2032
- Table 103: Rest of Europe TiO2 Industry Revenue (Million) Forecast, by Application 2019 & 2032
- Table 104: Rest of Europe TiO2 Industry Volume (K Tons) Forecast, by Application 2019 & 2032
- Table 105: Global TiO2 Industry Revenue Million Forecast, by Grade 2019 & 2032
- Table 106: Global TiO2 Industry Volume K Tons Forecast, by Grade 2019 & 2032
- Table 107: Global TiO2 Industry Revenue Million Forecast, by Application 2019 & 2032
- Table 108: Global TiO2 Industry Volume K Tons Forecast, by Application 2019 & 2032
- Table 109: Global TiO2 Industry Revenue Million Forecast, by Country 2019 & 2032
- Table 110: Global TiO2 Industry Volume K Tons Forecast, by Country 2019 & 2032
- Table 111: Brazil TiO2 Industry Revenue (Million) Forecast, by Application 2019 & 2032
- Table 112: Brazil TiO2 Industry Volume (K Tons) Forecast, by Application 2019 & 2032
- Table 113: Argentina TiO2 Industry Revenue (Million) Forecast, by Application 2019 & 2032
- Table 114: Argentina TiO2 Industry Volume (K Tons) Forecast, by Application 2019 & 2032
- Table 115: Rest of South America TiO2 Industry Revenue (Million) Forecast, by Application 2019 & 2032
- Table 116: Rest of South America TiO2 Industry Volume (K Tons) Forecast, by Application 2019 & 2032
- Table 117: Global TiO2 Industry Revenue Million Forecast, by Grade 2019 & 2032
- Table 118: Global TiO2 Industry Volume K Tons Forecast, by Grade 2019 & 2032
- Table 119: Global TiO2 Industry Revenue Million Forecast, by Application 2019 & 2032
- Table 120: Global TiO2 Industry Volume K Tons Forecast, by Application 2019 & 2032
- Table 121: Global TiO2 Industry Revenue Million Forecast, by Country 2019 & 2032
- Table 122: Global TiO2 Industry Volume K Tons Forecast, by Country 2019 & 2032
- Table 123: Saudi Arabia TiO2 Industry Revenue (Million) Forecast, by Application 2019 & 2032
- Table 124: Saudi Arabia TiO2 Industry Volume (K Tons) Forecast, by Application 2019 & 2032
- Table 125: South Africa TiO2 Industry Revenue (Million) Forecast, by Application 2019 & 2032
- Table 126: South Africa TiO2 Industry Volume (K Tons) Forecast, by Application 2019 & 2032
- Table 127: Rest of Middle East and Africa TiO2 Industry Revenue (Million) Forecast, by Application 2019 & 2032
- Table 128: Rest of Middle East and Africa TiO2 Industry Volume (K Tons) Forecast, by Application 2019 & 2032
Frequently Asked Questions
1. What is the projected Compound Annual Growth Rate (CAGR) of the TiO2 Industry?
The projected CAGR is approximately > 4.00%.
2. Which companies are prominent players in the TiO2 Industry?
Key companies in the market include INEOS, Evonik Industries AG, LB Group, Grupa Azoty, Argex Titanium Inc, Kemipex, Venator Materials PLC, TAYCA, The Chemours Company, Tronox Holdings PLC, Precheza, KRONOS Worldwide Inc, The Kish Company Inc.
3. What are the main segments of the TiO2 Industry?
The market segments include Grade, Application.
4. Can you provide details about the market size?
The market size is estimated to be USD XX Million as of 2022.
5. What are some drivers contributing to market growth?
Rapidly Increasing Demand for Paints and Coatings; Other Drivers.
6. What are the notable trends driving market growth?
Paints and Coatings Segment is Expected to Dominate the Market.
7. Are there any restraints impacting market growth?
Toxicity and Stringent Environmental Policies of Titanium Dioxide; Other Restraints.
8. Can you provide examples of recent developments in the market?
In August 2022, Chemours started mining at its newest sand mine in Florida, which will increase the company's titanium oxide production. Chemours will get ilmenite from the mine, which will be used in their chloride-based TiO2 synthesis process. The site's mining life should be eight years.
9. What pricing options are available for accessing the report?
Pricing options include single-user, multi-user, and enterprise licenses priced at USD 4750, USD 5250, and USD 8750 respectively.
10. Is the market size provided in terms of value or volume?
The market size is provided in terms of value, measured in Million and volume, measured in K Tons.
11. Are there any specific market keywords associated with the report?
Yes, the market keyword associated with the report is "TiO2 Industry," which aids in identifying and referencing the specific market segment covered.
12. How do I determine which pricing option suits my needs best?
The pricing options vary based on user requirements and access needs. Individual users may opt for single-user licenses, while businesses requiring broader access may choose multi-user or enterprise licenses for cost-effective access to the report.
13. Are there any additional resources or data provided in the TiO2 Industry report?
While the report offers comprehensive insights, it's advisable to review the specific contents or supplementary materials provided to ascertain if additional resources or data are available.
14. How can I stay updated on further developments or reports in the TiO2 Industry?
To stay informed about further developments, trends, and reports in the TiO2 Industry, consider subscribing to industry newsletters, following relevant companies and organizations, or regularly checking reputable industry news sources and publications.
Methodology
Step 1 - Identification of Relevant Samples Size from Population Database


Step 2 - Approaches for Defining Global Market Size (Value, Volume* & Price*)

Note*: In applicable scenarios
Step 3 - Data Sources
Primary Research
- Web Analytics
- Survey Reports
- Research Institute
- Latest Research Reports
- Opinion Leaders
Secondary Research
- Annual Reports
- White Paper
- Latest Press Release
- Industry Association
- Paid Database
- Investor Presentations

Step 4 - Data Triangulation
Involves using different sources of information in order to increase the validity of a study
These sources are likely to be stakeholders in a program - participants, other researchers, program staff, other community members, and so on.
Then we put all data in single framework & apply various statistical tools to find out the dynamic on the market.
During the analysis stage, feedback from the stakeholder groups would be compared to determine areas of agreement as well as areas of divergence


