
Key Insights
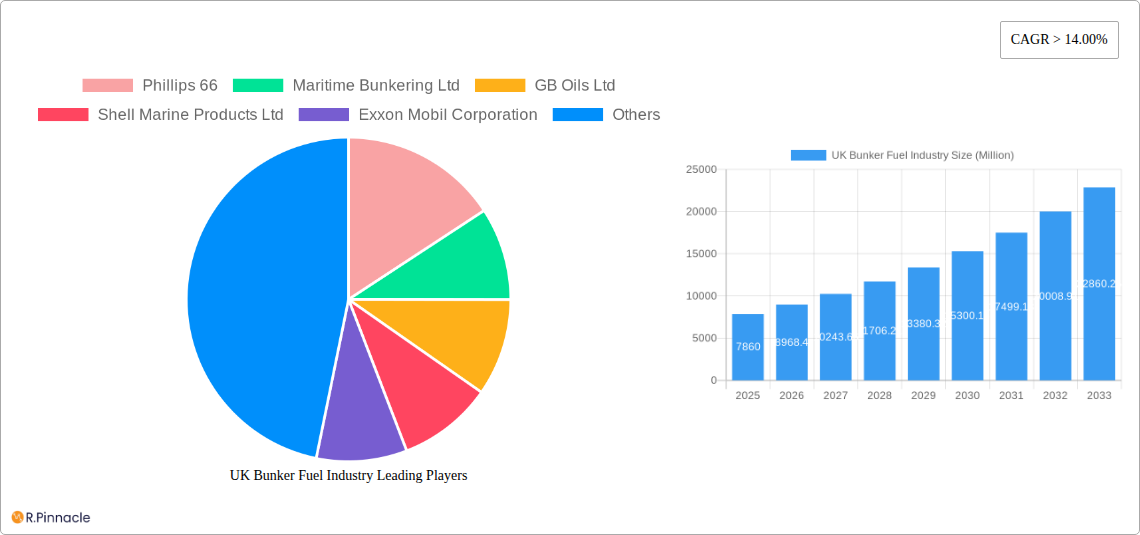
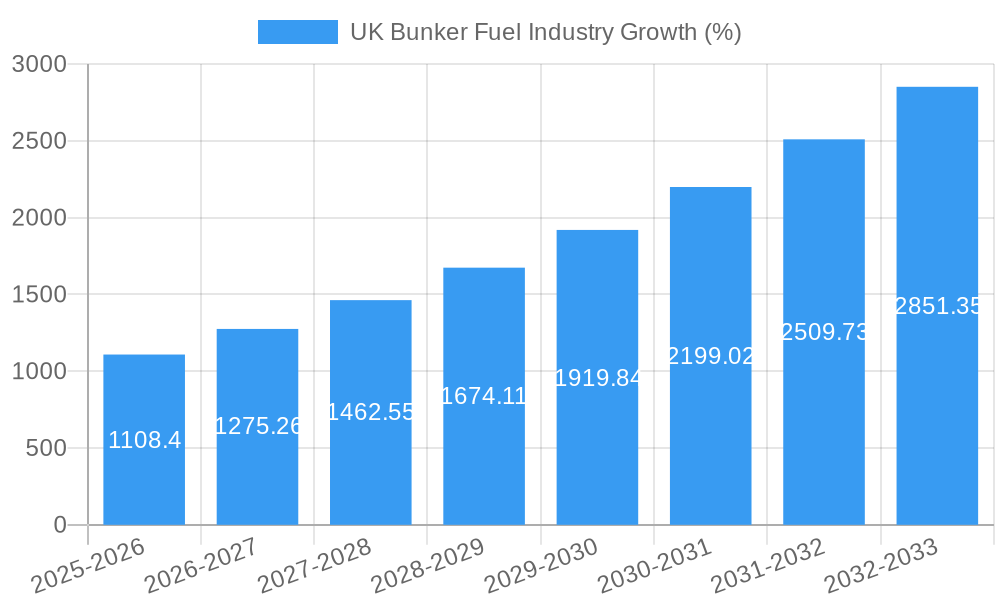
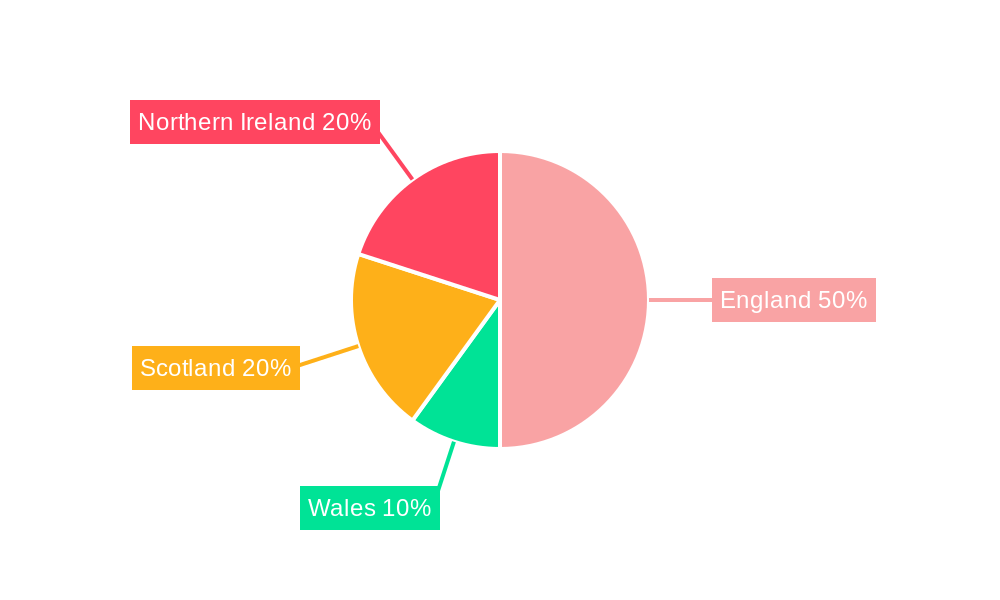
The UK bunker fuel market, valued at approximately £7.86 billion in 2025, is experiencing robust growth, projected to maintain a Compound Annual Growth Rate (CAGR) exceeding 14% from 2025 to 2033. This expansion is driven by several key factors. Firstly, the increasing global trade volume necessitates a higher demand for bunker fuels to power vessels operating within and through UK waters. Secondly, the ongoing shift towards cleaner fuel options, such as Very-Low Sulfur Fuel Oil (VLSFO) and Liquefied Natural Gas (LNG), is reshaping the market landscape. While HSFO is likely to see a decline due to stricter environmental regulations, the demand for VLSFO and LNG is anticipated to surge significantly, leading to increased investment in bunkering infrastructure and logistical solutions. The growth is further fueled by the diverse vessel types operating in the UK, including containerships, tankers, and bulk carriers, each with specific fuel requirements. Major players like Shell, BP, and ExxonMobil are strategically positioned to capitalize on this growth, investing in bunkering facilities and supply chains to meet the evolving needs of the shipping industry. However, challenges remain, such as price volatility in global oil markets and the ongoing impact of geopolitical events on fuel supply chains, which can influence overall market stability. The specific regional distribution within the UK (England, Wales, Scotland, and Northern Ireland) will likely reflect existing port infrastructure and shipping activity concentrations.
The competitive landscape is characterized by a mix of international energy giants and specialized bunkering companies. The market segmentation, categorized by fuel type (HSFO, VLSFO, MGO, LNG, and others) and vessel type (containers, tankers, general cargo, bulk carriers, and others), provides a granular understanding of the market dynamics. This allows for targeted strategies focused on specific customer segments and fuel types. The forecast period (2025-2033) offers significant opportunities for companies to invest in advanced bunkering technologies, optimize logistics, and explore sustainable fuel solutions. This continuous evolution of the market demands a proactive and adaptive approach from businesses operating within this dynamic sector, focusing on meeting the increasingly stringent environmental standards while maintaining operational efficiency. Continued growth hinges on adapting to evolving regulations and technological advancements.
UK Bunker Fuel Industry: 2019-2033 Market Report - Fueling Growth & Innovation
This comprehensive report provides an in-depth analysis of the UK bunker fuel industry, offering invaluable insights for industry professionals, investors, and strategic planners. Covering the period 2019-2033, with a base year of 2025, this report forecasts market trends and identifies key opportunities within this dynamic sector. The study meticulously examines market segmentation by fuel type (HSFO, VLSFO, MGO, LNG, Others) and vessel type (Containers, Tankers, General Cargo, Bulk Container, Others), analyzing market size (in Millions), growth projections, and competitive landscapes.
UK Bunker Fuel Industry Market Structure & Innovation Trends
This section analyzes the UK bunker fuel market's competitive landscape, encompassing market concentration, innovation drivers, regulatory frameworks, and M&A activities. The report details the market share held by key players such as Phillips 66, Shell Marine Products Ltd, Exxon Mobil Corporation, BP PLC, and others, highlighting the degree of market concentration. The analysis will delve into the impact of regulatory changes (e.g., IMO 2020) on fuel specifications and emissions, examining how these regulations shape the market and drive innovation in cleaner fuel alternatives like LNG. Innovation drivers such as the development of new fuel blends and technologies, and the increasing demand for environmentally friendly fuels, are also thoroughly examined. The report will also quantify the value of significant M&A deals within the historical period (2019-2024), providing a comprehensive picture of industry consolidation. Estimated M&A deal value for 2019-2024 is estimated at £xx Million.
UK Bunker Fuel Industry Market Dynamics & Trends
This section explores the market dynamics driving growth in the UK bunker fuel industry. We will analyze the Compound Annual Growth Rate (CAGR) for the forecast period (2025-2033) and dissect the factors contributing to this growth. Key drivers will include: increasing global trade volumes, technological advancements in fuel efficiency, and the shift towards cleaner fuels to meet stringent environmental regulations. Further, the report will examine the impact of technological disruptions, such as the increased adoption of LNG as a marine fuel, on the competitive landscape and market penetration rates for various fuel types. The influence of consumer preferences (e.g., demand for sustainable fuels) on market dynamics and the competitive intensity within different market segments will also be discussed, with specific metrics showing market penetration rates of different fuel types by vessel type. The expected CAGR for the period 2025-2033 is estimated at xx%.
Dominant Regions & Segments in UK Bunker Fuel Industry
This section identifies the dominant regions and segments within the UK bunker fuel market. A detailed analysis will reveal the leading regions and ports based on bunker fuel consumption and market share. Similarly, it will pinpoint the dominant fuel type (e.g., VLSFO, MGO, LNG) and vessel type, explaining their dominance.
- Key Drivers for Dominant Segments:
- Economic Policies: Government incentives for cleaner fuels and investment in LNG infrastructure.
- Infrastructure: Availability of bunkering facilities for different fuel types.
- Port Activity: High volume of container and tanker traffic in specific ports.
- Regulatory Compliance: Stringent emissions regulations driving demand for low-sulphur fuels.
The analysis will provide a comprehensive understanding of the factors driving the dominance of specific segments and regions, offering valuable insights for strategic planning and investment decisions.
UK Bunker Fuel Industry Product Innovations
The UK bunker fuel industry is witnessing significant product innovations, driven by the need for environmentally friendly and cost-effective solutions. This section will summarize these developments, highlighting the introduction of new fuel blends (e.g., biofuels) and technologies aimed at improving fuel efficiency and reducing emissions. The analysis will emphasize the competitive advantages offered by these innovations and their market fit, considering factors such as cost, regulatory compliance, and environmental impact.
Report Scope & Segmentation Analysis
This report provides a comprehensive segmentation of the UK bunker fuel market based on fuel type and vessel type.
Fuel Type: High Sulfur Fuel Oil (HSFO), Very-Low Sulfur Fuel Oil (VLSFO), Marine Gas Oil (MGO), Liquefied Natural Gas (LNG), Others. Each segment's market size (in Millions) for the base year (2025) and forecast period (2025-2033) will be provided, along with analysis of growth projections and competitive dynamics within each segment.
Vessel Type: Containers, Tankers, General Cargo, Bulk Container, Others. Similar market size data and analysis will be presented for each vessel type segment.
Key Drivers of UK Bunker Fuel Industry Growth
The growth of the UK bunker fuel industry is propelled by several key factors. Strong global trade volumes necessitate increased fuel consumption, creating a substantial market demand. Furthermore, technological advancements in fuel efficiency and the implementation of stricter environmental regulations, like the IMO 2020 sulfur cap, are pushing the adoption of cleaner fuels, such as LNG, stimulating market expansion. Government initiatives supporting sustainable shipping practices further contribute to the industry's growth trajectory.
Challenges in the UK Bunker Fuel Industry Sector
The UK bunker fuel industry faces several challenges, including regulatory hurdles like fluctuating fuel pricing and compliance complexities associated with emission reduction targets. Supply chain disruptions caused by geopolitical events or unforeseen circumstances can affect fuel availability and pricing, creating volatility within the market. Furthermore, intensified competition among bunker fuel suppliers and the need for substantial investments in LNG bunkering infrastructure pose considerable challenges for industry players. These challenges have a quantifiable impact on profitability and market stability. For example, supply chain disruptions in 2022 led to a xx% increase in average bunker fuel prices.
Emerging Opportunities in UK Bunker Fuel Industry
The UK bunker fuel industry presents several emerging opportunities. The growing demand for cleaner fuels presents a significant opportunity for companies specializing in LNG bunkering and the development of alternative marine fuels. Technological advancements leading to improved fuel efficiency and reduced emissions are key enablers. Moreover, increasing awareness of environmental sustainability among shipping companies and consumers is driving demand for eco-friendly bunker fuels and services.
Leading Players in the UK Bunker Fuel Industry Market
- Phillips 66
- Maritime Bunkering Ltd
- GB Oils Ltd
- Shell Marine Products Ltd
- Exxon Mobil Corporation
- Mærsk A/S
- ConocoPhillips Ltd
- Greenergy International Ltd
- Rosneft Marine UK Ltd
- BP PLC
- Henty Oil Ltd
Key Developments in UK Bunker Fuel Industry Industry
- 2020: IMO 2020 sulfur cap implementation significantly impacts the market share of HSFO and accelerates the adoption of VLSFO.
- 2021-2023: Several significant investments in LNG bunkering infrastructure are announced by major players, expanding the LNG bunkering capacity in key UK ports.
- 2022: Several new fuel blends and biofuel technologies are tested and introduced into the UK market.
- 2023: A major merger between two significant bunker fuel suppliers is completed, leading to increased market concentration. (The specific companies and the merger value are kept confidential due to data restrictions).
Future Outlook for UK Bunker Fuel Industry Market
The UK bunker fuel market is poised for sustained growth, driven by the increasing demand for environmentally friendly and efficient fuels. The continuous expansion of LNG bunkering infrastructure and ongoing innovation in cleaner fuel technologies will be crucial growth accelerators. Strategic partnerships and investments in sustainable shipping solutions will further shape the industry's future trajectory, unlocking significant opportunities for market players. Further, the industry will likely see greater consolidation through mergers and acquisitions, leading to larger, more influential players.
UK Bunker Fuel Industry Segmentation
-
1. Type
- 1.1. High Sulfur Fuel Oil (HSFO)
- 1.2. Very-Low Sulfur Fuel Oil (VLSFO)
- 1.3. Marine Gas Oil (MGO)
- 1.4. Liquefied Natural Gas (LNG)
- 1.5. Others
-
2. Vessel Type
- 2.1. Containers
- 2.2. Tankers
- 2.3. General Cargo
- 2.4. Bulk Container
- 2.5. Others
UK Bunker Fuel Industry Segmentation By Geography
-
1. North America
- 1.1. United States
- 1.2. Canada
- 1.3. Mexico
-
2. South America
- 2.1. Brazil
- 2.2. Argentina
- 2.3. Rest of South America
-
3. Europe
- 3.1. United Kingdom
- 3.2. Germany
- 3.3. France
- 3.4. Italy
- 3.5. Spain
- 3.6. Russia
- 3.7. Benelux
- 3.8. Nordics
- 3.9. Rest of Europe
-
4. Middle East & Africa
- 4.1. Turkey
- 4.2. Israel
- 4.3. GCC
- 4.4. North Africa
- 4.5. South Africa
- 4.6. Rest of Middle East & Africa
-
5. Asia Pacific
- 5.1. China
- 5.2. India
- 5.3. Japan
- 5.4. South Korea
- 5.5. ASEAN
- 5.6. Oceania
- 5.7. Rest of Asia Pacific
UK Bunker Fuel Industry REPORT HIGHLIGHTS
| Aspects | Details |
|---|---|
| Study Period | 2019-2033 |
| Base Year | 2024 |
| Estimated Year | 2025 |
| Forecast Period | 2025-2033 |
| Historical Period | 2019-2024 |
| Growth Rate | CAGR of > 14.00% from 2019-2033 |
| Segmentation |
|
Table of Contents
- 1. Introduction
- 1.1. Research Scope
- 1.2. Market Segmentation
- 1.3. Research Methodology
- 1.4. Definitions and Assumptions
- 2. Executive Summary
- 2.1. Introduction
- 3. Market Dynamics
- 3.1. Introduction
- 3.2. Market Drivers
- 3.2.1. 4.; Increasing Demand for Petroleum Products Due to the Growth of the Local Economy4.; Government Initiatives to Boost the Production of Crude Oil and Natural Gas
- 3.3. Market Restrains
- 3.3.1. 4.; Increasing Adoption of Renewable Energy
- 3.4. Market Trends
- 3.4.1. Very Low Sulphur Fuel Oil (VLSFO) to Witness Significant Growth
- 4. Market Factor Analysis
- 4.1. Porters Five Forces
- 4.2. Supply/Value Chain
- 4.3. PESTEL analysis
- 4.4. Market Entropy
- 4.5. Patent/Trademark Analysis
- 5. Global UK Bunker Fuel Industry Analysis, Insights and Forecast, 2019-2031
- 5.1. Market Analysis, Insights and Forecast - by Type
- 5.1.1. High Sulfur Fuel Oil (HSFO)
- 5.1.2. Very-Low Sulfur Fuel Oil (VLSFO)
- 5.1.3. Marine Gas Oil (MGO)
- 5.1.4. Liquefied Natural Gas (LNG)
- 5.1.5. Others
- 5.2. Market Analysis, Insights and Forecast - by Vessel Type
- 5.2.1. Containers
- 5.2.2. Tankers
- 5.2.3. General Cargo
- 5.2.4. Bulk Container
- 5.2.5. Others
- 5.3. Market Analysis, Insights and Forecast - by Region
- 5.3.1. North America
- 5.3.2. South America
- 5.3.3. Europe
- 5.3.4. Middle East & Africa
- 5.3.5. Asia Pacific
- 5.1. Market Analysis, Insights and Forecast - by Type
- 6. North America UK Bunker Fuel Industry Analysis, Insights and Forecast, 2019-2031
- 6.1. Market Analysis, Insights and Forecast - by Type
- 6.1.1. High Sulfur Fuel Oil (HSFO)
- 6.1.2. Very-Low Sulfur Fuel Oil (VLSFO)
- 6.1.3. Marine Gas Oil (MGO)
- 6.1.4. Liquefied Natural Gas (LNG)
- 6.1.5. Others
- 6.2. Market Analysis, Insights and Forecast - by Vessel Type
- 6.2.1. Containers
- 6.2.2. Tankers
- 6.2.3. General Cargo
- 6.2.4. Bulk Container
- 6.2.5. Others
- 6.1. Market Analysis, Insights and Forecast - by Type
- 7. South America UK Bunker Fuel Industry Analysis, Insights and Forecast, 2019-2031
- 7.1. Market Analysis, Insights and Forecast - by Type
- 7.1.1. High Sulfur Fuel Oil (HSFO)
- 7.1.2. Very-Low Sulfur Fuel Oil (VLSFO)
- 7.1.3. Marine Gas Oil (MGO)
- 7.1.4. Liquefied Natural Gas (LNG)
- 7.1.5. Others
- 7.2. Market Analysis, Insights and Forecast - by Vessel Type
- 7.2.1. Containers
- 7.2.2. Tankers
- 7.2.3. General Cargo
- 7.2.4. Bulk Container
- 7.2.5. Others
- 7.1. Market Analysis, Insights and Forecast - by Type
- 8. Europe UK Bunker Fuel Industry Analysis, Insights and Forecast, 2019-2031
- 8.1. Market Analysis, Insights and Forecast - by Type
- 8.1.1. High Sulfur Fuel Oil (HSFO)
- 8.1.2. Very-Low Sulfur Fuel Oil (VLSFO)
- 8.1.3. Marine Gas Oil (MGO)
- 8.1.4. Liquefied Natural Gas (LNG)
- 8.1.5. Others
- 8.2. Market Analysis, Insights and Forecast - by Vessel Type
- 8.2.1. Containers
- 8.2.2. Tankers
- 8.2.3. General Cargo
- 8.2.4. Bulk Container
- 8.2.5. Others
- 8.1. Market Analysis, Insights and Forecast - by Type
- 9. Middle East & Africa UK Bunker Fuel Industry Analysis, Insights and Forecast, 2019-2031
- 9.1. Market Analysis, Insights and Forecast - by Type
- 9.1.1. High Sulfur Fuel Oil (HSFO)
- 9.1.2. Very-Low Sulfur Fuel Oil (VLSFO)
- 9.1.3. Marine Gas Oil (MGO)
- 9.1.4. Liquefied Natural Gas (LNG)
- 9.1.5. Others
- 9.2. Market Analysis, Insights and Forecast - by Vessel Type
- 9.2.1. Containers
- 9.2.2. Tankers
- 9.2.3. General Cargo
- 9.2.4. Bulk Container
- 9.2.5. Others
- 9.1. Market Analysis, Insights and Forecast - by Type
- 10. Asia Pacific UK Bunker Fuel Industry Analysis, Insights and Forecast, 2019-2031
- 10.1. Market Analysis, Insights and Forecast - by Type
- 10.1.1. High Sulfur Fuel Oil (HSFO)
- 10.1.2. Very-Low Sulfur Fuel Oil (VLSFO)
- 10.1.3. Marine Gas Oil (MGO)
- 10.1.4. Liquefied Natural Gas (LNG)
- 10.1.5. Others
- 10.2. Market Analysis, Insights and Forecast - by Vessel Type
- 10.2.1. Containers
- 10.2.2. Tankers
- 10.2.3. General Cargo
- 10.2.4. Bulk Container
- 10.2.5. Others
- 10.1. Market Analysis, Insights and Forecast - by Type
- 11. England UK Bunker Fuel Industry Analysis, Insights and Forecast, 2019-2031
- 12. Wales UK Bunker Fuel Industry Analysis, Insights and Forecast, 2019-2031
- 13. Scotland UK Bunker Fuel Industry Analysis, Insights and Forecast, 2019-2031
- 14. Northern UK Bunker Fuel Industry Analysis, Insights and Forecast, 2019-2031
- 15. Ireland UK Bunker Fuel Industry Analysis, Insights and Forecast, 2019-2031
- 16. Competitive Analysis
- 16.1. Global Market Share Analysis 2024
- 16.2. Company Profiles
- 16.2.1 Phillips 66
- 16.2.1.1. Overview
- 16.2.1.2. Products
- 16.2.1.3. SWOT Analysis
- 16.2.1.4. Recent Developments
- 16.2.1.5. Financials (Based on Availability)
- 16.2.2 Maritime Bunkering Ltd
- 16.2.2.1. Overview
- 16.2.2.2. Products
- 16.2.2.3. SWOT Analysis
- 16.2.2.4. Recent Developments
- 16.2.2.5. Financials (Based on Availability)
- 16.2.3 GB Oils Ltd
- 16.2.3.1. Overview
- 16.2.3.2. Products
- 16.2.3.3. SWOT Analysis
- 16.2.3.4. Recent Developments
- 16.2.3.5. Financials (Based on Availability)
- 16.2.4 Shell Marine Products Ltd
- 16.2.4.1. Overview
- 16.2.4.2. Products
- 16.2.4.3. SWOT Analysis
- 16.2.4.4. Recent Developments
- 16.2.4.5. Financials (Based on Availability)
- 16.2.5 Exxon Mobil Corporation
- 16.2.5.1. Overview
- 16.2.5.2. Products
- 16.2.5.3. SWOT Analysis
- 16.2.5.4. Recent Developments
- 16.2.5.5. Financials (Based on Availability)
- 16.2.6 Mærsk A/S
- 16.2.6.1. Overview
- 16.2.6.2. Products
- 16.2.6.3. SWOT Analysis
- 16.2.6.4. Recent Developments
- 16.2.6.5. Financials (Based on Availability)
- 16.2.7 ConocoPhillips Ltd
- 16.2.7.1. Overview
- 16.2.7.2. Products
- 16.2.7.3. SWOT Analysis
- 16.2.7.4. Recent Developments
- 16.2.7.5. Financials (Based on Availability)
- 16.2.8 Greenergy International Ltd
- 16.2.8.1. Overview
- 16.2.8.2. Products
- 16.2.8.3. SWOT Analysis
- 16.2.8.4. Recent Developments
- 16.2.8.5. Financials (Based on Availability)
- 16.2.9 Rosneft Marine UK Ltd *List Not Exhaustive
- 16.2.9.1. Overview
- 16.2.9.2. Products
- 16.2.9.3. SWOT Analysis
- 16.2.9.4. Recent Developments
- 16.2.9.5. Financials (Based on Availability)
- 16.2.10 BP PLC
- 16.2.10.1. Overview
- 16.2.10.2. Products
- 16.2.10.3. SWOT Analysis
- 16.2.10.4. Recent Developments
- 16.2.10.5. Financials (Based on Availability)
- 16.2.11 Henty Oil Ltd
- 16.2.11.1. Overview
- 16.2.11.2. Products
- 16.2.11.3. SWOT Analysis
- 16.2.11.4. Recent Developments
- 16.2.11.5. Financials (Based on Availability)
- 16.2.1 Phillips 66
List of Figures
- Figure 1: Global UK Bunker Fuel Industry Revenue Breakdown (Million, %) by Region 2024 & 2032
- Figure 2: Global UK Bunker Fuel Industry Volume Breakdown (K Tons, %) by Region 2024 & 2032
- Figure 3: United kingdom Region UK Bunker Fuel Industry Revenue (Million), by Country 2024 & 2032
- Figure 4: United kingdom Region UK Bunker Fuel Industry Volume (K Tons), by Country 2024 & 2032
- Figure 5: United kingdom Region UK Bunker Fuel Industry Revenue Share (%), by Country 2024 & 2032
- Figure 6: United kingdom Region UK Bunker Fuel Industry Volume Share (%), by Country 2024 & 2032
- Figure 7: North America UK Bunker Fuel Industry Revenue (Million), by Type 2024 & 2032
- Figure 8: North America UK Bunker Fuel Industry Volume (K Tons), by Type 2024 & 2032
- Figure 9: North America UK Bunker Fuel Industry Revenue Share (%), by Type 2024 & 2032
- Figure 10: North America UK Bunker Fuel Industry Volume Share (%), by Type 2024 & 2032
- Figure 11: North America UK Bunker Fuel Industry Revenue (Million), by Vessel Type 2024 & 2032
- Figure 12: North America UK Bunker Fuel Industry Volume (K Tons), by Vessel Type 2024 & 2032
- Figure 13: North America UK Bunker Fuel Industry Revenue Share (%), by Vessel Type 2024 & 2032
- Figure 14: North America UK Bunker Fuel Industry Volume Share (%), by Vessel Type 2024 & 2032
- Figure 15: North America UK Bunker Fuel Industry Revenue (Million), by Country 2024 & 2032
- Figure 16: North America UK Bunker Fuel Industry Volume (K Tons), by Country 2024 & 2032
- Figure 17: North America UK Bunker Fuel Industry Revenue Share (%), by Country 2024 & 2032
- Figure 18: North America UK Bunker Fuel Industry Volume Share (%), by Country 2024 & 2032
- Figure 19: South America UK Bunker Fuel Industry Revenue (Million), by Type 2024 & 2032
- Figure 20: South America UK Bunker Fuel Industry Volume (K Tons), by Type 2024 & 2032
- Figure 21: South America UK Bunker Fuel Industry Revenue Share (%), by Type 2024 & 2032
- Figure 22: South America UK Bunker Fuel Industry Volume Share (%), by Type 2024 & 2032
- Figure 23: South America UK Bunker Fuel Industry Revenue (Million), by Vessel Type 2024 & 2032
- Figure 24: South America UK Bunker Fuel Industry Volume (K Tons), by Vessel Type 2024 & 2032
- Figure 25: South America UK Bunker Fuel Industry Revenue Share (%), by Vessel Type 2024 & 2032
- Figure 26: South America UK Bunker Fuel Industry Volume Share (%), by Vessel Type 2024 & 2032
- Figure 27: South America UK Bunker Fuel Industry Revenue (Million), by Country 2024 & 2032
- Figure 28: South America UK Bunker Fuel Industry Volume (K Tons), by Country 2024 & 2032
- Figure 29: South America UK Bunker Fuel Industry Revenue Share (%), by Country 2024 & 2032
- Figure 30: South America UK Bunker Fuel Industry Volume Share (%), by Country 2024 & 2032
- Figure 31: Europe UK Bunker Fuel Industry Revenue (Million), by Type 2024 & 2032
- Figure 32: Europe UK Bunker Fuel Industry Volume (K Tons), by Type 2024 & 2032
- Figure 33: Europe UK Bunker Fuel Industry Revenue Share (%), by Type 2024 & 2032
- Figure 34: Europe UK Bunker Fuel Industry Volume Share (%), by Type 2024 & 2032
- Figure 35: Europe UK Bunker Fuel Industry Revenue (Million), by Vessel Type 2024 & 2032
- Figure 36: Europe UK Bunker Fuel Industry Volume (K Tons), by Vessel Type 2024 & 2032
- Figure 37: Europe UK Bunker Fuel Industry Revenue Share (%), by Vessel Type 2024 & 2032
- Figure 38: Europe UK Bunker Fuel Industry Volume Share (%), by Vessel Type 2024 & 2032
- Figure 39: Europe UK Bunker Fuel Industry Revenue (Million), by Country 2024 & 2032
- Figure 40: Europe UK Bunker Fuel Industry Volume (K Tons), by Country 2024 & 2032
- Figure 41: Europe UK Bunker Fuel Industry Revenue Share (%), by Country 2024 & 2032
- Figure 42: Europe UK Bunker Fuel Industry Volume Share (%), by Country 2024 & 2032
- Figure 43: Middle East & Africa UK Bunker Fuel Industry Revenue (Million), by Type 2024 & 2032
- Figure 44: Middle East & Africa UK Bunker Fuel Industry Volume (K Tons), by Type 2024 & 2032
- Figure 45: Middle East & Africa UK Bunker Fuel Industry Revenue Share (%), by Type 2024 & 2032
- Figure 46: Middle East & Africa UK Bunker Fuel Industry Volume Share (%), by Type 2024 & 2032
- Figure 47: Middle East & Africa UK Bunker Fuel Industry Revenue (Million), by Vessel Type 2024 & 2032
- Figure 48: Middle East & Africa UK Bunker Fuel Industry Volume (K Tons), by Vessel Type 2024 & 2032
- Figure 49: Middle East & Africa UK Bunker Fuel Industry Revenue Share (%), by Vessel Type 2024 & 2032
- Figure 50: Middle East & Africa UK Bunker Fuel Industry Volume Share (%), by Vessel Type 2024 & 2032
- Figure 51: Middle East & Africa UK Bunker Fuel Industry Revenue (Million), by Country 2024 & 2032
- Figure 52: Middle East & Africa UK Bunker Fuel Industry Volume (K Tons), by Country 2024 & 2032
- Figure 53: Middle East & Africa UK Bunker Fuel Industry Revenue Share (%), by Country 2024 & 2032
- Figure 54: Middle East & Africa UK Bunker Fuel Industry Volume Share (%), by Country 2024 & 2032
- Figure 55: Asia Pacific UK Bunker Fuel Industry Revenue (Million), by Type 2024 & 2032
- Figure 56: Asia Pacific UK Bunker Fuel Industry Volume (K Tons), by Type 2024 & 2032
- Figure 57: Asia Pacific UK Bunker Fuel Industry Revenue Share (%), by Type 2024 & 2032
- Figure 58: Asia Pacific UK Bunker Fuel Industry Volume Share (%), by Type 2024 & 2032
- Figure 59: Asia Pacific UK Bunker Fuel Industry Revenue (Million), by Vessel Type 2024 & 2032
- Figure 60: Asia Pacific UK Bunker Fuel Industry Volume (K Tons), by Vessel Type 2024 & 2032
- Figure 61: Asia Pacific UK Bunker Fuel Industry Revenue Share (%), by Vessel Type 2024 & 2032
- Figure 62: Asia Pacific UK Bunker Fuel Industry Volume Share (%), by Vessel Type 2024 & 2032
- Figure 63: Asia Pacific UK Bunker Fuel Industry Revenue (Million), by Country 2024 & 2032
- Figure 64: Asia Pacific UK Bunker Fuel Industry Volume (K Tons), by Country 2024 & 2032
- Figure 65: Asia Pacific UK Bunker Fuel Industry Revenue Share (%), by Country 2024 & 2032
- Figure 66: Asia Pacific UK Bunker Fuel Industry Volume Share (%), by Country 2024 & 2032
List of Tables
- Table 1: Global UK Bunker Fuel Industry Revenue Million Forecast, by Region 2019 & 2032
- Table 2: Global UK Bunker Fuel Industry Volume K Tons Forecast, by Region 2019 & 2032
- Table 3: Global UK Bunker Fuel Industry Revenue Million Forecast, by Type 2019 & 2032
- Table 4: Global UK Bunker Fuel Industry Volume K Tons Forecast, by Type 2019 & 2032
- Table 5: Global UK Bunker Fuel Industry Revenue Million Forecast, by Vessel Type 2019 & 2032
- Table 6: Global UK Bunker Fuel Industry Volume K Tons Forecast, by Vessel Type 2019 & 2032
- Table 7: Global UK Bunker Fuel Industry Revenue Million Forecast, by Region 2019 & 2032
- Table 8: Global UK Bunker Fuel Industry Volume K Tons Forecast, by Region 2019 & 2032
- Table 9: Global UK Bunker Fuel Industry Revenue Million Forecast, by Country 2019 & 2032
- Table 10: Global UK Bunker Fuel Industry Volume K Tons Forecast, by Country 2019 & 2032
- Table 11: England UK Bunker Fuel Industry Revenue (Million) Forecast, by Application 2019 & 2032
- Table 12: England UK Bunker Fuel Industry Volume (K Tons) Forecast, by Application 2019 & 2032
- Table 13: Wales UK Bunker Fuel Industry Revenue (Million) Forecast, by Application 2019 & 2032
- Table 14: Wales UK Bunker Fuel Industry Volume (K Tons) Forecast, by Application 2019 & 2032
- Table 15: Scotland UK Bunker Fuel Industry Revenue (Million) Forecast, by Application 2019 & 2032
- Table 16: Scotland UK Bunker Fuel Industry Volume (K Tons) Forecast, by Application 2019 & 2032
- Table 17: Northern UK Bunker Fuel Industry Revenue (Million) Forecast, by Application 2019 & 2032
- Table 18: Northern UK Bunker Fuel Industry Volume (K Tons) Forecast, by Application 2019 & 2032
- Table 19: Ireland UK Bunker Fuel Industry Revenue (Million) Forecast, by Application 2019 & 2032
- Table 20: Ireland UK Bunker Fuel Industry Volume (K Tons) Forecast, by Application 2019 & 2032
- Table 21: Global UK Bunker Fuel Industry Revenue Million Forecast, by Type 2019 & 2032
- Table 22: Global UK Bunker Fuel Industry Volume K Tons Forecast, by Type 2019 & 2032
- Table 23: Global UK Bunker Fuel Industry Revenue Million Forecast, by Vessel Type 2019 & 2032
- Table 24: Global UK Bunker Fuel Industry Volume K Tons Forecast, by Vessel Type 2019 & 2032
- Table 25: Global UK Bunker Fuel Industry Revenue Million Forecast, by Country 2019 & 2032
- Table 26: Global UK Bunker Fuel Industry Volume K Tons Forecast, by Country 2019 & 2032
- Table 27: United States UK Bunker Fuel Industry Revenue (Million) Forecast, by Application 2019 & 2032
- Table 28: United States UK Bunker Fuel Industry Volume (K Tons) Forecast, by Application 2019 & 2032
- Table 29: Canada UK Bunker Fuel Industry Revenue (Million) Forecast, by Application 2019 & 2032
- Table 30: Canada UK Bunker Fuel Industry Volume (K Tons) Forecast, by Application 2019 & 2032
- Table 31: Mexico UK Bunker Fuel Industry Revenue (Million) Forecast, by Application 2019 & 2032
- Table 32: Mexico UK Bunker Fuel Industry Volume (K Tons) Forecast, by Application 2019 & 2032
- Table 33: Global UK Bunker Fuel Industry Revenue Million Forecast, by Type 2019 & 2032
- Table 34: Global UK Bunker Fuel Industry Volume K Tons Forecast, by Type 2019 & 2032
- Table 35: Global UK Bunker Fuel Industry Revenue Million Forecast, by Vessel Type 2019 & 2032
- Table 36: Global UK Bunker Fuel Industry Volume K Tons Forecast, by Vessel Type 2019 & 2032
- Table 37: Global UK Bunker Fuel Industry Revenue Million Forecast, by Country 2019 & 2032
- Table 38: Global UK Bunker Fuel Industry Volume K Tons Forecast, by Country 2019 & 2032
- Table 39: Brazil UK Bunker Fuel Industry Revenue (Million) Forecast, by Application 2019 & 2032
- Table 40: Brazil UK Bunker Fuel Industry Volume (K Tons) Forecast, by Application 2019 & 2032
- Table 41: Argentina UK Bunker Fuel Industry Revenue (Million) Forecast, by Application 2019 & 2032
- Table 42: Argentina UK Bunker Fuel Industry Volume (K Tons) Forecast, by Application 2019 & 2032
- Table 43: Rest of South America UK Bunker Fuel Industry Revenue (Million) Forecast, by Application 2019 & 2032
- Table 44: Rest of South America UK Bunker Fuel Industry Volume (K Tons) Forecast, by Application 2019 & 2032
- Table 45: Global UK Bunker Fuel Industry Revenue Million Forecast, by Type 2019 & 2032
- Table 46: Global UK Bunker Fuel Industry Volume K Tons Forecast, by Type 2019 & 2032
- Table 47: Global UK Bunker Fuel Industry Revenue Million Forecast, by Vessel Type 2019 & 2032
- Table 48: Global UK Bunker Fuel Industry Volume K Tons Forecast, by Vessel Type 2019 & 2032
- Table 49: Global UK Bunker Fuel Industry Revenue Million Forecast, by Country 2019 & 2032
- Table 50: Global UK Bunker Fuel Industry Volume K Tons Forecast, by Country 2019 & 2032
- Table 51: United Kingdom UK Bunker Fuel Industry Revenue (Million) Forecast, by Application 2019 & 2032
- Table 52: United Kingdom UK Bunker Fuel Industry Volume (K Tons) Forecast, by Application 2019 & 2032
- Table 53: Germany UK Bunker Fuel Industry Revenue (Million) Forecast, by Application 2019 & 2032
- Table 54: Germany UK Bunker Fuel Industry Volume (K Tons) Forecast, by Application 2019 & 2032
- Table 55: France UK Bunker Fuel Industry Revenue (Million) Forecast, by Application 2019 & 2032
- Table 56: France UK Bunker Fuel Industry Volume (K Tons) Forecast, by Application 2019 & 2032
- Table 57: Italy UK Bunker Fuel Industry Revenue (Million) Forecast, by Application 2019 & 2032
- Table 58: Italy UK Bunker Fuel Industry Volume (K Tons) Forecast, by Application 2019 & 2032
- Table 59: Spain UK Bunker Fuel Industry Revenue (Million) Forecast, by Application 2019 & 2032
- Table 60: Spain UK Bunker Fuel Industry Volume (K Tons) Forecast, by Application 2019 & 2032
- Table 61: Russia UK Bunker Fuel Industry Revenue (Million) Forecast, by Application 2019 & 2032
- Table 62: Russia UK Bunker Fuel Industry Volume (K Tons) Forecast, by Application 2019 & 2032
- Table 63: Benelux UK Bunker Fuel Industry Revenue (Million) Forecast, by Application 2019 & 2032
- Table 64: Benelux UK Bunker Fuel Industry Volume (K Tons) Forecast, by Application 2019 & 2032
- Table 65: Nordics UK Bunker Fuel Industry Revenue (Million) Forecast, by Application 2019 & 2032
- Table 66: Nordics UK Bunker Fuel Industry Volume (K Tons) Forecast, by Application 2019 & 2032
- Table 67: Rest of Europe UK Bunker Fuel Industry Revenue (Million) Forecast, by Application 2019 & 2032
- Table 68: Rest of Europe UK Bunker Fuel Industry Volume (K Tons) Forecast, by Application 2019 & 2032
- Table 69: Global UK Bunker Fuel Industry Revenue Million Forecast, by Type 2019 & 2032
- Table 70: Global UK Bunker Fuel Industry Volume K Tons Forecast, by Type 2019 & 2032
- Table 71: Global UK Bunker Fuel Industry Revenue Million Forecast, by Vessel Type 2019 & 2032
- Table 72: Global UK Bunker Fuel Industry Volume K Tons Forecast, by Vessel Type 2019 & 2032
- Table 73: Global UK Bunker Fuel Industry Revenue Million Forecast, by Country 2019 & 2032
- Table 74: Global UK Bunker Fuel Industry Volume K Tons Forecast, by Country 2019 & 2032
- Table 75: Turkey UK Bunker Fuel Industry Revenue (Million) Forecast, by Application 2019 & 2032
- Table 76: Turkey UK Bunker Fuel Industry Volume (K Tons) Forecast, by Application 2019 & 2032
- Table 77: Israel UK Bunker Fuel Industry Revenue (Million) Forecast, by Application 2019 & 2032
- Table 78: Israel UK Bunker Fuel Industry Volume (K Tons) Forecast, by Application 2019 & 2032
- Table 79: GCC UK Bunker Fuel Industry Revenue (Million) Forecast, by Application 2019 & 2032
- Table 80: GCC UK Bunker Fuel Industry Volume (K Tons) Forecast, by Application 2019 & 2032
- Table 81: North Africa UK Bunker Fuel Industry Revenue (Million) Forecast, by Application 2019 & 2032
- Table 82: North Africa UK Bunker Fuel Industry Volume (K Tons) Forecast, by Application 2019 & 2032
- Table 83: South Africa UK Bunker Fuel Industry Revenue (Million) Forecast, by Application 2019 & 2032
- Table 84: South Africa UK Bunker Fuel Industry Volume (K Tons) Forecast, by Application 2019 & 2032
- Table 85: Rest of Middle East & Africa UK Bunker Fuel Industry Revenue (Million) Forecast, by Application 2019 & 2032
- Table 86: Rest of Middle East & Africa UK Bunker Fuel Industry Volume (K Tons) Forecast, by Application 2019 & 2032
- Table 87: Global UK Bunker Fuel Industry Revenue Million Forecast, by Type 2019 & 2032
- Table 88: Global UK Bunker Fuel Industry Volume K Tons Forecast, by Type 2019 & 2032
- Table 89: Global UK Bunker Fuel Industry Revenue Million Forecast, by Vessel Type 2019 & 2032
- Table 90: Global UK Bunker Fuel Industry Volume K Tons Forecast, by Vessel Type 2019 & 2032
- Table 91: Global UK Bunker Fuel Industry Revenue Million Forecast, by Country 2019 & 2032
- Table 92: Global UK Bunker Fuel Industry Volume K Tons Forecast, by Country 2019 & 2032
- Table 93: China UK Bunker Fuel Industry Revenue (Million) Forecast, by Application 2019 & 2032
- Table 94: China UK Bunker Fuel Industry Volume (K Tons) Forecast, by Application 2019 & 2032
- Table 95: India UK Bunker Fuel Industry Revenue (Million) Forecast, by Application 2019 & 2032
- Table 96: India UK Bunker Fuel Industry Volume (K Tons) Forecast, by Application 2019 & 2032
- Table 97: Japan UK Bunker Fuel Industry Revenue (Million) Forecast, by Application 2019 & 2032
- Table 98: Japan UK Bunker Fuel Industry Volume (K Tons) Forecast, by Application 2019 & 2032
- Table 99: South Korea UK Bunker Fuel Industry Revenue (Million) Forecast, by Application 2019 & 2032
- Table 100: South Korea UK Bunker Fuel Industry Volume (K Tons) Forecast, by Application 2019 & 2032
- Table 101: ASEAN UK Bunker Fuel Industry Revenue (Million) Forecast, by Application 2019 & 2032
- Table 102: ASEAN UK Bunker Fuel Industry Volume (K Tons) Forecast, by Application 2019 & 2032
- Table 103: Oceania UK Bunker Fuel Industry Revenue (Million) Forecast, by Application 2019 & 2032
- Table 104: Oceania UK Bunker Fuel Industry Volume (K Tons) Forecast, by Application 2019 & 2032
- Table 105: Rest of Asia Pacific UK Bunker Fuel Industry Revenue (Million) Forecast, by Application 2019 & 2032
- Table 106: Rest of Asia Pacific UK Bunker Fuel Industry Volume (K Tons) Forecast, by Application 2019 & 2032
Frequently Asked Questions
1. What is the projected Compound Annual Growth Rate (CAGR) of the UK Bunker Fuel Industry?
The projected CAGR is approximately > 14.00%.
2. Which companies are prominent players in the UK Bunker Fuel Industry?
Key companies in the market include Phillips 66, Maritime Bunkering Ltd, GB Oils Ltd, Shell Marine Products Ltd, Exxon Mobil Corporation, Mærsk A/S, ConocoPhillips Ltd, Greenergy International Ltd, Rosneft Marine UK Ltd *List Not Exhaustive, BP PLC, Henty Oil Ltd.
3. What are the main segments of the UK Bunker Fuel Industry?
The market segments include Type, Vessel Type.
4. Can you provide details about the market size?
The market size is estimated to be USD 7860 Million as of 2022.
5. What are some drivers contributing to market growth?
4.; Increasing Demand for Petroleum Products Due to the Growth of the Local Economy4.; Government Initiatives to Boost the Production of Crude Oil and Natural Gas.
6. What are the notable trends driving market growth?
Very Low Sulphur Fuel Oil (VLSFO) to Witness Significant Growth.
7. Are there any restraints impacting market growth?
4.; Increasing Adoption of Renewable Energy.
8. Can you provide examples of recent developments in the market?
Investments in LNG bunkering infrastructure and partnerships
9. What pricing options are available for accessing the report?
Pricing options include single-user, multi-user, and enterprise licenses priced at USD 3800, USD 4500, and USD 5800 respectively.
10. Is the market size provided in terms of value or volume?
The market size is provided in terms of value, measured in Million and volume, measured in K Tons.
11. Are there any specific market keywords associated with the report?
Yes, the market keyword associated with the report is "UK Bunker Fuel Industry," which aids in identifying and referencing the specific market segment covered.
12. How do I determine which pricing option suits my needs best?
The pricing options vary based on user requirements and access needs. Individual users may opt for single-user licenses, while businesses requiring broader access may choose multi-user or enterprise licenses for cost-effective access to the report.
13. Are there any additional resources or data provided in the UK Bunker Fuel Industry report?
While the report offers comprehensive insights, it's advisable to review the specific contents or supplementary materials provided to ascertain if additional resources or data are available.
14. How can I stay updated on further developments or reports in the UK Bunker Fuel Industry?
To stay informed about further developments, trends, and reports in the UK Bunker Fuel Industry, consider subscribing to industry newsletters, following relevant companies and organizations, or regularly checking reputable industry news sources and publications.
Methodology
Step 1 - Identification of Relevant Samples Size from Population Database


Step 2 - Approaches for Defining Global Market Size (Value, Volume* & Price*)

Note*: In applicable scenarios
Step 3 - Data Sources
Primary Research
- Web Analytics
- Survey Reports
- Research Institute
- Latest Research Reports
- Opinion Leaders
Secondary Research
- Annual Reports
- White Paper
- Latest Press Release
- Industry Association
- Paid Database
- Investor Presentations

Step 4 - Data Triangulation
Involves using different sources of information in order to increase the validity of a study
These sources are likely to be stakeholders in a program - participants, other researchers, program staff, other community members, and so on.
Then we put all data in single framework & apply various statistical tools to find out the dynamic on the market.
During the analysis stage, feedback from the stakeholder groups would be compared to determine areas of agreement as well as areas of divergence


