
Key Insights
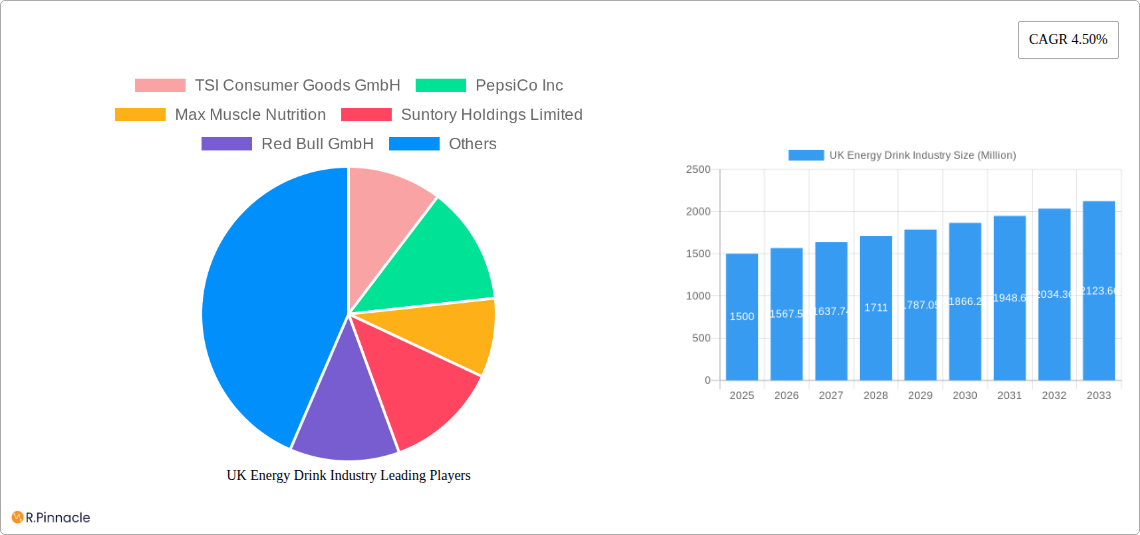
The UK energy drink market, valued at approximately £1.5 billion in 2025, exhibits a robust growth trajectory, projected to expand at a compound annual growth rate (CAGR) of 4.5% from 2025 to 2033. This growth is fueled by several key factors. The increasing prevalence of busy lifestyles and demanding work schedules among young adults and professionals is driving demand for convenient and readily available energy boosts. Health and wellness trends are also influencing the market, with a growing segment of consumers seeking healthier alternatives, such as energy drinks with natural ingredients or lower sugar content. Furthermore, innovative product development, including the introduction of new flavors, functional benefits (e.g., added vitamins or electrolytes), and sustainable packaging options, further stimulates market expansion. The dominance of established brands like Red Bull and Coca-Cola is challenged by smaller, more specialized players capitalizing on niche consumer demands.
However, the market's growth is not without constraints. Increasing health concerns surrounding high sugar and caffeine content are leading to stricter regulations and consumer awareness campaigns, impacting sales. Price sensitivity, particularly among budget-conscious consumers, is another factor influencing purchase decisions. Competition within the market remains intense, with established brands facing challenges from new entrants and private label products. The distribution landscape is also evolving, with online retail channels gaining traction while traditional channels such as supermarkets and convenience stores maintain their significance. The continued growth of the UK energy drink market will hinge on the industry's ability to adapt to evolving consumer preferences, address health concerns, and innovate to maintain a competitive edge. Strategic partnerships, brand building, and targeted marketing efforts will be crucial for sustained success.
UK Energy Drink Industry Report: 2019-2033
This comprehensive report provides a detailed analysis of the UK energy drink industry, offering invaluable insights for industry professionals, investors, and strategic decision-makers. Covering the period 2019-2033, with a focus on 2025, this report unveils the market's structure, dynamics, and future potential. The report leverages robust data and analysis to provide actionable intelligence for navigating this dynamic market. The UK energy drink market is projected to reach £xx Million by 2033.
UK Energy Drink Industry Market Structure & Innovation Trends
This section analyzes the competitive landscape, innovation drivers, and regulatory environment of the UK energy drink market. We examine market concentration, identifying key players and their market share, alongside an assessment of M&A activity and its impact. The report also explores the influence of regulatory frameworks, the emergence of product substitutes, and evolving end-user demographics.
- Market Concentration: The UK energy drink market is characterized by a high degree of concentration, with major players like PepsiCo Inc, Red Bull GmbH, and The Coca-Cola Company holding significant market share. Smaller players like TSI Consumer Goods GmbH, Monster Energy Company and Suntory Holdings Limited are also actively competing. We provide detailed market share breakdowns for each company.
- Innovation Drivers: Health-conscious trends are driving innovation with a focus on low-sugar, natural, and plant-based options. The rise of functional energy drinks, incorporating added vitamins and other beneficial ingredients, also presents a significant innovation driver. The launch of products like Virtue Clean Energy (zero sugar, zero calorie) exemplifies this trend.
- Regulatory Frameworks: Existing regulations related to labelling, ingredients, and marketing significantly influence market dynamics. Any changes in these regulations will be analysed within this section.
- M&A Activity: The report includes an analysis of mergers and acquisitions within the sector. We assess deal values and implications on market share and competition. The total value of M&A deals within the study period is estimated to be £xx Million.
- Product Substitutes: The rise of functional beverages and other non-energy drink options provides viable substitutes which are considered.
- End-User Demographics: The report details the demographic segments consuming energy drinks, including age groups, lifestyle preferences, and socio-economic factors.
UK Energy Drink Industry Market Dynamics & Trends
This section explores the key factors driving market growth, technological advancements impacting the industry, shifts in consumer preferences, and the evolving competitive dynamics.
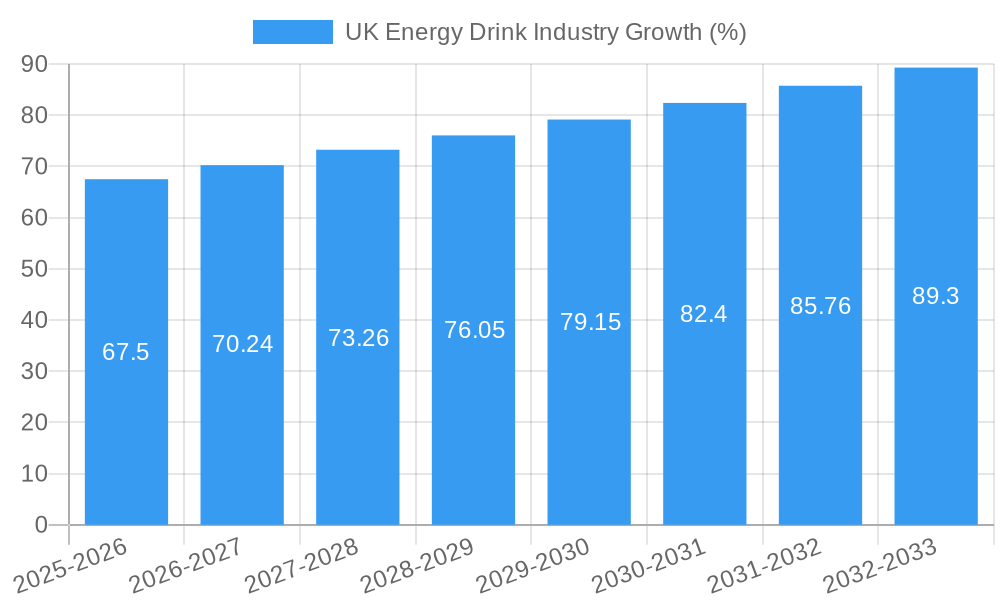
The UK energy drink market has witnessed significant growth driven by increasing consumer demand. This is fueled by changing lifestyles, demanding work schedules, and rising disposable incomes, leading to a considerable market penetration. The Compound Annual Growth Rate (CAGR) from 2019 to 2024 is estimated to be xx%, while we project a CAGR of xx% during the forecast period (2025-2033). This growth is influenced by factors such as the introduction of innovative products, increased health awareness, and changes in consumer behavior. The changing preference for healthier alternatives, including plant-based and low-sugar options, is a key dynamic affecting the market. Competition remains fierce among established players and emerging brands, with price wars, promotions, and product differentiation impacting market dynamics.
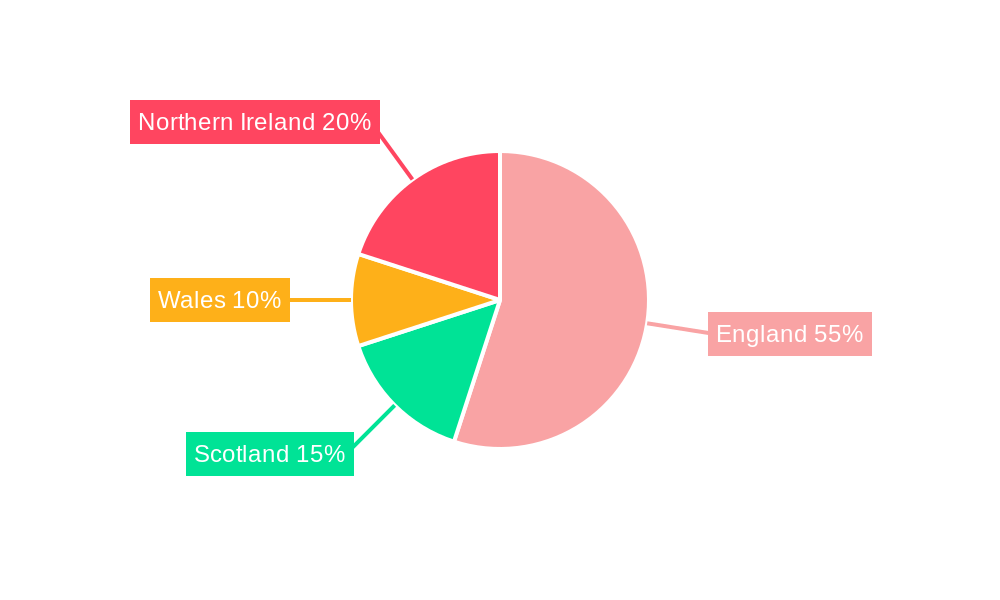
Dominant Regions & Segments in UK Energy Drink Industry
This section identifies the leading regions and segments within the UK energy drink market. We analyse the performance of various segments based on packaging type, product type, and distribution channel. The findings highlight the specific drivers of dominance in each segment.
By Packaging Type:
- Cans: This segment dominates due to its convenience, portability, and established consumer preference.
- PET Bottles: This segment is showing growth, particularly among health-conscious consumers opting for larger volumes and possibly perceived better recyclability.
By Product Type:
- Drinks: This remains the largest segment, with a wide range of flavours and formulations available.
- Shots: The shots segment is growing in popularity due to its convenient and fast energy delivery.
- Mixers: This segment offers opportunities for innovation with the addition of functional ingredients and flavours.
By Distribution Channel:
- Supermarkets/Hypermarkets: The largest distribution channel due to wide reach and established retail infrastructure.
- Convenience Stores: Strong performance due to its strategic location, high footfall and impulse purchases.
- Specialist Stores: A smaller segment but growing as health food stores and speciality shops expand.
- Online Retail Stores: This channel is growing steadily alongside increasing e-commerce trends.
- Other Distribution Channels: This includes restaurants, gyms, and other outlets.
UK Energy Drink Industry Product Innovations
Recent years have seen a surge in product innovation, driven by changing consumer demands. The emergence of healthier, more natural, and functional energy drinks represents a significant trend. Brands are actively incorporating plant-based ingredients, reducing sugar content, and highlighting organic certifications as a way to enhance their competitive advantage. Companies like PerfectTed with its matcha-based drinks, and Tenzing with its plant-based shots, illustrate the shift towards healthier product options. This emphasis on health-conscious formulations is driving market growth, capturing a consumer segment that may have previously avoided traditional energy drinks.
Report Scope & Segmentation Analysis
This report segments the UK energy drink market across packaging type (cans, PET bottles), product type (drinks, shots, mixers), and distribution channels (supermarkets/hypermarkets, convenience stores, specialist stores, online retail stores, other). Each segment is analyzed to estimate market size, growth projections, and competitive dynamics for the period 2019-2033. Detailed breakdowns for each segment, including market size estimations and growth rate forecasts, are provided within the full report.
Key Drivers of UK Energy Drink Industry Growth
Several factors contribute to the growth of the UK energy drink market. Technological advancements, in formulation and packaging, continuously improve product offerings, catering to specific consumer needs. The expanding middle class and increasing disposable incomes provide a larger consumer base. Additionally, favourable regulatory environments, allowing for product diversification, stimulate market expansion.
Challenges in the UK Energy Drink Industry Sector
The UK energy drink market faces several challenges. Stringent regulations regarding ingredients and labelling impose compliance costs and limit product formulations. Supply chain disruptions and rising ingredient costs affect profitability. Furthermore, intense competition among established and emerging players pressures pricing and profit margins.
Emerging Opportunities in UK Energy Drink Industry
Growing demand for functional energy drinks, incorporating health benefits beyond energy boosts, presents significant opportunities. The expanding e-commerce sector offers new distribution channels. Moreover, tapping into niche segments, including vegan and plant-based options, allows for further market expansion.
Leading Players in the UK Energy Drink Industry Market
- TSI Consumer Goods GmbH
- PepsiCo Inc
- Max Muscle Nutrition
- Suntory Holdings Limited
- Red Bull GmbH
- The Coca-Cola Company
- Nestle SA
- Global Trade Holdings Co Ltd
- Monster Energy Company
- GlaxoSmithKline PLC
Key Developments in UK Energy Drink Industry
- September 2022: Launch of Virtue Clean Energy, a zero-sugar, zero-calorie energy drink, highlighting the growing demand for healthier options.
- June 2022: Tenzing launched two new plant-based energy shots, reflecting the rising popularity of plant-based products.
- March 2022: PerfectTed launched a range of canned natural energy drinks powered by matcha green tea, further emphasizing the trend towards natural and healthier alternatives.
Future Outlook for UK Energy Drink Industry Market
The UK energy drink market is poised for continued growth driven by ongoing product innovation, focused on health and functionality, and expanding distribution channels. Strategic partnerships and acquisitions will play a crucial role in shaping the competitive landscape. Emerging trends, such as the increasing preference for plant-based and low-sugar options, will continue to influence future market development and opportunities.
UK Energy Drink Industry Segmentation
-
1. Packaging Type
- 1.1. Can
- 1.2. PET Bottle
-
2. Product Type
- 2.1. Drinks
- 2.2. Shots
- 2.3. Mixers
-
3. Distribution Channel
- 3.1. Supermarkets/Hypermarkets
- 3.2. Convenience Stores
- 3.3. Specalist Stores
- 3.4. Online Retail Stores
- 3.5. Other Distribution Channels
UK Energy Drink Industry Segmentation By Geography
-
1. North America
- 1.1. United States
- 1.2. Canada
- 1.3. Mexico
-
2. South America
- 2.1. Brazil
- 2.2. Argentina
- 2.3. Rest of South America
-
3. Europe
- 3.1. United Kingdom
- 3.2. Germany
- 3.3. France
- 3.4. Italy
- 3.5. Spain
- 3.6. Russia
- 3.7. Benelux
- 3.8. Nordics
- 3.9. Rest of Europe
-
4. Middle East & Africa
- 4.1. Turkey
- 4.2. Israel
- 4.3. GCC
- 4.4. North Africa
- 4.5. South Africa
- 4.6. Rest of Middle East & Africa
-
5. Asia Pacific
- 5.1. China
- 5.2. India
- 5.3. Japan
- 5.4. South Korea
- 5.5. ASEAN
- 5.6. Oceania
- 5.7. Rest of Asia Pacific
UK Energy Drink Industry REPORT HIGHLIGHTS
| Aspects | Details |
|---|---|
| Study Period | 2019-2033 |
| Base Year | 2024 |
| Estimated Year | 2025 |
| Forecast Period | 2025-2033 |
| Historical Period | 2019-2024 |
| Growth Rate | CAGR of 4.50% from 2019-2033 |
| Segmentation |
|
Table of Contents
- 1. Introduction
- 1.1. Research Scope
- 1.2. Market Segmentation
- 1.3. Research Methodology
- 1.4. Definitions and Assumptions
- 2. Executive Summary
- 2.1. Introduction
- 3. Market Dynamics
- 3.1. Introduction
- 3.2. Market Drivers
- 3.2.1. Rising Health & Wellness Trends; Strategic Initiatives By Key Players
- 3.3. Market Restrains
- 3.3.1. Cost Considerations Coupled With Availability Of Alternatives
- 3.4. Market Trends
- 3.4.1. The Drinks Segment Dominates the Energy Drink Market
- 4. Market Factor Analysis
- 4.1. Porters Five Forces
- 4.2. Supply/Value Chain
- 4.3. PESTEL analysis
- 4.4. Market Entropy
- 4.5. Patent/Trademark Analysis
- 5. Global UK Energy Drink Industry Analysis, Insights and Forecast, 2019-2031
- 5.1. Market Analysis, Insights and Forecast - by Packaging Type
- 5.1.1. Can
- 5.1.2. PET Bottle
- 5.2. Market Analysis, Insights and Forecast - by Product Type
- 5.2.1. Drinks
- 5.2.2. Shots
- 5.2.3. Mixers
- 5.3. Market Analysis, Insights and Forecast - by Distribution Channel
- 5.3.1. Supermarkets/Hypermarkets
- 5.3.2. Convenience Stores
- 5.3.3. Specalist Stores
- 5.3.4. Online Retail Stores
- 5.3.5. Other Distribution Channels
- 5.4. Market Analysis, Insights and Forecast - by Region
- 5.4.1. North America
- 5.4.2. South America
- 5.4.3. Europe
- 5.4.4. Middle East & Africa
- 5.4.5. Asia Pacific
- 5.1. Market Analysis, Insights and Forecast - by Packaging Type
- 6. North America UK Energy Drink Industry Analysis, Insights and Forecast, 2019-2031
- 6.1. Market Analysis, Insights and Forecast - by Packaging Type
- 6.1.1. Can
- 6.1.2. PET Bottle
- 6.2. Market Analysis, Insights and Forecast - by Product Type
- 6.2.1. Drinks
- 6.2.2. Shots
- 6.2.3. Mixers
- 6.3. Market Analysis, Insights and Forecast - by Distribution Channel
- 6.3.1. Supermarkets/Hypermarkets
- 6.3.2. Convenience Stores
- 6.3.3. Specalist Stores
- 6.3.4. Online Retail Stores
- 6.3.5. Other Distribution Channels
- 6.1. Market Analysis, Insights and Forecast - by Packaging Type
- 7. South America UK Energy Drink Industry Analysis, Insights and Forecast, 2019-2031
- 7.1. Market Analysis, Insights and Forecast - by Packaging Type
- 7.1.1. Can
- 7.1.2. PET Bottle
- 7.2. Market Analysis, Insights and Forecast - by Product Type
- 7.2.1. Drinks
- 7.2.2. Shots
- 7.2.3. Mixers
- 7.3. Market Analysis, Insights and Forecast - by Distribution Channel
- 7.3.1. Supermarkets/Hypermarkets
- 7.3.2. Convenience Stores
- 7.3.3. Specalist Stores
- 7.3.4. Online Retail Stores
- 7.3.5. Other Distribution Channels
- 7.1. Market Analysis, Insights and Forecast - by Packaging Type
- 8. Europe UK Energy Drink Industry Analysis, Insights and Forecast, 2019-2031
- 8.1. Market Analysis, Insights and Forecast - by Packaging Type
- 8.1.1. Can
- 8.1.2. PET Bottle
- 8.2. Market Analysis, Insights and Forecast - by Product Type
- 8.2.1. Drinks
- 8.2.2. Shots
- 8.2.3. Mixers
- 8.3. Market Analysis, Insights and Forecast - by Distribution Channel
- 8.3.1. Supermarkets/Hypermarkets
- 8.3.2. Convenience Stores
- 8.3.3. Specalist Stores
- 8.3.4. Online Retail Stores
- 8.3.5. Other Distribution Channels
- 8.1. Market Analysis, Insights and Forecast - by Packaging Type
- 9. Middle East & Africa UK Energy Drink Industry Analysis, Insights and Forecast, 2019-2031
- 9.1. Market Analysis, Insights and Forecast - by Packaging Type
- 9.1.1. Can
- 9.1.2. PET Bottle
- 9.2. Market Analysis, Insights and Forecast - by Product Type
- 9.2.1. Drinks
- 9.2.2. Shots
- 9.2.3. Mixers
- 9.3. Market Analysis, Insights and Forecast - by Distribution Channel
- 9.3.1. Supermarkets/Hypermarkets
- 9.3.2. Convenience Stores
- 9.3.3. Specalist Stores
- 9.3.4. Online Retail Stores
- 9.3.5. Other Distribution Channels
- 9.1. Market Analysis, Insights and Forecast - by Packaging Type
- 10. Asia Pacific UK Energy Drink Industry Analysis, Insights and Forecast, 2019-2031
- 10.1. Market Analysis, Insights and Forecast - by Packaging Type
- 10.1.1. Can
- 10.1.2. PET Bottle
- 10.2. Market Analysis, Insights and Forecast - by Product Type
- 10.2.1. Drinks
- 10.2.2. Shots
- 10.2.3. Mixers
- 10.3. Market Analysis, Insights and Forecast - by Distribution Channel
- 10.3.1. Supermarkets/Hypermarkets
- 10.3.2. Convenience Stores
- 10.3.3. Specalist Stores
- 10.3.4. Online Retail Stores
- 10.3.5. Other Distribution Channels
- 10.1. Market Analysis, Insights and Forecast - by Packaging Type
- 11. England UK Energy Drink Industry Analysis, Insights and Forecast, 2019-2031
- 12. Wales UK Energy Drink Industry Analysis, Insights and Forecast, 2019-2031
- 13. Scotland UK Energy Drink Industry Analysis, Insights and Forecast, 2019-2031
- 14. Northern UK Energy Drink Industry Analysis, Insights and Forecast, 2019-2031
- 15. Ireland UK Energy Drink Industry Analysis, Insights and Forecast, 2019-2031
- 16. Competitive Analysis
- 16.1. Global Market Share Analysis 2024
- 16.2. Company Profiles
- 16.2.1 TSI Consumer Goods GmbH
- 16.2.1.1. Overview
- 16.2.1.2. Products
- 16.2.1.3. SWOT Analysis
- 16.2.1.4. Recent Developments
- 16.2.1.5. Financials (Based on Availability)
- 16.2.2 PepsiCo Inc
- 16.2.2.1. Overview
- 16.2.2.2. Products
- 16.2.2.3. SWOT Analysis
- 16.2.2.4. Recent Developments
- 16.2.2.5. Financials (Based on Availability)
- 16.2.3 Max Muscle Nutrition
- 16.2.3.1. Overview
- 16.2.3.2. Products
- 16.2.3.3. SWOT Analysis
- 16.2.3.4. Recent Developments
- 16.2.3.5. Financials (Based on Availability)
- 16.2.4 Suntory Holdings Limited
- 16.2.4.1. Overview
- 16.2.4.2. Products
- 16.2.4.3. SWOT Analysis
- 16.2.4.4. Recent Developments
- 16.2.4.5. Financials (Based on Availability)
- 16.2.5 Red Bull GmbH
- 16.2.5.1. Overview
- 16.2.5.2. Products
- 16.2.5.3. SWOT Analysis
- 16.2.5.4. Recent Developments
- 16.2.5.5. Financials (Based on Availability)
- 16.2.6 The Coca-Cola Company
- 16.2.6.1. Overview
- 16.2.6.2. Products
- 16.2.6.3. SWOT Analysis
- 16.2.6.4. Recent Developments
- 16.2.6.5. Financials (Based on Availability)
- 16.2.7 Nestle SA*List Not Exhaustive
- 16.2.7.1. Overview
- 16.2.7.2. Products
- 16.2.7.3. SWOT Analysis
- 16.2.7.4. Recent Developments
- 16.2.7.5. Financials (Based on Availability)
- 16.2.8 Global Trade Holdings Co Ltd
- 16.2.8.1. Overview
- 16.2.8.2. Products
- 16.2.8.3. SWOT Analysis
- 16.2.8.4. Recent Developments
- 16.2.8.5. Financials (Based on Availability)
- 16.2.9 Monster Energy Company
- 16.2.9.1. Overview
- 16.2.9.2. Products
- 16.2.9.3. SWOT Analysis
- 16.2.9.4. Recent Developments
- 16.2.9.5. Financials (Based on Availability)
- 16.2.10 GlaxoSmithKline PLC
- 16.2.10.1. Overview
- 16.2.10.2. Products
- 16.2.10.3. SWOT Analysis
- 16.2.10.4. Recent Developments
- 16.2.10.5. Financials (Based on Availability)
- 16.2.1 TSI Consumer Goods GmbH
List of Figures
- Figure 1: Global UK Energy Drink Industry Revenue Breakdown (Million, %) by Region 2024 & 2032
- Figure 2: Global UK Energy Drink Industry Volume Breakdown (K Liters, %) by Region 2024 & 2032
- Figure 3: United kingdom Region UK Energy Drink Industry Revenue (Million), by Country 2024 & 2032
- Figure 4: United kingdom Region UK Energy Drink Industry Volume (K Liters), by Country 2024 & 2032
- Figure 5: United kingdom Region UK Energy Drink Industry Revenue Share (%), by Country 2024 & 2032
- Figure 6: United kingdom Region UK Energy Drink Industry Volume Share (%), by Country 2024 & 2032
- Figure 7: North America UK Energy Drink Industry Revenue (Million), by Packaging Type 2024 & 2032
- Figure 8: North America UK Energy Drink Industry Volume (K Liters), by Packaging Type 2024 & 2032
- Figure 9: North America UK Energy Drink Industry Revenue Share (%), by Packaging Type 2024 & 2032
- Figure 10: North America UK Energy Drink Industry Volume Share (%), by Packaging Type 2024 & 2032
- Figure 11: North America UK Energy Drink Industry Revenue (Million), by Product Type 2024 & 2032
- Figure 12: North America UK Energy Drink Industry Volume (K Liters), by Product Type 2024 & 2032
- Figure 13: North America UK Energy Drink Industry Revenue Share (%), by Product Type 2024 & 2032
- Figure 14: North America UK Energy Drink Industry Volume Share (%), by Product Type 2024 & 2032
- Figure 15: North America UK Energy Drink Industry Revenue (Million), by Distribution Channel 2024 & 2032
- Figure 16: North America UK Energy Drink Industry Volume (K Liters), by Distribution Channel 2024 & 2032
- Figure 17: North America UK Energy Drink Industry Revenue Share (%), by Distribution Channel 2024 & 2032
- Figure 18: North America UK Energy Drink Industry Volume Share (%), by Distribution Channel 2024 & 2032
- Figure 19: North America UK Energy Drink Industry Revenue (Million), by Country 2024 & 2032
- Figure 20: North America UK Energy Drink Industry Volume (K Liters), by Country 2024 & 2032
- Figure 21: North America UK Energy Drink Industry Revenue Share (%), by Country 2024 & 2032
- Figure 22: North America UK Energy Drink Industry Volume Share (%), by Country 2024 & 2032
- Figure 23: South America UK Energy Drink Industry Revenue (Million), by Packaging Type 2024 & 2032
- Figure 24: South America UK Energy Drink Industry Volume (K Liters), by Packaging Type 2024 & 2032
- Figure 25: South America UK Energy Drink Industry Revenue Share (%), by Packaging Type 2024 & 2032
- Figure 26: South America UK Energy Drink Industry Volume Share (%), by Packaging Type 2024 & 2032
- Figure 27: South America UK Energy Drink Industry Revenue (Million), by Product Type 2024 & 2032
- Figure 28: South America UK Energy Drink Industry Volume (K Liters), by Product Type 2024 & 2032
- Figure 29: South America UK Energy Drink Industry Revenue Share (%), by Product Type 2024 & 2032
- Figure 30: South America UK Energy Drink Industry Volume Share (%), by Product Type 2024 & 2032
- Figure 31: South America UK Energy Drink Industry Revenue (Million), by Distribution Channel 2024 & 2032
- Figure 32: South America UK Energy Drink Industry Volume (K Liters), by Distribution Channel 2024 & 2032
- Figure 33: South America UK Energy Drink Industry Revenue Share (%), by Distribution Channel 2024 & 2032
- Figure 34: South America UK Energy Drink Industry Volume Share (%), by Distribution Channel 2024 & 2032
- Figure 35: South America UK Energy Drink Industry Revenue (Million), by Country 2024 & 2032
- Figure 36: South America UK Energy Drink Industry Volume (K Liters), by Country 2024 & 2032
- Figure 37: South America UK Energy Drink Industry Revenue Share (%), by Country 2024 & 2032
- Figure 38: South America UK Energy Drink Industry Volume Share (%), by Country 2024 & 2032
- Figure 39: Europe UK Energy Drink Industry Revenue (Million), by Packaging Type 2024 & 2032
- Figure 40: Europe UK Energy Drink Industry Volume (K Liters), by Packaging Type 2024 & 2032
- Figure 41: Europe UK Energy Drink Industry Revenue Share (%), by Packaging Type 2024 & 2032
- Figure 42: Europe UK Energy Drink Industry Volume Share (%), by Packaging Type 2024 & 2032
- Figure 43: Europe UK Energy Drink Industry Revenue (Million), by Product Type 2024 & 2032
- Figure 44: Europe UK Energy Drink Industry Volume (K Liters), by Product Type 2024 & 2032
- Figure 45: Europe UK Energy Drink Industry Revenue Share (%), by Product Type 2024 & 2032
- Figure 46: Europe UK Energy Drink Industry Volume Share (%), by Product Type 2024 & 2032
- Figure 47: Europe UK Energy Drink Industry Revenue (Million), by Distribution Channel 2024 & 2032
- Figure 48: Europe UK Energy Drink Industry Volume (K Liters), by Distribution Channel 2024 & 2032
- Figure 49: Europe UK Energy Drink Industry Revenue Share (%), by Distribution Channel 2024 & 2032
- Figure 50: Europe UK Energy Drink Industry Volume Share (%), by Distribution Channel 2024 & 2032
- Figure 51: Europe UK Energy Drink Industry Revenue (Million), by Country 2024 & 2032
- Figure 52: Europe UK Energy Drink Industry Volume (K Liters), by Country 2024 & 2032
- Figure 53: Europe UK Energy Drink Industry Revenue Share (%), by Country 2024 & 2032
- Figure 54: Europe UK Energy Drink Industry Volume Share (%), by Country 2024 & 2032
- Figure 55: Middle East & Africa UK Energy Drink Industry Revenue (Million), by Packaging Type 2024 & 2032
- Figure 56: Middle East & Africa UK Energy Drink Industry Volume (K Liters), by Packaging Type 2024 & 2032
- Figure 57: Middle East & Africa UK Energy Drink Industry Revenue Share (%), by Packaging Type 2024 & 2032
- Figure 58: Middle East & Africa UK Energy Drink Industry Volume Share (%), by Packaging Type 2024 & 2032
- Figure 59: Middle East & Africa UK Energy Drink Industry Revenue (Million), by Product Type 2024 & 2032
- Figure 60: Middle East & Africa UK Energy Drink Industry Volume (K Liters), by Product Type 2024 & 2032
- Figure 61: Middle East & Africa UK Energy Drink Industry Revenue Share (%), by Product Type 2024 & 2032
- Figure 62: Middle East & Africa UK Energy Drink Industry Volume Share (%), by Product Type 2024 & 2032
- Figure 63: Middle East & Africa UK Energy Drink Industry Revenue (Million), by Distribution Channel 2024 & 2032
- Figure 64: Middle East & Africa UK Energy Drink Industry Volume (K Liters), by Distribution Channel 2024 & 2032
- Figure 65: Middle East & Africa UK Energy Drink Industry Revenue Share (%), by Distribution Channel 2024 & 2032
- Figure 66: Middle East & Africa UK Energy Drink Industry Volume Share (%), by Distribution Channel 2024 & 2032
- Figure 67: Middle East & Africa UK Energy Drink Industry Revenue (Million), by Country 2024 & 2032
- Figure 68: Middle East & Africa UK Energy Drink Industry Volume (K Liters), by Country 2024 & 2032
- Figure 69: Middle East & Africa UK Energy Drink Industry Revenue Share (%), by Country 2024 & 2032
- Figure 70: Middle East & Africa UK Energy Drink Industry Volume Share (%), by Country 2024 & 2032
- Figure 71: Asia Pacific UK Energy Drink Industry Revenue (Million), by Packaging Type 2024 & 2032
- Figure 72: Asia Pacific UK Energy Drink Industry Volume (K Liters), by Packaging Type 2024 & 2032
- Figure 73: Asia Pacific UK Energy Drink Industry Revenue Share (%), by Packaging Type 2024 & 2032
- Figure 74: Asia Pacific UK Energy Drink Industry Volume Share (%), by Packaging Type 2024 & 2032
- Figure 75: Asia Pacific UK Energy Drink Industry Revenue (Million), by Product Type 2024 & 2032
- Figure 76: Asia Pacific UK Energy Drink Industry Volume (K Liters), by Product Type 2024 & 2032
- Figure 77: Asia Pacific UK Energy Drink Industry Revenue Share (%), by Product Type 2024 & 2032
- Figure 78: Asia Pacific UK Energy Drink Industry Volume Share (%), by Product Type 2024 & 2032
- Figure 79: Asia Pacific UK Energy Drink Industry Revenue (Million), by Distribution Channel 2024 & 2032
- Figure 80: Asia Pacific UK Energy Drink Industry Volume (K Liters), by Distribution Channel 2024 & 2032
- Figure 81: Asia Pacific UK Energy Drink Industry Revenue Share (%), by Distribution Channel 2024 & 2032
- Figure 82: Asia Pacific UK Energy Drink Industry Volume Share (%), by Distribution Channel 2024 & 2032
- Figure 83: Asia Pacific UK Energy Drink Industry Revenue (Million), by Country 2024 & 2032
- Figure 84: Asia Pacific UK Energy Drink Industry Volume (K Liters), by Country 2024 & 2032
- Figure 85: Asia Pacific UK Energy Drink Industry Revenue Share (%), by Country 2024 & 2032
- Figure 86: Asia Pacific UK Energy Drink Industry Volume Share (%), by Country 2024 & 2032
List of Tables
- Table 1: Global UK Energy Drink Industry Revenue Million Forecast, by Region 2019 & 2032
- Table 2: Global UK Energy Drink Industry Volume K Liters Forecast, by Region 2019 & 2032
- Table 3: Global UK Energy Drink Industry Revenue Million Forecast, by Packaging Type 2019 & 2032
- Table 4: Global UK Energy Drink Industry Volume K Liters Forecast, by Packaging Type 2019 & 2032
- Table 5: Global UK Energy Drink Industry Revenue Million Forecast, by Product Type 2019 & 2032
- Table 6: Global UK Energy Drink Industry Volume K Liters Forecast, by Product Type 2019 & 2032
- Table 7: Global UK Energy Drink Industry Revenue Million Forecast, by Distribution Channel 2019 & 2032
- Table 8: Global UK Energy Drink Industry Volume K Liters Forecast, by Distribution Channel 2019 & 2032
- Table 9: Global UK Energy Drink Industry Revenue Million Forecast, by Region 2019 & 2032
- Table 10: Global UK Energy Drink Industry Volume K Liters Forecast, by Region 2019 & 2032
- Table 11: Global UK Energy Drink Industry Revenue Million Forecast, by Country 2019 & 2032
- Table 12: Global UK Energy Drink Industry Volume K Liters Forecast, by Country 2019 & 2032
- Table 13: England UK Energy Drink Industry Revenue (Million) Forecast, by Application 2019 & 2032
- Table 14: England UK Energy Drink Industry Volume (K Liters) Forecast, by Application 2019 & 2032
- Table 15: Wales UK Energy Drink Industry Revenue (Million) Forecast, by Application 2019 & 2032
- Table 16: Wales UK Energy Drink Industry Volume (K Liters) Forecast, by Application 2019 & 2032
- Table 17: Scotland UK Energy Drink Industry Revenue (Million) Forecast, by Application 2019 & 2032
- Table 18: Scotland UK Energy Drink Industry Volume (K Liters) Forecast, by Application 2019 & 2032
- Table 19: Northern UK Energy Drink Industry Revenue (Million) Forecast, by Application 2019 & 2032
- Table 20: Northern UK Energy Drink Industry Volume (K Liters) Forecast, by Application 2019 & 2032
- Table 21: Ireland UK Energy Drink Industry Revenue (Million) Forecast, by Application 2019 & 2032
- Table 22: Ireland UK Energy Drink Industry Volume (K Liters) Forecast, by Application 2019 & 2032
- Table 23: Global UK Energy Drink Industry Revenue Million Forecast, by Packaging Type 2019 & 2032
- Table 24: Global UK Energy Drink Industry Volume K Liters Forecast, by Packaging Type 2019 & 2032
- Table 25: Global UK Energy Drink Industry Revenue Million Forecast, by Product Type 2019 & 2032
- Table 26: Global UK Energy Drink Industry Volume K Liters Forecast, by Product Type 2019 & 2032
- Table 27: Global UK Energy Drink Industry Revenue Million Forecast, by Distribution Channel 2019 & 2032
- Table 28: Global UK Energy Drink Industry Volume K Liters Forecast, by Distribution Channel 2019 & 2032
- Table 29: Global UK Energy Drink Industry Revenue Million Forecast, by Country 2019 & 2032
- Table 30: Global UK Energy Drink Industry Volume K Liters Forecast, by Country 2019 & 2032
- Table 31: United States UK Energy Drink Industry Revenue (Million) Forecast, by Application 2019 & 2032
- Table 32: United States UK Energy Drink Industry Volume (K Liters) Forecast, by Application 2019 & 2032
- Table 33: Canada UK Energy Drink Industry Revenue (Million) Forecast, by Application 2019 & 2032
- Table 34: Canada UK Energy Drink Industry Volume (K Liters) Forecast, by Application 2019 & 2032
- Table 35: Mexico UK Energy Drink Industry Revenue (Million) Forecast, by Application 2019 & 2032
- Table 36: Mexico UK Energy Drink Industry Volume (K Liters) Forecast, by Application 2019 & 2032
- Table 37: Global UK Energy Drink Industry Revenue Million Forecast, by Packaging Type 2019 & 2032
- Table 38: Global UK Energy Drink Industry Volume K Liters Forecast, by Packaging Type 2019 & 2032
- Table 39: Global UK Energy Drink Industry Revenue Million Forecast, by Product Type 2019 & 2032
- Table 40: Global UK Energy Drink Industry Volume K Liters Forecast, by Product Type 2019 & 2032
- Table 41: Global UK Energy Drink Industry Revenue Million Forecast, by Distribution Channel 2019 & 2032
- Table 42: Global UK Energy Drink Industry Volume K Liters Forecast, by Distribution Channel 2019 & 2032
- Table 43: Global UK Energy Drink Industry Revenue Million Forecast, by Country 2019 & 2032
- Table 44: Global UK Energy Drink Industry Volume K Liters Forecast, by Country 2019 & 2032
- Table 45: Brazil UK Energy Drink Industry Revenue (Million) Forecast, by Application 2019 & 2032
- Table 46: Brazil UK Energy Drink Industry Volume (K Liters) Forecast, by Application 2019 & 2032
- Table 47: Argentina UK Energy Drink Industry Revenue (Million) Forecast, by Application 2019 & 2032
- Table 48: Argentina UK Energy Drink Industry Volume (K Liters) Forecast, by Application 2019 & 2032
- Table 49: Rest of South America UK Energy Drink Industry Revenue (Million) Forecast, by Application 2019 & 2032
- Table 50: Rest of South America UK Energy Drink Industry Volume (K Liters) Forecast, by Application 2019 & 2032
- Table 51: Global UK Energy Drink Industry Revenue Million Forecast, by Packaging Type 2019 & 2032
- Table 52: Global UK Energy Drink Industry Volume K Liters Forecast, by Packaging Type 2019 & 2032
- Table 53: Global UK Energy Drink Industry Revenue Million Forecast, by Product Type 2019 & 2032
- Table 54: Global UK Energy Drink Industry Volume K Liters Forecast, by Product Type 2019 & 2032
- Table 55: Global UK Energy Drink Industry Revenue Million Forecast, by Distribution Channel 2019 & 2032
- Table 56: Global UK Energy Drink Industry Volume K Liters Forecast, by Distribution Channel 2019 & 2032
- Table 57: Global UK Energy Drink Industry Revenue Million Forecast, by Country 2019 & 2032
- Table 58: Global UK Energy Drink Industry Volume K Liters Forecast, by Country 2019 & 2032
- Table 59: United Kingdom UK Energy Drink Industry Revenue (Million) Forecast, by Application 2019 & 2032
- Table 60: United Kingdom UK Energy Drink Industry Volume (K Liters) Forecast, by Application 2019 & 2032
- Table 61: Germany UK Energy Drink Industry Revenue (Million) Forecast, by Application 2019 & 2032
- Table 62: Germany UK Energy Drink Industry Volume (K Liters) Forecast, by Application 2019 & 2032
- Table 63: France UK Energy Drink Industry Revenue (Million) Forecast, by Application 2019 & 2032
- Table 64: France UK Energy Drink Industry Volume (K Liters) Forecast, by Application 2019 & 2032
- Table 65: Italy UK Energy Drink Industry Revenue (Million) Forecast, by Application 2019 & 2032
- Table 66: Italy UK Energy Drink Industry Volume (K Liters) Forecast, by Application 2019 & 2032
- Table 67: Spain UK Energy Drink Industry Revenue (Million) Forecast, by Application 2019 & 2032
- Table 68: Spain UK Energy Drink Industry Volume (K Liters) Forecast, by Application 2019 & 2032
- Table 69: Russia UK Energy Drink Industry Revenue (Million) Forecast, by Application 2019 & 2032
- Table 70: Russia UK Energy Drink Industry Volume (K Liters) Forecast, by Application 2019 & 2032
- Table 71: Benelux UK Energy Drink Industry Revenue (Million) Forecast, by Application 2019 & 2032
- Table 72: Benelux UK Energy Drink Industry Volume (K Liters) Forecast, by Application 2019 & 2032
- Table 73: Nordics UK Energy Drink Industry Revenue (Million) Forecast, by Application 2019 & 2032
- Table 74: Nordics UK Energy Drink Industry Volume (K Liters) Forecast, by Application 2019 & 2032
- Table 75: Rest of Europe UK Energy Drink Industry Revenue (Million) Forecast, by Application 2019 & 2032
- Table 76: Rest of Europe UK Energy Drink Industry Volume (K Liters) Forecast, by Application 2019 & 2032
- Table 77: Global UK Energy Drink Industry Revenue Million Forecast, by Packaging Type 2019 & 2032
- Table 78: Global UK Energy Drink Industry Volume K Liters Forecast, by Packaging Type 2019 & 2032
- Table 79: Global UK Energy Drink Industry Revenue Million Forecast, by Product Type 2019 & 2032
- Table 80: Global UK Energy Drink Industry Volume K Liters Forecast, by Product Type 2019 & 2032
- Table 81: Global UK Energy Drink Industry Revenue Million Forecast, by Distribution Channel 2019 & 2032
- Table 82: Global UK Energy Drink Industry Volume K Liters Forecast, by Distribution Channel 2019 & 2032
- Table 83: Global UK Energy Drink Industry Revenue Million Forecast, by Country 2019 & 2032
- Table 84: Global UK Energy Drink Industry Volume K Liters Forecast, by Country 2019 & 2032
- Table 85: Turkey UK Energy Drink Industry Revenue (Million) Forecast, by Application 2019 & 2032
- Table 86: Turkey UK Energy Drink Industry Volume (K Liters) Forecast, by Application 2019 & 2032
- Table 87: Israel UK Energy Drink Industry Revenue (Million) Forecast, by Application 2019 & 2032
- Table 88: Israel UK Energy Drink Industry Volume (K Liters) Forecast, by Application 2019 & 2032
- Table 89: GCC UK Energy Drink Industry Revenue (Million) Forecast, by Application 2019 & 2032
- Table 90: GCC UK Energy Drink Industry Volume (K Liters) Forecast, by Application 2019 & 2032
- Table 91: North Africa UK Energy Drink Industry Revenue (Million) Forecast, by Application 2019 & 2032
- Table 92: North Africa UK Energy Drink Industry Volume (K Liters) Forecast, by Application 2019 & 2032
- Table 93: South Africa UK Energy Drink Industry Revenue (Million) Forecast, by Application 2019 & 2032
- Table 94: South Africa UK Energy Drink Industry Volume (K Liters) Forecast, by Application 2019 & 2032
- Table 95: Rest of Middle East & Africa UK Energy Drink Industry Revenue (Million) Forecast, by Application 2019 & 2032
- Table 96: Rest of Middle East & Africa UK Energy Drink Industry Volume (K Liters) Forecast, by Application 2019 & 2032
- Table 97: Global UK Energy Drink Industry Revenue Million Forecast, by Packaging Type 2019 & 2032
- Table 98: Global UK Energy Drink Industry Volume K Liters Forecast, by Packaging Type 2019 & 2032
- Table 99: Global UK Energy Drink Industry Revenue Million Forecast, by Product Type 2019 & 2032
- Table 100: Global UK Energy Drink Industry Volume K Liters Forecast, by Product Type 2019 & 2032
- Table 101: Global UK Energy Drink Industry Revenue Million Forecast, by Distribution Channel 2019 & 2032
- Table 102: Global UK Energy Drink Industry Volume K Liters Forecast, by Distribution Channel 2019 & 2032
- Table 103: Global UK Energy Drink Industry Revenue Million Forecast, by Country 2019 & 2032
- Table 104: Global UK Energy Drink Industry Volume K Liters Forecast, by Country 2019 & 2032
- Table 105: China UK Energy Drink Industry Revenue (Million) Forecast, by Application 2019 & 2032
- Table 106: China UK Energy Drink Industry Volume (K Liters) Forecast, by Application 2019 & 2032
- Table 107: India UK Energy Drink Industry Revenue (Million) Forecast, by Application 2019 & 2032
- Table 108: India UK Energy Drink Industry Volume (K Liters) Forecast, by Application 2019 & 2032
- Table 109: Japan UK Energy Drink Industry Revenue (Million) Forecast, by Application 2019 & 2032
- Table 110: Japan UK Energy Drink Industry Volume (K Liters) Forecast, by Application 2019 & 2032
- Table 111: South Korea UK Energy Drink Industry Revenue (Million) Forecast, by Application 2019 & 2032
- Table 112: South Korea UK Energy Drink Industry Volume (K Liters) Forecast, by Application 2019 & 2032
- Table 113: ASEAN UK Energy Drink Industry Revenue (Million) Forecast, by Application 2019 & 2032
- Table 114: ASEAN UK Energy Drink Industry Volume (K Liters) Forecast, by Application 2019 & 2032
- Table 115: Oceania UK Energy Drink Industry Revenue (Million) Forecast, by Application 2019 & 2032
- Table 116: Oceania UK Energy Drink Industry Volume (K Liters) Forecast, by Application 2019 & 2032
- Table 117: Rest of Asia Pacific UK Energy Drink Industry Revenue (Million) Forecast, by Application 2019 & 2032
- Table 118: Rest of Asia Pacific UK Energy Drink Industry Volume (K Liters) Forecast, by Application 2019 & 2032
Frequently Asked Questions
1. What is the projected Compound Annual Growth Rate (CAGR) of the UK Energy Drink Industry?
The projected CAGR is approximately 4.50%.
2. Which companies are prominent players in the UK Energy Drink Industry?
Key companies in the market include TSI Consumer Goods GmbH, PepsiCo Inc, Max Muscle Nutrition, Suntory Holdings Limited, Red Bull GmbH, The Coca-Cola Company, Nestle SA*List Not Exhaustive, Global Trade Holdings Co Ltd, Monster Energy Company, GlaxoSmithKline PLC.
3. What are the main segments of the UK Energy Drink Industry?
The market segments include Packaging Type, Product Type, Distribution Channel.
4. Can you provide details about the market size?
The market size is estimated to be USD XX Million as of 2022.
5. What are some drivers contributing to market growth?
Rising Health & Wellness Trends; Strategic Initiatives By Key Players.
6. What are the notable trends driving market growth?
The Drinks Segment Dominates the Energy Drink Market.
7. Are there any restraints impacting market growth?
Cost Considerations Coupled With Availability Of Alternatives.
8. Can you provide examples of recent developments in the market?
In September 2022, Virtue Clean Energy, the brand that creates clean alternatives in the energy drink category, launched its newest product, Virtue Clean Energy in the United Kingdom. Virtue Drinks contain zero sugar & zero calories, made with all-natural ingredients. It has 80mg of 100% organic caffeine derived from green coffee beans, plus B vitamins (B3, B6, B7, B12).
9. What pricing options are available for accessing the report?
Pricing options include single-user, multi-user, and enterprise licenses priced at USD 3800, USD 4500, and USD 5800 respectively.
10. Is the market size provided in terms of value or volume?
The market size is provided in terms of value, measured in Million and volume, measured in K Liters.
11. Are there any specific market keywords associated with the report?
Yes, the market keyword associated with the report is "UK Energy Drink Industry," which aids in identifying and referencing the specific market segment covered.
12. How do I determine which pricing option suits my needs best?
The pricing options vary based on user requirements and access needs. Individual users may opt for single-user licenses, while businesses requiring broader access may choose multi-user or enterprise licenses for cost-effective access to the report.
13. Are there any additional resources or data provided in the UK Energy Drink Industry report?
While the report offers comprehensive insights, it's advisable to review the specific contents or supplementary materials provided to ascertain if additional resources or data are available.
14. How can I stay updated on further developments or reports in the UK Energy Drink Industry?
To stay informed about further developments, trends, and reports in the UK Energy Drink Industry, consider subscribing to industry newsletters, following relevant companies and organizations, or regularly checking reputable industry news sources and publications.
Methodology
Step 1 - Identification of Relevant Samples Size from Population Database


Step 2 - Approaches for Defining Global Market Size (Value, Volume* & Price*)

Note*: In applicable scenarios
Step 3 - Data Sources
Primary Research
- Web Analytics
- Survey Reports
- Research Institute
- Latest Research Reports
- Opinion Leaders
Secondary Research
- Annual Reports
- White Paper
- Latest Press Release
- Industry Association
- Paid Database
- Investor Presentations

Step 4 - Data Triangulation
Involves using different sources of information in order to increase the validity of a study
These sources are likely to be stakeholders in a program - participants, other researchers, program staff, other community members, and so on.
Then we put all data in single framework & apply various statistical tools to find out the dynamic on the market.
During the analysis stage, feedback from the stakeholder groups would be compared to determine areas of agreement as well as areas of divergence


