

Key Insights
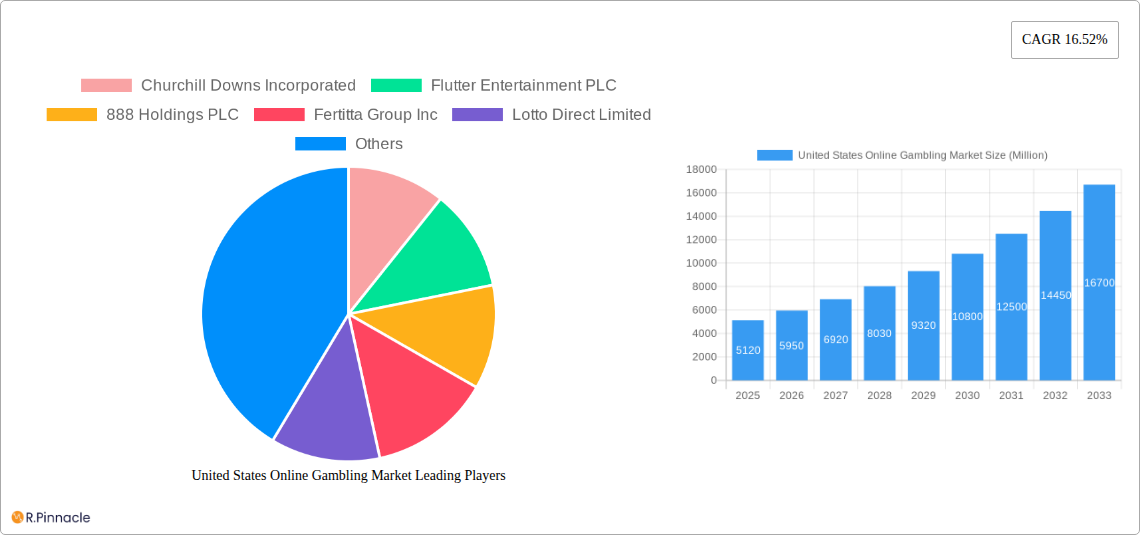
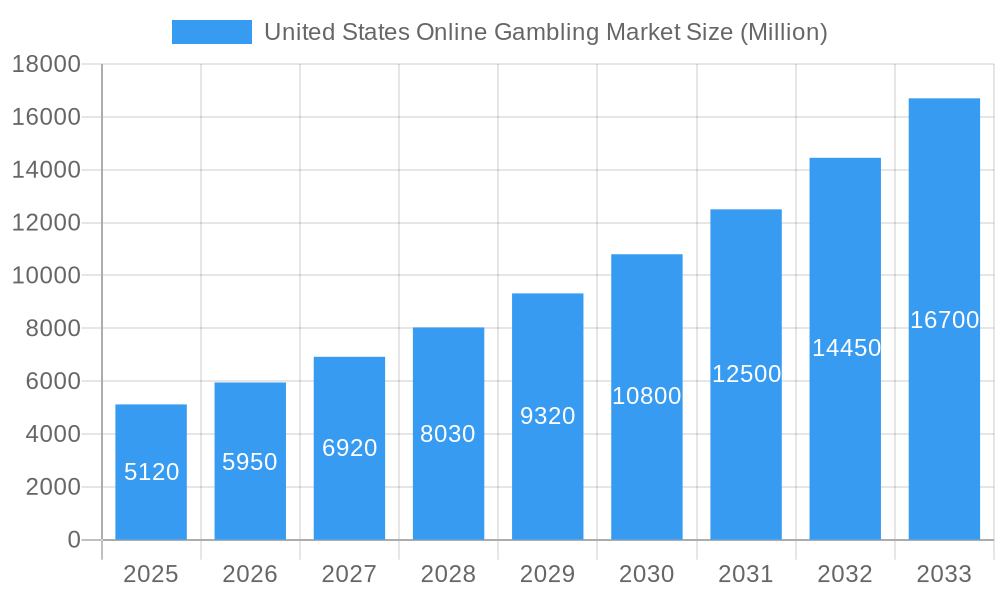
The United States online gambling market is experiencing explosive growth, projected to reach $5.12 billion in 2025 and exhibiting a robust Compound Annual Growth Rate (CAGR) of 16.52% from 2025 to 2033. This expansion is fueled by several key drivers. Firstly, increasing smartphone penetration and readily available high-speed internet access have broadened accessibility for potential gamblers. Secondly, the progressive legalization of online gambling across various states is significantly contributing to market expansion. The rising popularity of fantasy sports and the integration of esports betting are also boosting market growth. Furthermore, innovative game formats, improved user interfaces, and aggressive marketing campaigns by established and emerging players are enhancing user engagement and driving revenue. The market is segmented by end-user device (desktop and mobile) and game type (sports betting, casino games, and other casino games), with mobile gaming showing particularly strong growth due to its convenience and portability. Major players like DraftKings, FanDuel, and Caesars Entertainment are heavily investing in technological advancements and strategic partnerships to consolidate their market share. While regulatory hurdles and concerns regarding responsible gambling remain potential restraints, the overall market outlook is exceptionally positive, indicating substantial opportunities for investment and growth in the coming years.
United States Online Gambling Market Market Size (In Billion)
The significant growth trajectory of the US online gambling market is expected to continue throughout the forecast period (2025-2033). While the North American region currently dominates, strategic expansion into other regions remains a key opportunity for major players. The competitive landscape is highly dynamic, characterized by intense competition amongst established operators and the emergence of innovative start-ups. Successful strategies will hinge upon effective marketing, personalized user experiences, and robust security measures to maintain player trust and compliance with evolving regulations. The focus on responsible gambling initiatives and technological innovations like AI-powered fraud detection will further shape the industry's future. The ongoing debate regarding federal-level regulations will also play a significant role in defining the market's trajectory in the years to come. The overall trend, however, strongly suggests a continuously expanding market with significant potential for both established and new entrants.
United States Online Gambling Market Company Market Share
United States Online Gambling Market: A Comprehensive Report (2019-2033)
This comprehensive report provides an in-depth analysis of the burgeoning United States online gambling market, offering invaluable insights for industry professionals, investors, and strategists. With a study period spanning 2019-2033, a base year of 2025, and a forecast period from 2025-2033, this report delivers actionable intelligence on market size, growth drivers, competitive landscape, and future trends. The market is projected to reach xx Million by 2033, showcasing significant growth potential.
United States Online Gambling Market Market Structure & Innovation Trends
This section analyzes the competitive landscape, encompassing market concentration, innovation drivers, regulatory frameworks, and M&A activities within the US online gambling sector. We examine the market share held by key players such as Churchill Downs Incorporated, Flutter Entertainment PLC, 888 Holdings PLC, Fertitta Group Inc, Lotto Direct Limited, MGM Resorts International (Borgata Hotel Casino & Spa), DraftKings Inc, Caesars Entertainment Inc, Cherry Gold Casino, and El Royale Casino (list not exhaustive). The report delves into the impact of regulatory changes on market structure, analyzing the influence of state-level legalization and licensing on market concentration and competitive dynamics. Furthermore, it assesses the role of technological innovation, including advancements in mobile gaming and virtual reality, in shaping market evolution. M&A activity is analyzed, evaluating deal values and their strategic implications for market consolidation and growth. The analysis includes a detailed examination of end-user demographics, pinpointing key segments driving market expansion and influencing future strategies.
United States Online Gambling Market Market Dynamics & Trends
This section explores the dynamic forces shaping the US online gambling market, focusing on key growth drivers, technological disruptions, evolving consumer preferences, and intensifying competitive dynamics. We analyze the Compound Annual Growth Rate (CAGR) and market penetration rates across various segments. Factors driving market expansion include increased internet and mobile penetration, shifting consumer attitudes towards online gambling, and the progressive legalization of online gambling in various states. Technological advancements such as improved mobile apps, enhanced gaming experiences, and the integration of blockchain technology are discussed in detail. The analysis encompasses the competitive landscape, including the strategies employed by major players to gain market share, such as strategic partnerships, aggressive marketing campaigns, and product innovation. Specific examples of technological disruptions, such as the rise of esports betting and the adoption of artificial intelligence (AI) in fraud detection, are explored.
Dominant Regions & Segments in United States Online Gambling Market
This section identifies the leading regions and segments within the US online gambling market, analyzing their dominance based on factors such as economic policies, infrastructure development, and consumer preferences. The analysis covers key segments including:
- End User: Desktop vs. Mobile – We determine which platform dominates and analyze the factors driving growth in each segment.
- Game Type: Sports Betting, Casino, and Other Casino Games – This section assesses the popularity of each game type and analyzes their respective growth trajectories, considering factors like consumer preferences, technological advancements, and regulatory influences.
The report provides a detailed analysis of the factors contributing to the dominance of specific regions or segments, examining their unique characteristics and competitive dynamics.
United States Online Gambling Market Product Innovations
This section provides a concise overview of recent product developments and innovations in the US online gambling market. The focus is on technological advancements shaping the competitive landscape, and the market fit of these new offerings. The analysis highlights the role of technological trends in driving product development and differentiation, along with assessment of the competitive advantages gained through innovation.
Report Scope & Segmentation Analysis
This section provides a detailed description of the market segmentation used in the report. The analysis covers each segment in detail, including:
- End User: Desktop, Mobile – examining market size, growth projections, and competitive dynamics for each platform.
- Game Type: Sports Betting, Casino, Other Casino Games – providing insights into market size, growth trajectories, and the competitive landscape for each game type.
Growth projections and market size estimates are provided for each segment.
Key Drivers of United States Online Gambling Market Growth
This section outlines the major growth drivers impacting the US online gambling market. These include technological advancements such as improved mobile applications and virtual reality integration, favorable economic conditions stimulating consumer spending, and the ongoing legalization and regulation of online gambling across multiple states, fostering a more regulated and accessible market. Specific examples of each driver are provided.
Challenges in the United States Online Gambling Market Sector
This section addresses the challenges and restraints facing the US online gambling market. These include regulatory hurdles and inconsistent state-level regulations, potential supply chain issues related to technological infrastructure, and the intense competitive pressure from numerous established and emerging players vying for market share. Quantifiable impacts of these challenges are discussed.
Emerging Opportunities in United States Online Gambling Market
This section highlights emerging opportunities in the US online gambling market, including the expansion into new markets as regulations evolve, the adoption of innovative technologies such as blockchain for enhanced security and transparency, and the growing appeal of niche game types and personalized gaming experiences catering to evolving consumer preferences.
Leading Players in the United States Online Gambling Market Market
- Churchill Downs Incorporated
- Flutter Entertainment PLC
- 888 Holdings PLC
- Fertitta Group Inc
- Lotto Direct Limited
- MGM Resorts International (Borgata Hotel Casino & Spa)
- DraftKings Inc
- Cherry Gold Casino
- El Royale Casino
- Caesars Entertainment Inc
Key Developments in United States Online Gambling Market Industry
- September 2022: Caesars Entertainment launched its advanced sports betting and iGaming platform, Caesars Sportsbook & Casino in Pennsylvania.
- July 2022: EveryMatrix partnered with 888casino, expanding its reach in the US market.
- January 2022: BetMGM launched its online sportsbook in New York.
These developments significantly impacted market dynamics through product launches and strategic partnerships.
Future Outlook for United States Online Gambling Market Market
The future of the US online gambling market appears promising, driven by continued legalization efforts, technological advancements, and evolving consumer preferences. Strategic opportunities lie in leveraging technological innovations, expanding into new underserved markets, and fostering strategic partnerships to consolidate market share and capitalize on the growth potential of this dynamic sector. The market is poised for significant expansion in the coming years, presenting considerable opportunities for both established players and new entrants.
United States Online Gambling Market Segmentation
-
1. Game Type
- 1.1. Sports Betting
-
1.2. Casino
- 1.2.1. Live Casino
- 1.2.2. Slots
- 1.2.3. Baccarat
- 1.2.4. Blackjack
- 1.2.5. Poker
- 1.2.6. Other Casino Games
- 1.3. Other Game Types
-
2. End User
- 2.1. Desktop
- 2.2. Mobile
United States Online Gambling Market Segmentation By Geography
- 1. United States
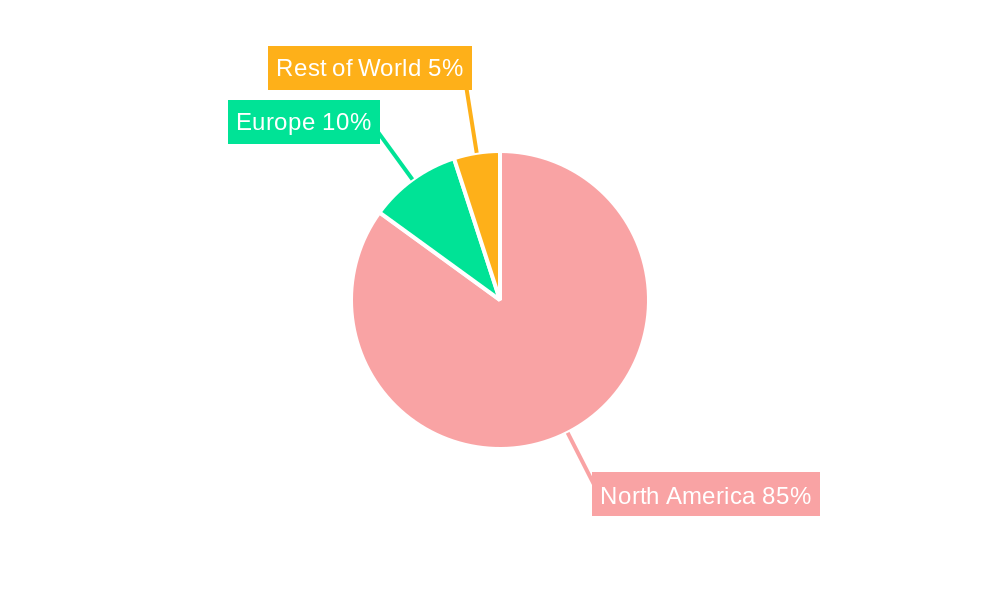
United States Online Gambling Market Regional Market Share
Geographic Coverage of United States Online Gambling Market
United States Online Gambling Market REPORT HIGHLIGHTS
| Aspects | Details |
|---|---|
| Study Period | 2020-2034 |
| Base Year | 2025 |
| Estimated Year | 2026 |
| Forecast Period | 2026-2034 |
| Historical Period | 2020-2025 |
| Growth Rate | CAGR of 16.52% from 2020-2034 |
| Segmentation |
|
Table of Contents
- 1. Introduction
- 1.1. Research Scope
- 1.2. Market Segmentation
- 1.3. Research Objective
- 1.4. Definitions and Assumptions
- 2. Executive Summary
- 2.1. Market Snapshot
- 3. Market Dynamics
- 3.1. Market Drivers
- 3.2. Market Restrains
- 3.3. Market Trends
- 3.4. Market Opportunities
- 4. Market Factor Analysis
- 4.1. Porters Five Forces
- 4.1.1. Bargaining Power of Suppliers
- 4.1.2. Bargaining Power of Buyers
- 4.1.3. Threat of New Entrants
- 4.1.4. Threat of Substitutes
- 4.1.5. Competitive Rivalry
- 4.2. PESTEL analysis
- 4.3. BCG Analysis
- 4.3.1. Stars (High Growth, High Market Share)
- 4.3.2. Cash Cows (Low Growth, High Market Share)
- 4.3.3. Question Mark (High Growth, Low Market Share)
- 4.3.4. Dogs (Low Growth, Low Market Share)
- 4.4. Ansoff Matrix Analysis
- 4.5. Supply Chain Analysis
- 4.6. Regulatory Landscape
- 4.7. Current Market Potential and Opportunity Assessment (TAM–SAM–SOM Framework)
- 4.8. PRI Analyst Note
- 4.1. Porters Five Forces
- 5. Market Analysis, Insights and Forecast 2021-2033
- 5.1. Market Analysis, Insights and Forecast - by Game Type
- 5.1.1. Sports Betting
- 5.1.2. Casino
- 5.1.2.1. Live Casino
- 5.1.2.2. Slots
- 5.1.2.3. Baccarat
- 5.1.2.4. Blackjack
- 5.1.2.5. Poker
- 5.1.2.6. Other Casino Games
- 5.1.3. Other Game Types
- 5.2. Market Analysis, Insights and Forecast - by End User
- 5.2.1. Desktop
- 5.2.2. Mobile
- 5.3. Market Analysis, Insights and Forecast - by Region
- 5.3.1. United States
- 5.1. Market Analysis, Insights and Forecast - by Game Type
- 6. United States Online Gambling Market Analysis, Insights and Forecast, 2021-2033
- 6.1. Market Analysis, Insights and Forecast - by Game Type
- 6.1.1. Sports Betting
- 6.1.2. Casino
- 6.1.2.1. Live Casino
- 6.1.2.2. Slots
- 6.1.2.3. Baccarat
- 6.1.2.4. Blackjack
- 6.1.2.5. Poker
- 6.1.2.6. Other Casino Games
- 6.1.3. Other Game Types
- 6.2. Market Analysis, Insights and Forecast - by End User
- 6.2.1. Desktop
- 6.2.2. Mobile
- 6.1. Market Analysis, Insights and Forecast - by Game Type
- 7. Competitive Analysis
- 7.1. Company Profiles
- 7.1.1 Churchill Downs Incorporated
- 7.1.1.1. Company Overview
- 7.1.1.2. Products
- 7.1.1.3. Company Financials
- 7.1.1.4. SWOT Analysis
- 7.1.2 Flutter Entertainment PLC
- 7.1.2.1. Company Overview
- 7.1.2.2. Products
- 7.1.2.3. Company Financials
- 7.1.2.4. SWOT Analysis
- 7.1.3 888 Holdings PLC
- 7.1.3.1. Company Overview
- 7.1.3.2. Products
- 7.1.3.3. Company Financials
- 7.1.3.4. SWOT Analysis
- 7.1.4 Fertitta Group Inc
- 7.1.4.1. Company Overview
- 7.1.4.2. Products
- 7.1.4.3. Company Financials
- 7.1.4.4. SWOT Analysis
- 7.1.5 Lotto Direct Limited
- 7.1.5.1. Company Overview
- 7.1.5.2. Products
- 7.1.5.3. Company Financials
- 7.1.5.4. SWOT Analysis
- 7.1.6 MGM Resorts International (Borgata Hotel Casino & Spa)
- 7.1.6.1. Company Overview
- 7.1.6.2. Products
- 7.1.6.3. Company Financials
- 7.1.6.4. SWOT Analysis
- 7.1.7 DraftKings Inc
- 7.1.7.1. Company Overview
- 7.1.7.2. Products
- 7.1.7.3. Company Financials
- 7.1.7.4. SWOT Analysis
- 7.1.8 Cherry Gold Casino
- 7.1.8.1. Company Overview
- 7.1.8.2. Products
- 7.1.8.3. Company Financials
- 7.1.8.4. SWOT Analysis
- 7.1.9 El Royale Casino*List Not Exhaustive
- 7.1.9.1. Company Overview
- 7.1.9.2. Products
- 7.1.9.3. Company Financials
- 7.1.9.4. SWOT Analysis
- 7.1.10 Caesars Entertainment Inc
- 7.1.10.1. Company Overview
- 7.1.10.2. Products
- 7.1.10.3. Company Financials
- 7.1.10.4. SWOT Analysis
- 7.1.1 Churchill Downs Incorporated
- 7.2. Market Entropy
- 7.2.1 Company's Key Areas Served
- 7.2.2 Recent Developments
- 7.3. Company Market Share Analysis 2025
- 7.3.1 Top 5 Companies Market Share Analysis
- 7.3.2 Top 3 Companies Market Share Analysis
- 7.4. List of Potential Customers
- 8. Research Methodology
List of Figures
- Figure 1: United States Online Gambling Market Revenue Breakdown (Million, %) by Product 2025 & 2033
- Figure 2: United States Online Gambling Market Share (%) by Company 2025
List of Tables
- Table 1: United States Online Gambling Market Revenue Million Forecast, by Game Type 2020 & 2033
- Table 2: United States Online Gambling Market Revenue Million Forecast, by End User 2020 & 2033
- Table 3: United States Online Gambling Market Revenue Million Forecast, by Region 2020 & 2033
- Table 4: United States Online Gambling Market Revenue Million Forecast, by Game Type 2020 & 2033
- Table 5: United States Online Gambling Market Revenue Million Forecast, by End User 2020 & 2033
- Table 6: United States Online Gambling Market Revenue Million Forecast, by Country 2020 & 2033
Frequently Asked Questions
1. What is the projected Compound Annual Growth Rate (CAGR) of the United States Online Gambling Market?
The projected CAGR is approximately 16.52%.
2. Which companies are prominent players in the United States Online Gambling Market?
Key companies in the market include Churchill Downs Incorporated, Flutter Entertainment PLC, 888 Holdings PLC, Fertitta Group Inc, Lotto Direct Limited, MGM Resorts International (Borgata Hotel Casino & Spa), DraftKings Inc, Cherry Gold Casino, El Royale Casino*List Not Exhaustive, Caesars Entertainment Inc.
3. What are the main segments of the United States Online Gambling Market?
The market segments include Game Type, End User.
4. Can you provide details about the market size?
The market size is estimated to be USD 5.12 Million as of 2022.
5. What are some drivers contributing to market growth?
Increasing Popularity of Online Gambling; Advancement In Security. Encryption. and Streaming Technology.
6. What are the notable trends driving market growth?
Consumer's Inclination Towards Gambling Culture.
7. Are there any restraints impacting market growth?
Regulatory Uncertainty And Compliance.
8. Can you provide examples of recent developments in the market?
In September 2022, Caesars Entertainment launched its most advanced sports betting and iGaming platform, Caesars Sportsbook & Casino in Pennsylvania. Featuring the introduction, the state will have access to a significantly improved, feature-rich version of the Caesars Sportsbook & Casino app with mobile sports betting and casino games befitting of a Caesar.
9. What pricing options are available for accessing the report?
Pricing options include single-user, multi-user, and enterprise licenses priced at USD 3800, USD 4500, and USD 5800 respectively.
10. Is the market size provided in terms of value or volume?
The market size is provided in terms of value, measured in Million.
11. Are there any specific market keywords associated with the report?
Yes, the market keyword associated with the report is "United States Online Gambling Market," which aids in identifying and referencing the specific market segment covered.
12. How do I determine which pricing option suits my needs best?
The pricing options vary based on user requirements and access needs. Individual users may opt for single-user licenses, while businesses requiring broader access may choose multi-user or enterprise licenses for cost-effective access to the report.
13. Are there any additional resources or data provided in the United States Online Gambling Market report?
While the report offers comprehensive insights, it's advisable to review the specific contents or supplementary materials provided to ascertain if additional resources or data are available.
14. How can I stay updated on further developments or reports in the United States Online Gambling Market?
To stay informed about further developments, trends, and reports in the United States Online Gambling Market, consider subscribing to industry newsletters, following relevant companies and organizations, or regularly checking reputable industry news sources and publications.
Methodology
Step 1 - Identification of Relevant Samples Size from Population Database


Step 2 - Approaches for Defining Global Market Size (Value, Volume* & Price*)

Note*: In applicable scenarios
Step 3 - Data Sources
Primary Research
- Web Analytics
- Survey Reports
- Research Institute
- Latest Research Reports
- Opinion Leaders
Secondary Research
- Annual Reports
- White Paper
- Latest Press Release
- Industry Association
- Paid Database
- Investor Presentations

Step 4 - Data Triangulation
Involves using different sources of information in order to increase the validity of a study
These sources are likely to be stakeholders in a program - participants, other researchers, program staff, other community members, and so on.
Then we put all data in single framework & apply various statistical tools to find out the dynamic on the market.
During the analysis stage, feedback from the stakeholder groups would be compared to determine areas of agreement as well as areas of divergence