
Key Insights
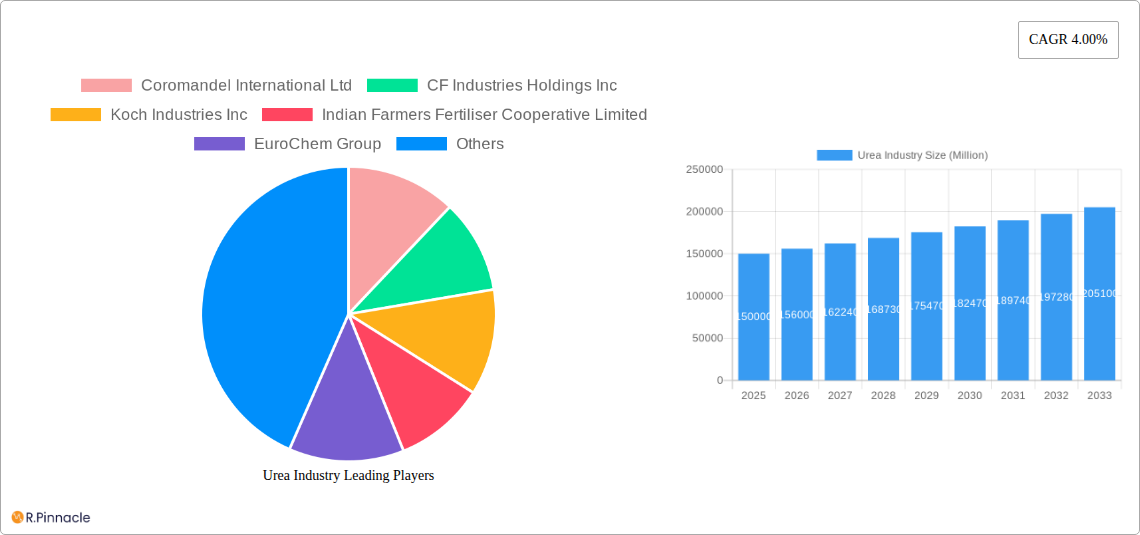
The global urea market, exhibiting a Compound Annual Growth Rate (CAGR) of 4.00%, is projected to experience significant expansion throughout the forecast period (2025-2033). Driven by escalating global food demand and the crucial role urea plays as a primary nitrogen fertilizer in crop production, the market's value is substantial. The increasing adoption of high-yield farming techniques and government initiatives promoting agricultural productivity in developing nations further contribute to this growth. Market segmentation reveals strong performance across various crop types, including field crops (such as corn, wheat, and rice), horticultural crops (fruits, vegetables), and turf & ornamental applications. While conventional urea forms dominate, specialty types like Controlled Release Fertilizers (CRF) and water-soluble formulations are witnessing accelerated growth due to their targeted nutrient delivery and enhanced efficiency, minimizing environmental impact. Major players such as Coromandel International Ltd, CF Industries Holdings Inc, and Yara International AS are actively shaping the market through strategic investments in R&D, capacity expansion, and mergers and acquisitions.
However, the market faces challenges. Fluctuations in natural gas prices, a key raw material in urea production, create price volatility impacting profitability. Environmental concerns related to excessive nitrogen application and stringent regulations aimed at reducing its environmental footprint impose restraints. Furthermore, the availability of alternative nitrogen sources and the increasing adoption of precision farming techniques that optimize fertilizer use pose further competitive pressures. Despite these challenges, the long-term outlook for the urea market remains positive, fueled by sustained demand from a growing global population requiring enhanced food security, coupled with technological advancements in fertilizer production and application that enhance sustainability. The strategic diversification into specialty urea products and expansion into new geographic markets will be pivotal for manufacturers seeking to navigate market complexities and achieve sustainable growth.
Urea Industry Market Report: 2019-2033
This comprehensive report provides an in-depth analysis of the global urea industry, offering actionable insights for industry professionals, investors, and stakeholders. Covering the period 2019-2033, with a focus on 2025, this report meticulously examines market dynamics, competitive landscapes, and future growth opportunities. The report leverages extensive data analysis to provide accurate market sizing and forecasts, illuminating key trends and challenges impacting this vital sector of the agricultural industry.
Urea Industry Market Structure & Innovation Trends
The global urea market is characterized by a moderate level of concentration, with key players such as Coromandel International Ltd, CF Industries Holdings Inc, Koch Industries Inc, Indian Farmers Fertiliser Cooperative Limited, EuroChem Group, SABIC Agri-Nutrients Co, Yara International AS, OCI NV, and Nutrien Ltd holding significant market share. The combined market share of the top five players is estimated at xx%.
Innovation within the urea industry is driven by the need for increased efficiency, sustainability, and higher crop yields. Regulatory frameworks, particularly those focused on environmental protection and sustainable agriculture, significantly influence product development and market access. Key innovation areas include the development of specialty urea formulations (CRF, SRF, Water Soluble, Liquid Fertilizer) and the exploration of sustainable production methods.
Mergers and acquisitions (M&A) activity plays a crucial role in shaping market dynamics. Significant deals include:
- April 2023: SABIC Agri-Nutrients Company's acquisition of a 49% stake in ETG Inputs Holdco Limited for USD 320 Million.
- March 2022: EuroChem Group's purchase of 51.48% of Fertilizantes Heringer SA shares.
These transactions highlight the strategic importance of expanding production capacity and distribution networks to maintain market competitiveness. The average M&A deal value in the urea industry over the past five years is estimated at USD xx Million. Product substitutes, such as alternative nitrogen fertilizers, pose a growing challenge, impacting overall market penetration. End-user demographics are predominantly farmers, with a growing focus on large-scale commercial farming operations.
Urea Industry Market Dynamics & Trends
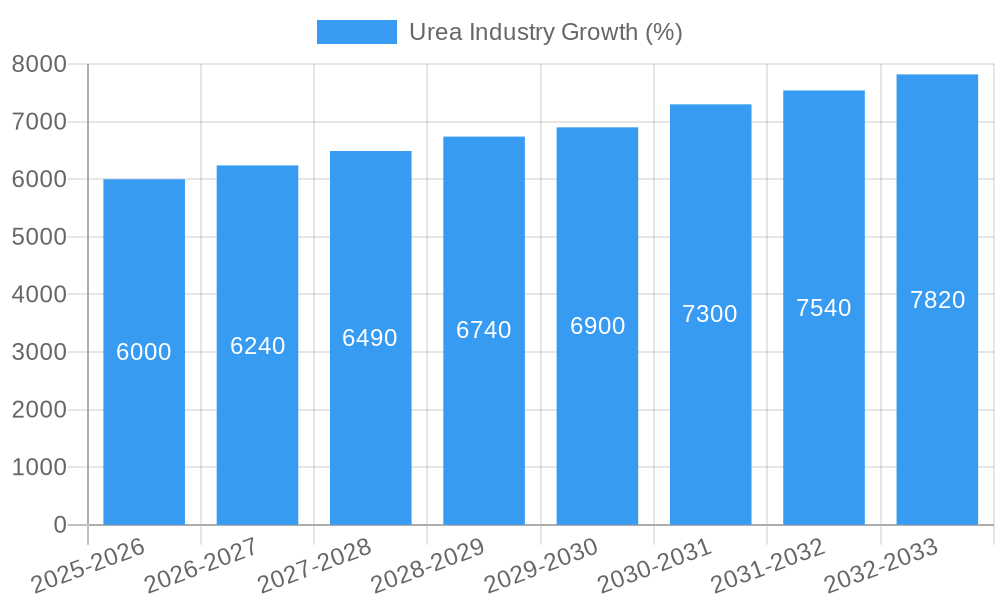
The global urea market is experiencing robust growth, driven by factors such as rising global population, increasing demand for food, and expanding agricultural land under cultivation. The compound annual growth rate (CAGR) is projected to be xx% during the forecast period (2025-2033), with the market size reaching xx Million by 2033. This growth is further fueled by technological advancements in fertilizer production, leading to improved efficiency and reduced environmental impact. Consumer preferences are shifting towards more sustainable and high-efficiency urea formulations, creating opportunities for specialty urea products. Competitive dynamics are intensifying, with companies focusing on product differentiation, cost optimization, and strategic partnerships to gain market share. Market penetration of specialty urea types, particularly CRF and water-soluble fertilizers, is expected to increase significantly, driven by their superior nutrient-use efficiency and environmental benefits.
Dominant Regions & Segments in Urea Industry
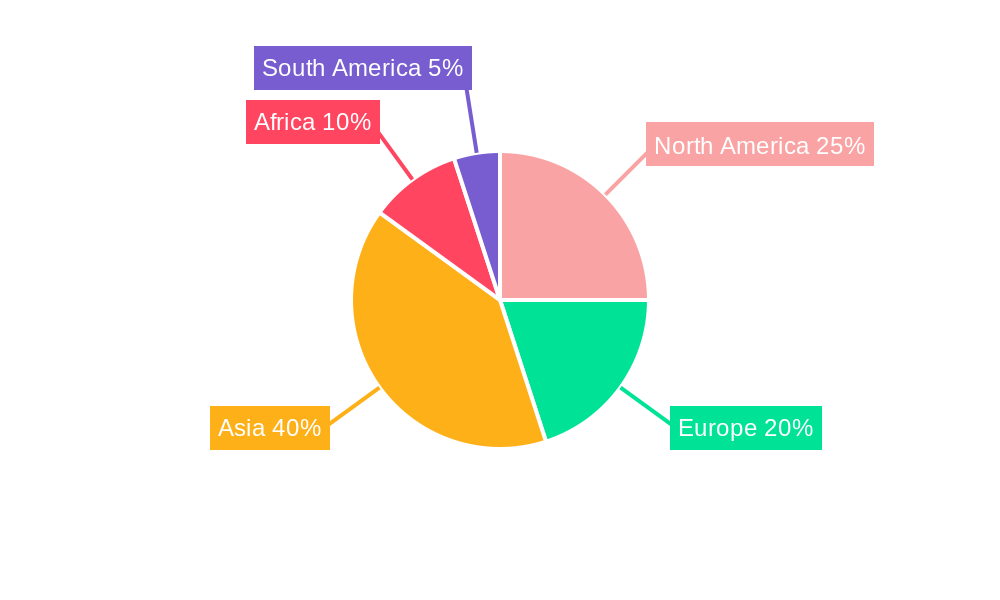
The Asia-Pacific region currently dominates the global urea market, driven by factors such as large agricultural land area, intensive farming practices, and significant population growth. Key drivers include favorable government policies supporting agricultural development and increasing investments in agricultural infrastructure.
- Leading Regions: Asia-Pacific, North America, and South America.
- Dominant Segments:
- Speciality Type: CRF and Water Soluble fertilizers are experiencing the fastest growth due to their efficiency and targeted nutrient delivery.
- Crop Type: Field crops, particularly cereals and grains, represent the largest segment by volume.
- Form: Conventional urea continues to hold the largest market share, although specialty urea formulations are gaining traction.
Detailed analysis reveals that the strong economic growth in several Asian countries, coupled with supportive government policies promoting agricultural intensification, is a major factor in the region's dominance. The establishment of robust distribution networks and effective logistics infrastructure also contribute to market access and growth in these regions.
Urea Industry Product Innovations
Recent product innovations focus on enhancing urea efficiency and sustainability. The development of controlled-release fertilizers (CRF) and water-soluble formulations reduces nutrient loss and improves crop uptake. Technological advancements in production processes are also contributing to improved efficiency, reduced environmental impact, and cost optimization. These innovations are enhancing market competitiveness by offering farmers superior products with enhanced performance and environmental benefits.
Report Scope & Segmentation Analysis
This report segments the urea market across several key parameters:
- Speciality Type: CRF, Liquid Fertilizer, SRF, Water Soluble. Growth projections vary widely, with specialty types exhibiting higher growth rates than conventional urea.
- Crop Type: Field Crops, Horticultural Crops, Turf & Ornamental. Field crops comprise the majority of urea consumption.
- Form: Conventional, Specialty. The specialty segment is expected to witness significant expansion.
Each segment's market size, growth projections, and competitive dynamics are analyzed in detail, providing a comprehensive understanding of market opportunities.
Key Drivers of Urea Industry Growth
Several factors contribute to the growth of the urea industry:
- Rising global population and food demand: Increasing population necessitates higher agricultural output, driving up fertilizer demand.
- Expanding agricultural land under cultivation: Growing demand for food and feed is leading to expansion of arable land.
- Technological advancements: Improved fertilizer formulations and production methods enhance efficiency and sustainability.
- Government support and policies: Many countries provide subsidies and incentives to promote agricultural development.
Challenges in the Urea Industry Sector
The urea industry faces various challenges:
- Fluctuations in raw material prices: Natural gas prices significantly impact production costs.
- Environmental regulations: Stringent environmental norms drive the need for sustainable production.
- Supply chain disruptions: Geopolitical factors and logistics bottlenecks can disrupt the supply chain, impacting availability and pricing.
- Competition from alternative fertilizers: Bio-fertilizers and other alternatives are increasing competition.
Emerging Opportunities in Urea Industry
Emerging opportunities include:
- Sustainable and environmentally friendly urea production methods: Growing focus on reducing the carbon footprint of fertilizer production.
- Development of advanced urea formulations: Enhanced efficiency and targeted nutrient delivery for various crops.
- Expansion into new markets: Untapped potential in emerging economies with growing agricultural sectors.
- Strategic partnerships and collaborations: Combining expertise to develop innovative solutions and expand market reach.
Leading Players in the Urea Industry Market
- Coromandel International Ltd
- CF Industries Holdings Inc
- Koch Industries Inc
- Indian Farmers Fertiliser Cooperative Limited
- EuroChem Group
- SABIC Agri-Nutrients Co
- Yara International AS
- OCI NV
- Nutrien Ltd
Key Developments in Urea Industry
- April 2023: SABIC Agri-Nutrients Company acquired a 49% stake in ETG Inputs Holdco Limited for USD 320 Million, strengthening its value chain integration.
- March 2022: EuroChem Group's acquisition of 51.48% of Fertilizantes Heringer SA enhanced its Brazilian distribution capacity.
- January 2022: Yara and Lantmännen's collaboration aims to bring "green" fertilizers to market, promoting sustainability.
Future Outlook for Urea Industry Market
The urea industry is poised for continued growth, driven by persistent demand from a growing global population and increasing focus on food security. The development of sustainable and efficient urea formulations and production processes will play a crucial role in shaping the future of the market. Strategic partnerships and investments in research and development will further contribute to market expansion and innovation. The focus on sustainability and environmental responsibility will drive significant changes in production methods and product offerings in the coming years.
Urea Industry Segmentation
- 1. Production Analysis
- 2. Consumption Analysis
- 3. Import Market Analysis (Value & Volume)
- 4. Export Market Analysis (Value & Volume)
- 5. Price Trend Analysis
Urea Industry Segmentation By Geography
-
1. North America
- 1.1. United States
- 1.2. Canada
- 1.3. Mexico
-
2. South America
- 2.1. Brazil
- 2.2. Argentina
- 2.3. Rest of South America
-
3. Europe
- 3.1. United Kingdom
- 3.2. Germany
- 3.3. France
- 3.4. Italy
- 3.5. Spain
- 3.6. Russia
- 3.7. Benelux
- 3.8. Nordics
- 3.9. Rest of Europe
-
4. Middle East & Africa
- 4.1. Turkey
- 4.2. Israel
- 4.3. GCC
- 4.4. North Africa
- 4.5. South Africa
- 4.6. Rest of Middle East & Africa
-
5. Asia Pacific
- 5.1. China
- 5.2. India
- 5.3. Japan
- 5.4. South Korea
- 5.5. ASEAN
- 5.6. Oceania
- 5.7. Rest of Asia Pacific
Urea Industry REPORT HIGHLIGHTS
| Aspects | Details |
|---|---|
| Study Period | 2019-2033 |
| Base Year | 2024 |
| Estimated Year | 2025 |
| Forecast Period | 2025-2033 |
| Historical Period | 2019-2024 |
| Growth Rate | CAGR of 4.00% from 2019-2033 |
| Segmentation |
|
Table of Contents
- 1. Introduction
- 1.1. Research Scope
- 1.2. Market Segmentation
- 1.3. Research Methodology
- 1.4. Definitions and Assumptions
- 2. Executive Summary
- 2.1. Introduction
- 3. Market Dynamics
- 3.1. Introduction
- 3.2. Market Drivers
- 3.2.1. Awareness of Landscaping Maintenance; Technological Advancements
- 3.3. Market Restrains
- 3.3.1. Shortage of Skilled Labor; Wastage of High Amount of Water For Irrigating Lawns
- 3.4. Market Trends
- 3.4.1. OTHER KEY INDUSTRY TRENDS COVERED IN THE REPORT
- 4. Market Factor Analysis
- 4.1. Porters Five Forces
- 4.2. Supply/Value Chain
- 4.3. PESTEL analysis
- 4.4. Market Entropy
- 4.5. Patent/Trademark Analysis
- 5. Global Urea Industry Analysis, Insights and Forecast, 2019-2031
- 5.1. Market Analysis, Insights and Forecast - by Production Analysis
- 5.2. Market Analysis, Insights and Forecast - by Consumption Analysis
- 5.3. Market Analysis, Insights and Forecast - by Import Market Analysis (Value & Volume)
- 5.4. Market Analysis, Insights and Forecast - by Export Market Analysis (Value & Volume)
- 5.5. Market Analysis, Insights and Forecast - by Price Trend Analysis
- 5.6. Market Analysis, Insights and Forecast - by Region
- 5.6.1. North America
- 5.6.2. South America
- 5.6.3. Europe
- 5.6.4. Middle East & Africa
- 5.6.5. Asia Pacific
- 5.1. Market Analysis, Insights and Forecast - by Production Analysis
- 6. North America Urea Industry Analysis, Insights and Forecast, 2019-2031
- 6.1. Market Analysis, Insights and Forecast - by Production Analysis
- 6.2. Market Analysis, Insights and Forecast - by Consumption Analysis
- 6.3. Market Analysis, Insights and Forecast - by Import Market Analysis (Value & Volume)
- 6.4. Market Analysis, Insights and Forecast - by Export Market Analysis (Value & Volume)
- 6.5. Market Analysis, Insights and Forecast - by Price Trend Analysis
- 6.1. Market Analysis, Insights and Forecast - by Production Analysis
- 7. South America Urea Industry Analysis, Insights and Forecast, 2019-2031
- 7.1. Market Analysis, Insights and Forecast - by Production Analysis
- 7.2. Market Analysis, Insights and Forecast - by Consumption Analysis
- 7.3. Market Analysis, Insights and Forecast - by Import Market Analysis (Value & Volume)
- 7.4. Market Analysis, Insights and Forecast - by Export Market Analysis (Value & Volume)
- 7.5. Market Analysis, Insights and Forecast - by Price Trend Analysis
- 7.1. Market Analysis, Insights and Forecast - by Production Analysis
- 8. Europe Urea Industry Analysis, Insights and Forecast, 2019-2031
- 8.1. Market Analysis, Insights and Forecast - by Production Analysis
- 8.2. Market Analysis, Insights and Forecast - by Consumption Analysis
- 8.3. Market Analysis, Insights and Forecast - by Import Market Analysis (Value & Volume)
- 8.4. Market Analysis, Insights and Forecast - by Export Market Analysis (Value & Volume)
- 8.5. Market Analysis, Insights and Forecast - by Price Trend Analysis
- 8.1. Market Analysis, Insights and Forecast - by Production Analysis
- 9. Middle East & Africa Urea Industry Analysis, Insights and Forecast, 2019-2031
- 9.1. Market Analysis, Insights and Forecast - by Production Analysis
- 9.2. Market Analysis, Insights and Forecast - by Consumption Analysis
- 9.3. Market Analysis, Insights and Forecast - by Import Market Analysis (Value & Volume)
- 9.4. Market Analysis, Insights and Forecast - by Export Market Analysis (Value & Volume)
- 9.5. Market Analysis, Insights and Forecast - by Price Trend Analysis
- 9.1. Market Analysis, Insights and Forecast - by Production Analysis
- 10. Asia Pacific Urea Industry Analysis, Insights and Forecast, 2019-2031
- 10.1. Market Analysis, Insights and Forecast - by Production Analysis
- 10.2. Market Analysis, Insights and Forecast - by Consumption Analysis
- 10.3. Market Analysis, Insights and Forecast - by Import Market Analysis (Value & Volume)
- 10.4. Market Analysis, Insights and Forecast - by Export Market Analysis (Value & Volume)
- 10.5. Market Analysis, Insights and Forecast - by Price Trend Analysis
- 10.1. Market Analysis, Insights and Forecast - by Production Analysis
- 11. Competitive Analysis
- 11.1. Global Market Share Analysis 2024
- 11.2. Company Profiles
- 11.2.1 Coromandel International Ltd
- 11.2.1.1. Overview
- 11.2.1.2. Products
- 11.2.1.3. SWOT Analysis
- 11.2.1.4. Recent Developments
- 11.2.1.5. Financials (Based on Availability)
- 11.2.2 CF Industries Holdings Inc
- 11.2.2.1. Overview
- 11.2.2.2. Products
- 11.2.2.3. SWOT Analysis
- 11.2.2.4. Recent Developments
- 11.2.2.5. Financials (Based on Availability)
- 11.2.3 Koch Industries Inc
- 11.2.3.1. Overview
- 11.2.3.2. Products
- 11.2.3.3. SWOT Analysis
- 11.2.3.4. Recent Developments
- 11.2.3.5. Financials (Based on Availability)
- 11.2.4 Indian Farmers Fertiliser Cooperative Limited
- 11.2.4.1. Overview
- 11.2.4.2. Products
- 11.2.4.3. SWOT Analysis
- 11.2.4.4. Recent Developments
- 11.2.4.5. Financials (Based on Availability)
- 11.2.5 EuroChem Group
- 11.2.5.1. Overview
- 11.2.5.2. Products
- 11.2.5.3. SWOT Analysis
- 11.2.5.4. Recent Developments
- 11.2.5.5. Financials (Based on Availability)
- 11.2.6 SABIC Agri-Nutrients Co
- 11.2.6.1. Overview
- 11.2.6.2. Products
- 11.2.6.3. SWOT Analysis
- 11.2.6.4. Recent Developments
- 11.2.6.5. Financials (Based on Availability)
- 11.2.7 Yara International AS
- 11.2.7.1. Overview
- 11.2.7.2. Products
- 11.2.7.3. SWOT Analysis
- 11.2.7.4. Recent Developments
- 11.2.7.5. Financials (Based on Availability)
- 11.2.8 OCI NV
- 11.2.8.1. Overview
- 11.2.8.2. Products
- 11.2.8.3. SWOT Analysis
- 11.2.8.4. Recent Developments
- 11.2.8.5. Financials (Based on Availability)
- 11.2.9 Nutrien Ltd
- 11.2.9.1. Overview
- 11.2.9.2. Products
- 11.2.9.3. SWOT Analysis
- 11.2.9.4. Recent Developments
- 11.2.9.5. Financials (Based on Availability)
- 11.2.1 Coromandel International Ltd
List of Figures
- Figure 1: Global Urea Industry Revenue Breakdown (Million, %) by Region 2024 & 2032
- Figure 2: North America Urea Industry Revenue (Million), by Production Analysis 2024 & 2032
- Figure 3: North America Urea Industry Revenue Share (%), by Production Analysis 2024 & 2032
- Figure 4: North America Urea Industry Revenue (Million), by Consumption Analysis 2024 & 2032
- Figure 5: North America Urea Industry Revenue Share (%), by Consumption Analysis 2024 & 2032
- Figure 6: North America Urea Industry Revenue (Million), by Import Market Analysis (Value & Volume) 2024 & 2032
- Figure 7: North America Urea Industry Revenue Share (%), by Import Market Analysis (Value & Volume) 2024 & 2032
- Figure 8: North America Urea Industry Revenue (Million), by Export Market Analysis (Value & Volume) 2024 & 2032
- Figure 9: North America Urea Industry Revenue Share (%), by Export Market Analysis (Value & Volume) 2024 & 2032
- Figure 10: North America Urea Industry Revenue (Million), by Price Trend Analysis 2024 & 2032
- Figure 11: North America Urea Industry Revenue Share (%), by Price Trend Analysis 2024 & 2032
- Figure 12: North America Urea Industry Revenue (Million), by Country 2024 & 2032
- Figure 13: North America Urea Industry Revenue Share (%), by Country 2024 & 2032
- Figure 14: South America Urea Industry Revenue (Million), by Production Analysis 2024 & 2032
- Figure 15: South America Urea Industry Revenue Share (%), by Production Analysis 2024 & 2032
- Figure 16: South America Urea Industry Revenue (Million), by Consumption Analysis 2024 & 2032
- Figure 17: South America Urea Industry Revenue Share (%), by Consumption Analysis 2024 & 2032
- Figure 18: South America Urea Industry Revenue (Million), by Import Market Analysis (Value & Volume) 2024 & 2032
- Figure 19: South America Urea Industry Revenue Share (%), by Import Market Analysis (Value & Volume) 2024 & 2032
- Figure 20: South America Urea Industry Revenue (Million), by Export Market Analysis (Value & Volume) 2024 & 2032
- Figure 21: South America Urea Industry Revenue Share (%), by Export Market Analysis (Value & Volume) 2024 & 2032
- Figure 22: South America Urea Industry Revenue (Million), by Price Trend Analysis 2024 & 2032
- Figure 23: South America Urea Industry Revenue Share (%), by Price Trend Analysis 2024 & 2032
- Figure 24: South America Urea Industry Revenue (Million), by Country 2024 & 2032
- Figure 25: South America Urea Industry Revenue Share (%), by Country 2024 & 2032
- Figure 26: Europe Urea Industry Revenue (Million), by Production Analysis 2024 & 2032
- Figure 27: Europe Urea Industry Revenue Share (%), by Production Analysis 2024 & 2032
- Figure 28: Europe Urea Industry Revenue (Million), by Consumption Analysis 2024 & 2032
- Figure 29: Europe Urea Industry Revenue Share (%), by Consumption Analysis 2024 & 2032
- Figure 30: Europe Urea Industry Revenue (Million), by Import Market Analysis (Value & Volume) 2024 & 2032
- Figure 31: Europe Urea Industry Revenue Share (%), by Import Market Analysis (Value & Volume) 2024 & 2032
- Figure 32: Europe Urea Industry Revenue (Million), by Export Market Analysis (Value & Volume) 2024 & 2032
- Figure 33: Europe Urea Industry Revenue Share (%), by Export Market Analysis (Value & Volume) 2024 & 2032
- Figure 34: Europe Urea Industry Revenue (Million), by Price Trend Analysis 2024 & 2032
- Figure 35: Europe Urea Industry Revenue Share (%), by Price Trend Analysis 2024 & 2032
- Figure 36: Europe Urea Industry Revenue (Million), by Country 2024 & 2032
- Figure 37: Europe Urea Industry Revenue Share (%), by Country 2024 & 2032
- Figure 38: Middle East & Africa Urea Industry Revenue (Million), by Production Analysis 2024 & 2032
- Figure 39: Middle East & Africa Urea Industry Revenue Share (%), by Production Analysis 2024 & 2032
- Figure 40: Middle East & Africa Urea Industry Revenue (Million), by Consumption Analysis 2024 & 2032
- Figure 41: Middle East & Africa Urea Industry Revenue Share (%), by Consumption Analysis 2024 & 2032
- Figure 42: Middle East & Africa Urea Industry Revenue (Million), by Import Market Analysis (Value & Volume) 2024 & 2032
- Figure 43: Middle East & Africa Urea Industry Revenue Share (%), by Import Market Analysis (Value & Volume) 2024 & 2032
- Figure 44: Middle East & Africa Urea Industry Revenue (Million), by Export Market Analysis (Value & Volume) 2024 & 2032
- Figure 45: Middle East & Africa Urea Industry Revenue Share (%), by Export Market Analysis (Value & Volume) 2024 & 2032
- Figure 46: Middle East & Africa Urea Industry Revenue (Million), by Price Trend Analysis 2024 & 2032
- Figure 47: Middle East & Africa Urea Industry Revenue Share (%), by Price Trend Analysis 2024 & 2032
- Figure 48: Middle East & Africa Urea Industry Revenue (Million), by Country 2024 & 2032
- Figure 49: Middle East & Africa Urea Industry Revenue Share (%), by Country 2024 & 2032
- Figure 50: Asia Pacific Urea Industry Revenue (Million), by Production Analysis 2024 & 2032
- Figure 51: Asia Pacific Urea Industry Revenue Share (%), by Production Analysis 2024 & 2032
- Figure 52: Asia Pacific Urea Industry Revenue (Million), by Consumption Analysis 2024 & 2032
- Figure 53: Asia Pacific Urea Industry Revenue Share (%), by Consumption Analysis 2024 & 2032
- Figure 54: Asia Pacific Urea Industry Revenue (Million), by Import Market Analysis (Value & Volume) 2024 & 2032
- Figure 55: Asia Pacific Urea Industry Revenue Share (%), by Import Market Analysis (Value & Volume) 2024 & 2032
- Figure 56: Asia Pacific Urea Industry Revenue (Million), by Export Market Analysis (Value & Volume) 2024 & 2032
- Figure 57: Asia Pacific Urea Industry Revenue Share (%), by Export Market Analysis (Value & Volume) 2024 & 2032
- Figure 58: Asia Pacific Urea Industry Revenue (Million), by Price Trend Analysis 2024 & 2032
- Figure 59: Asia Pacific Urea Industry Revenue Share (%), by Price Trend Analysis 2024 & 2032
- Figure 60: Asia Pacific Urea Industry Revenue (Million), by Country 2024 & 2032
- Figure 61: Asia Pacific Urea Industry Revenue Share (%), by Country 2024 & 2032
List of Tables
- Table 1: Global Urea Industry Revenue Million Forecast, by Region 2019 & 2032
- Table 2: Global Urea Industry Revenue Million Forecast, by Production Analysis 2019 & 2032
- Table 3: Global Urea Industry Revenue Million Forecast, by Consumption Analysis 2019 & 2032
- Table 4: Global Urea Industry Revenue Million Forecast, by Import Market Analysis (Value & Volume) 2019 & 2032
- Table 5: Global Urea Industry Revenue Million Forecast, by Export Market Analysis (Value & Volume) 2019 & 2032
- Table 6: Global Urea Industry Revenue Million Forecast, by Price Trend Analysis 2019 & 2032
- Table 7: Global Urea Industry Revenue Million Forecast, by Region 2019 & 2032
- Table 8: Global Urea Industry Revenue Million Forecast, by Production Analysis 2019 & 2032
- Table 9: Global Urea Industry Revenue Million Forecast, by Consumption Analysis 2019 & 2032
- Table 10: Global Urea Industry Revenue Million Forecast, by Import Market Analysis (Value & Volume) 2019 & 2032
- Table 11: Global Urea Industry Revenue Million Forecast, by Export Market Analysis (Value & Volume) 2019 & 2032
- Table 12: Global Urea Industry Revenue Million Forecast, by Price Trend Analysis 2019 & 2032
- Table 13: Global Urea Industry Revenue Million Forecast, by Country 2019 & 2032
- Table 14: United States Urea Industry Revenue (Million) Forecast, by Application 2019 & 2032
- Table 15: Canada Urea Industry Revenue (Million) Forecast, by Application 2019 & 2032
- Table 16: Mexico Urea Industry Revenue (Million) Forecast, by Application 2019 & 2032
- Table 17: Global Urea Industry Revenue Million Forecast, by Production Analysis 2019 & 2032
- Table 18: Global Urea Industry Revenue Million Forecast, by Consumption Analysis 2019 & 2032
- Table 19: Global Urea Industry Revenue Million Forecast, by Import Market Analysis (Value & Volume) 2019 & 2032
- Table 20: Global Urea Industry Revenue Million Forecast, by Export Market Analysis (Value & Volume) 2019 & 2032
- Table 21: Global Urea Industry Revenue Million Forecast, by Price Trend Analysis 2019 & 2032
- Table 22: Global Urea Industry Revenue Million Forecast, by Country 2019 & 2032
- Table 23: Brazil Urea Industry Revenue (Million) Forecast, by Application 2019 & 2032
- Table 24: Argentina Urea Industry Revenue (Million) Forecast, by Application 2019 & 2032
- Table 25: Rest of South America Urea Industry Revenue (Million) Forecast, by Application 2019 & 2032
- Table 26: Global Urea Industry Revenue Million Forecast, by Production Analysis 2019 & 2032
- Table 27: Global Urea Industry Revenue Million Forecast, by Consumption Analysis 2019 & 2032
- Table 28: Global Urea Industry Revenue Million Forecast, by Import Market Analysis (Value & Volume) 2019 & 2032
- Table 29: Global Urea Industry Revenue Million Forecast, by Export Market Analysis (Value & Volume) 2019 & 2032
- Table 30: Global Urea Industry Revenue Million Forecast, by Price Trend Analysis 2019 & 2032
- Table 31: Global Urea Industry Revenue Million Forecast, by Country 2019 & 2032
- Table 32: United Kingdom Urea Industry Revenue (Million) Forecast, by Application 2019 & 2032
- Table 33: Germany Urea Industry Revenue (Million) Forecast, by Application 2019 & 2032
- Table 34: France Urea Industry Revenue (Million) Forecast, by Application 2019 & 2032
- Table 35: Italy Urea Industry Revenue (Million) Forecast, by Application 2019 & 2032
- Table 36: Spain Urea Industry Revenue (Million) Forecast, by Application 2019 & 2032
- Table 37: Russia Urea Industry Revenue (Million) Forecast, by Application 2019 & 2032
- Table 38: Benelux Urea Industry Revenue (Million) Forecast, by Application 2019 & 2032
- Table 39: Nordics Urea Industry Revenue (Million) Forecast, by Application 2019 & 2032
- Table 40: Rest of Europe Urea Industry Revenue (Million) Forecast, by Application 2019 & 2032
- Table 41: Global Urea Industry Revenue Million Forecast, by Production Analysis 2019 & 2032
- Table 42: Global Urea Industry Revenue Million Forecast, by Consumption Analysis 2019 & 2032
- Table 43: Global Urea Industry Revenue Million Forecast, by Import Market Analysis (Value & Volume) 2019 & 2032
- Table 44: Global Urea Industry Revenue Million Forecast, by Export Market Analysis (Value & Volume) 2019 & 2032
- Table 45: Global Urea Industry Revenue Million Forecast, by Price Trend Analysis 2019 & 2032
- Table 46: Global Urea Industry Revenue Million Forecast, by Country 2019 & 2032
- Table 47: Turkey Urea Industry Revenue (Million) Forecast, by Application 2019 & 2032
- Table 48: Israel Urea Industry Revenue (Million) Forecast, by Application 2019 & 2032
- Table 49: GCC Urea Industry Revenue (Million) Forecast, by Application 2019 & 2032
- Table 50: North Africa Urea Industry Revenue (Million) Forecast, by Application 2019 & 2032
- Table 51: South Africa Urea Industry Revenue (Million) Forecast, by Application 2019 & 2032
- Table 52: Rest of Middle East & Africa Urea Industry Revenue (Million) Forecast, by Application 2019 & 2032
- Table 53: Global Urea Industry Revenue Million Forecast, by Production Analysis 2019 & 2032
- Table 54: Global Urea Industry Revenue Million Forecast, by Consumption Analysis 2019 & 2032
- Table 55: Global Urea Industry Revenue Million Forecast, by Import Market Analysis (Value & Volume) 2019 & 2032
- Table 56: Global Urea Industry Revenue Million Forecast, by Export Market Analysis (Value & Volume) 2019 & 2032
- Table 57: Global Urea Industry Revenue Million Forecast, by Price Trend Analysis 2019 & 2032
- Table 58: Global Urea Industry Revenue Million Forecast, by Country 2019 & 2032
- Table 59: China Urea Industry Revenue (Million) Forecast, by Application 2019 & 2032
- Table 60: India Urea Industry Revenue (Million) Forecast, by Application 2019 & 2032
- Table 61: Japan Urea Industry Revenue (Million) Forecast, by Application 2019 & 2032
- Table 62: South Korea Urea Industry Revenue (Million) Forecast, by Application 2019 & 2032
- Table 63: ASEAN Urea Industry Revenue (Million) Forecast, by Application 2019 & 2032
- Table 64: Oceania Urea Industry Revenue (Million) Forecast, by Application 2019 & 2032
- Table 65: Rest of Asia Pacific Urea Industry Revenue (Million) Forecast, by Application 2019 & 2032
Frequently Asked Questions
1. What is the projected Compound Annual Growth Rate (CAGR) of the Urea Industry?
The projected CAGR is approximately 4.00%.
2. Which companies are prominent players in the Urea Industry?
Key companies in the market include Coromandel International Ltd, CF Industries Holdings Inc, Koch Industries Inc, Indian Farmers Fertiliser Cooperative Limited, EuroChem Group, SABIC Agri-Nutrients Co, Yara International AS, OCI NV, Nutrien Ltd.
3. What are the main segments of the Urea Industry?
The market segments include Production Analysis, Consumption Analysis, Import Market Analysis (Value & Volume), Export Market Analysis (Value & Volume), Price Trend Analysis.
4. Can you provide details about the market size?
The market size is estimated to be USD XX Million as of 2022.
5. What are some drivers contributing to market growth?
Awareness of Landscaping Maintenance; Technological Advancements.
6. What are the notable trends driving market growth?
OTHER KEY INDUSTRY TRENDS COVERED IN THE REPORT.
7. Are there any restraints impacting market growth?
Shortage of Skilled Labor; Wastage of High Amount of Water For Irrigating Lawns.
8. Can you provide examples of recent developments in the market?
April 2023: SABIC Agri-Nutrients Company acquired the ETC Group (ETG) with a 49% stake in the ETG Inputs Holdco Limited for a transaction value of USD 320 million. The agreement is part of SABIC Agri-Nutrients Company's strategy to integrate the value chain and distribution of agri-nutrients markets.March 2022: EuroChem Group has purchased 51.48% of the shares of the Brazilian distributor Fertilizantes Heringer SA, this purchase will further strengthen its production and distribution capacity in Brazil.January 2022: Yara and Lantmännen signed a commercial agreement to bring “green” fertilizers to the market. Produced with renewable energy, these green nitrogen fertilizers are vital to decarbonizing the food chain and offering consumers more sustainable food choices.
9. What pricing options are available for accessing the report?
Pricing options include single-user, multi-user, and enterprise licenses priced at USD 3800, USD 4500, and USD 5800 respectively.
10. Is the market size provided in terms of value or volume?
The market size is provided in terms of value, measured in Million.
11. Are there any specific market keywords associated with the report?
Yes, the market keyword associated with the report is "Urea Industry," which aids in identifying and referencing the specific market segment covered.
12. How do I determine which pricing option suits my needs best?
The pricing options vary based on user requirements and access needs. Individual users may opt for single-user licenses, while businesses requiring broader access may choose multi-user or enterprise licenses for cost-effective access to the report.
13. Are there any additional resources or data provided in the Urea Industry report?
While the report offers comprehensive insights, it's advisable to review the specific contents or supplementary materials provided to ascertain if additional resources or data are available.
14. How can I stay updated on further developments or reports in the Urea Industry?
To stay informed about further developments, trends, and reports in the Urea Industry, consider subscribing to industry newsletters, following relevant companies and organizations, or regularly checking reputable industry news sources and publications.
Methodology
Step 1 - Identification of Relevant Samples Size from Population Database


Step 2 - Approaches for Defining Global Market Size (Value, Volume* & Price*)

Note*: In applicable scenarios
Step 3 - Data Sources
Primary Research
- Web Analytics
- Survey Reports
- Research Institute
- Latest Research Reports
- Opinion Leaders
Secondary Research
- Annual Reports
- White Paper
- Latest Press Release
- Industry Association
- Paid Database
- Investor Presentations

Step 4 - Data Triangulation
Involves using different sources of information in order to increase the validity of a study
These sources are likely to be stakeholders in a program - participants, other researchers, program staff, other community members, and so on.
Then we put all data in single framework & apply various statistical tools to find out the dynamic on the market.
During the analysis stage, feedback from the stakeholder groups would be compared to determine areas of agreement as well as areas of divergence


