
Key Insights
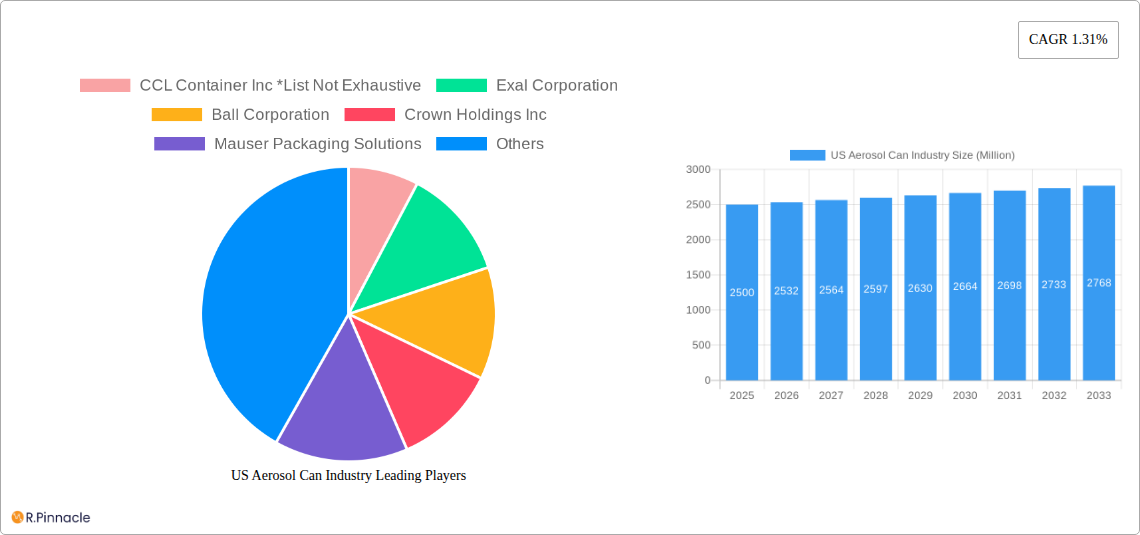
The US aerosol can market, valued at approximately $XX million in 2025, is projected to experience steady growth, with a compound annual growth rate (CAGR) of 1.31% from 2025 to 2033. This growth is driven by increasing demand across various end-user sectors, particularly in cosmetic and personal care, household products, and pharmaceuticals. The preference for convenient and efficient dispensing mechanisms offered by aerosol cans continues to fuel market expansion. Aluminum remains the dominant material type due to its lightweight properties, recyclability, and compatibility with a wide range of products. However, the market also witnesses growth in steel-tinplate cans, driven by cost considerations in certain applications. Growth is expected to be relatively consistent across different US regions, though potential variations might exist depending on factors like population density and industrial activity. Regulatory changes related to environmentally friendly materials and manufacturing practices represent a significant factor influencing the industry, pushing manufacturers towards sustainable solutions and potentially impacting material choices. Competition among key players, including CCL Container Inc, Exal Corporation, Ball Corporation, Crown Holdings Inc, and Mauser Packaging Solutions, further shapes market dynamics.
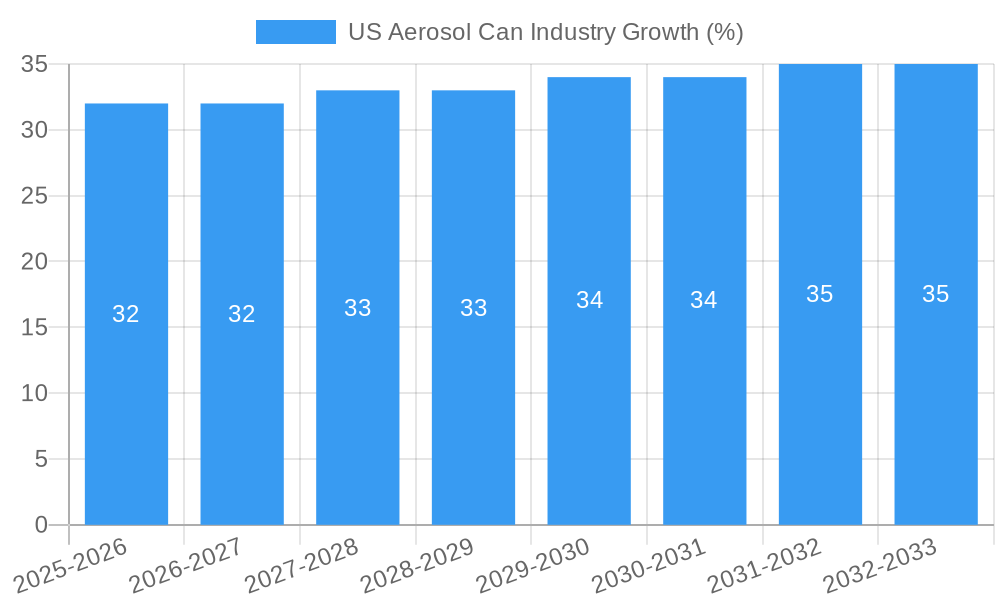
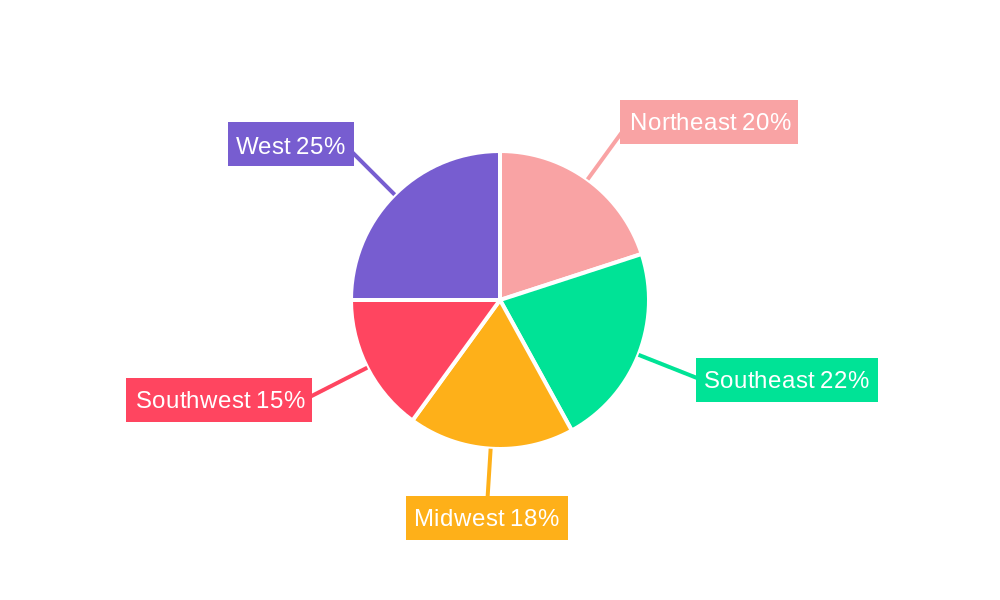
The forecast period (2025-2033) anticipates a gradual increase in market value, influenced by factors such as evolving consumer preferences, innovation in can design and functionality, and the ongoing expansion of the end-use industries mentioned above. While constraints such as material cost fluctuations and environmental concerns related to propellant gases exist, the overall market outlook remains positive, driven by the inherent advantages of aerosol packaging in various sectors. Continued innovation in sustainable and eco-friendly aerosol can technologies is expected to mitigate some of these concerns and support long-term market growth. Specific regional variations within the US (Northeast, Southeast, Midwest, Southwest, and West) are likely to be minimal, with overall national trends prevailing.
US Aerosol Can Industry Market Report: 2019-2033 Forecast
This comprehensive report provides an in-depth analysis of the US aerosol can industry, offering actionable insights for industry professionals, investors, and strategic planners. Leveraging extensive market research and data analysis spanning the period 2019-2033 (Base Year: 2025, Forecast Period: 2025-2033), this report unveils crucial market trends, dynamics, and future growth opportunities. The report covers a market valued at xx Million in 2025, projected to reach xx Million by 2033, exhibiting a CAGR of xx%.
US Aerosol Can Industry Market Structure & Innovation Trends
This section analyzes the competitive landscape of the US aerosol can industry, encompassing market concentration, innovation drivers, regulatory frameworks, and market dynamics. We delve into the impact of product substitutes, end-user demographics, and M&A activities, providing a comprehensive overview of the industry's structure and future trajectory. Key players such as CCL Container Inc, Exal Corporation, Ball Corporation, Crown Holdings Inc, and Mauser Packaging Solutions are evaluated for their market share and strategic initiatives. The analysis includes quantifiable data on M&A deal values (xx Million in total deal value for the period 2019-2024) and market share distribution among leading players. The report also highlights the influence of regulatory changes (e.g., environmental regulations) on innovation and market structure.
US Aerosol Can Industry Market Dynamics & Trends
This section meticulously examines the factors driving market growth, technological advancements influencing the industry, evolving consumer preferences, and the competitive dynamics among key players. We analyze the impact of macroeconomic factors, such as economic growth and disposable income, on market demand. Detailed analysis of technological disruptions (e.g., advancements in can coatings and manufacturing processes) and their implications on production costs and product quality is included. This section also explores changing consumer preferences (e.g., demand for sustainable packaging solutions) and their impact on market segmentation. Specific metrics, including CAGR and market penetration rates for key product types and end-user segments, are presented to provide a granular understanding of market dynamics.
Dominant Regions & Segments in US Aerosol Can Industry
This section identifies the leading regions and segments within the US aerosol can market. We analyze market dominance based on product type (Aluminum, Steel-Tinplate, Other Materials) and end-user (Cosmetic and Personal Care, Household, Pharmaceutical/Veterinary, Paints and Varnishes, Automotive/Industrial, Other End Users).
- Key Drivers for Dominant Segments:
- Aluminum: Lightweight, recyclability, cost-effectiveness.
- Cosmetic and Personal Care: Growing demand for aerosols in beauty products.
- Household: Increased usage of aerosol-based cleaning products.
The detailed analysis includes a comprehensive assessment of regional disparities in market growth, driven by factors such as economic policies, infrastructure development, and consumer behavior.
US Aerosol Can Industry Product Innovations
This section summarizes recent product developments, focusing on technological advancements that enhance performance, sustainability, and cost-effectiveness. The analysis highlights the competitive advantages derived from these innovations, showcasing their market fit and potential to disrupt the industry. Examples include the increasing adoption of lightweight materials and innovative coatings to improve product shelf-life and reduce environmental impact.
Report Scope & Segmentation Analysis
This report provides a detailed segmentation of the US aerosol can market based on product type and end-user.
- Product Type: Aluminum, Steel-Tinplate, Other Materials (each section includes growth projections, market size, and competitive dynamics).
- End-User: Cosmetic and Personal Care, Household, Pharmaceutical/Veterinary, Paints and Varnishes, Automotive/Industrial, Other End Users (each section includes growth projections, market size, and competitive dynamics).
Each segment is analyzed based on its growth trajectory, market size (in Millions), and the competitive intensity within that specific segment.
Key Drivers of US Aerosol Can Industry Growth
The growth of the US aerosol can industry is propelled by several key factors. These include:
- Technological advancements: Improvements in manufacturing processes and material science leading to lighter, more sustainable cans.
- Economic growth: Increased consumer spending drives demand across various end-user segments.
- Favorable regulatory environment: Government policies supporting the use of aerosols in specific applications.
Challenges in the US Aerosol Can Industry Sector
The US aerosol can industry faces certain challenges, including:
- Stringent environmental regulations: Compliance costs and limitations on the use of certain materials.
- Supply chain disruptions: Fluctuations in raw material prices and logistical challenges.
- Intense competition: Pressure from existing players and the emergence of new entrants. This results in a xx% reduction in profit margins in the past year.
Emerging Opportunities in US Aerosol Can Industry
The US aerosol can industry presents significant opportunities:
- Growth in niche markets: Expanding into new applications like pharmaceuticals and sustainable packaging solutions.
- Technological innovations: Development of eco-friendly materials and improved dispensing mechanisms.
- Changing consumer preferences: Adapting to the growing demand for sustainable and convenient products.
Leading Players in the US Aerosol Can Industry Market
- CCL Container Inc
- Exal Corporation
- Ball Corporation
- Crown Holdings Inc
- Mauser Packaging Solutions
Key Developments in US Aerosol Can Industry
- 2022-Q4: Ball Corporation announces a new sustainable aluminum can line.
- 2023-Q1: Crown Holdings Inc acquires a smaller competitor, expanding its market share.
- 2023-Q2: New regulations regarding aerosol propellant emissions come into effect. (Further developments will be added in future updates.)
Future Outlook for US Aerosol Can Industry Market
The US aerosol can industry is poised for continued growth, driven by increasing demand across various sectors. Technological innovations, along with evolving consumer preferences toward sustainable packaging, will shape the industry's future. Strategic partnerships, mergers, and acquisitions will play a crucial role in shaping the competitive landscape, resulting in an estimated xx Million market value increase by 2033.
US Aerosol Can Industry Segmentation
-
1. Product type
- 1.1. Aluminum
- 1.2. Steel-Tinplate
- 1.3. Other Materials
-
2. End-User
- 2.1. Cosmetic and Personal Care
- 2.2. Household
- 2.3. Pharmaceutical/Veterinary
- 2.4. Paints and Varnishes
- 2.5. Automotive/Industrial
- 2.6. Other End Users
US Aerosol Can Industry Segmentation By Geography
-
1. North America
- 1.1. United States
- 1.2. Canada
- 1.3. Mexico
-
2. South America
- 2.1. Brazil
- 2.2. Argentina
- 2.3. Rest of South America
-
3. Europe
- 3.1. United Kingdom
- 3.2. Germany
- 3.3. France
- 3.4. Italy
- 3.5. Spain
- 3.6. Russia
- 3.7. Benelux
- 3.8. Nordics
- 3.9. Rest of Europe
-
4. Middle East & Africa
- 4.1. Turkey
- 4.2. Israel
- 4.3. GCC
- 4.4. North Africa
- 4.5. South Africa
- 4.6. Rest of Middle East & Africa
-
5. Asia Pacific
- 5.1. China
- 5.2. India
- 5.3. Japan
- 5.4. South Korea
- 5.5. ASEAN
- 5.6. Oceania
- 5.7. Rest of Asia Pacific
US Aerosol Can Industry REPORT HIGHLIGHTS
| Aspects | Details |
|---|---|
| Study Period | 2019-2033 |
| Base Year | 2024 |
| Estimated Year | 2025 |
| Forecast Period | 2025-2033 |
| Historical Period | 2019-2024 |
| Growth Rate | CAGR of 1.31% from 2019-2033 |
| Segmentation |
|
Table of Contents
- 1. Introduction
- 1.1. Research Scope
- 1.2. Market Segmentation
- 1.3. Research Methodology
- 1.4. Definitions and Assumptions
- 2. Executive Summary
- 2.1. Introduction
- 3. Market Dynamics
- 3.1. Introduction
- 3.2. Market Drivers
- 3.2.1. ; Growing Demand from the Cosmetic Industry
- 3.3. Market Restrains
- 3.3.1. ; Increasing Competition from Substitute Packaging
- 3.4. Market Trends
- 3.4.1. Aluminum Cans to Register Highest Growth
- 4. Market Factor Analysis
- 4.1. Porters Five Forces
- 4.2. Supply/Value Chain
- 4.3. PESTEL analysis
- 4.4. Market Entropy
- 4.5. Patent/Trademark Analysis
- 5. Global US Aerosol Can Industry Analysis, Insights and Forecast, 2019-2031
- 5.1. Market Analysis, Insights and Forecast - by Product type
- 5.1.1. Aluminum
- 5.1.2. Steel-Tinplate
- 5.1.3. Other Materials
- 5.2. Market Analysis, Insights and Forecast - by End-User
- 5.2.1. Cosmetic and Personal Care
- 5.2.2. Household
- 5.2.3. Pharmaceutical/Veterinary
- 5.2.4. Paints and Varnishes
- 5.2.5. Automotive/Industrial
- 5.2.6. Other End Users
- 5.3. Market Analysis, Insights and Forecast - by Region
- 5.3.1. North America
- 5.3.2. South America
- 5.3.3. Europe
- 5.3.4. Middle East & Africa
- 5.3.5. Asia Pacific
- 5.1. Market Analysis, Insights and Forecast - by Product type
- 6. North America US Aerosol Can Industry Analysis, Insights and Forecast, 2019-2031
- 6.1. Market Analysis, Insights and Forecast - by Product type
- 6.1.1. Aluminum
- 6.1.2. Steel-Tinplate
- 6.1.3. Other Materials
- 6.2. Market Analysis, Insights and Forecast - by End-User
- 6.2.1. Cosmetic and Personal Care
- 6.2.2. Household
- 6.2.3. Pharmaceutical/Veterinary
- 6.2.4. Paints and Varnishes
- 6.2.5. Automotive/Industrial
- 6.2.6. Other End Users
- 6.1. Market Analysis, Insights and Forecast - by Product type
- 7. South America US Aerosol Can Industry Analysis, Insights and Forecast, 2019-2031
- 7.1. Market Analysis, Insights and Forecast - by Product type
- 7.1.1. Aluminum
- 7.1.2. Steel-Tinplate
- 7.1.3. Other Materials
- 7.2. Market Analysis, Insights and Forecast - by End-User
- 7.2.1. Cosmetic and Personal Care
- 7.2.2. Household
- 7.2.3. Pharmaceutical/Veterinary
- 7.2.4. Paints and Varnishes
- 7.2.5. Automotive/Industrial
- 7.2.6. Other End Users
- 7.1. Market Analysis, Insights and Forecast - by Product type
- 8. Europe US Aerosol Can Industry Analysis, Insights and Forecast, 2019-2031
- 8.1. Market Analysis, Insights and Forecast - by Product type
- 8.1.1. Aluminum
- 8.1.2. Steel-Tinplate
- 8.1.3. Other Materials
- 8.2. Market Analysis, Insights and Forecast - by End-User
- 8.2.1. Cosmetic and Personal Care
- 8.2.2. Household
- 8.2.3. Pharmaceutical/Veterinary
- 8.2.4. Paints and Varnishes
- 8.2.5. Automotive/Industrial
- 8.2.6. Other End Users
- 8.1. Market Analysis, Insights and Forecast - by Product type
- 9. Middle East & Africa US Aerosol Can Industry Analysis, Insights and Forecast, 2019-2031
- 9.1. Market Analysis, Insights and Forecast - by Product type
- 9.1.1. Aluminum
- 9.1.2. Steel-Tinplate
- 9.1.3. Other Materials
- 9.2. Market Analysis, Insights and Forecast - by End-User
- 9.2.1. Cosmetic and Personal Care
- 9.2.2. Household
- 9.2.3. Pharmaceutical/Veterinary
- 9.2.4. Paints and Varnishes
- 9.2.5. Automotive/Industrial
- 9.2.6. Other End Users
- 9.1. Market Analysis, Insights and Forecast - by Product type
- 10. Asia Pacific US Aerosol Can Industry Analysis, Insights and Forecast, 2019-2031
- 10.1. Market Analysis, Insights and Forecast - by Product type
- 10.1.1. Aluminum
- 10.1.2. Steel-Tinplate
- 10.1.3. Other Materials
- 10.2. Market Analysis, Insights and Forecast - by End-User
- 10.2.1. Cosmetic and Personal Care
- 10.2.2. Household
- 10.2.3. Pharmaceutical/Veterinary
- 10.2.4. Paints and Varnishes
- 10.2.5. Automotive/Industrial
- 10.2.6. Other End Users
- 10.1. Market Analysis, Insights and Forecast - by Product type
- 11. Northeast US Aerosol Can Industry Analysis, Insights and Forecast, 2019-2031
- 12. Southeast US Aerosol Can Industry Analysis, Insights and Forecast, 2019-2031
- 13. Midwest US Aerosol Can Industry Analysis, Insights and Forecast, 2019-2031
- 14. Southwest US Aerosol Can Industry Analysis, Insights and Forecast, 2019-2031
- 15. West US Aerosol Can Industry Analysis, Insights and Forecast, 2019-2031
- 16. Competitive Analysis
- 16.1. Global Market Share Analysis 2024
- 16.2. Company Profiles
- 16.2.1 CCL Container Inc *List Not Exhaustive
- 16.2.1.1. Overview
- 16.2.1.2. Products
- 16.2.1.3. SWOT Analysis
- 16.2.1.4. Recent Developments
- 16.2.1.5. Financials (Based on Availability)
- 16.2.2 Exal Corporation
- 16.2.2.1. Overview
- 16.2.2.2. Products
- 16.2.2.3. SWOT Analysis
- 16.2.2.4. Recent Developments
- 16.2.2.5. Financials (Based on Availability)
- 16.2.3 Ball Corporation
- 16.2.3.1. Overview
- 16.2.3.2. Products
- 16.2.3.3. SWOT Analysis
- 16.2.3.4. Recent Developments
- 16.2.3.5. Financials (Based on Availability)
- 16.2.4 Crown Holdings Inc
- 16.2.4.1. Overview
- 16.2.4.2. Products
- 16.2.4.3. SWOT Analysis
- 16.2.4.4. Recent Developments
- 16.2.4.5. Financials (Based on Availability)
- 16.2.5 Mauser Packaging Solutions
- 16.2.5.1. Overview
- 16.2.5.2. Products
- 16.2.5.3. SWOT Analysis
- 16.2.5.4. Recent Developments
- 16.2.5.5. Financials (Based on Availability)
- 16.2.1 CCL Container Inc *List Not Exhaustive
List of Figures
- Figure 1: Global US Aerosol Can Industry Revenue Breakdown (Million, %) by Region 2024 & 2032
- Figure 2: United states US Aerosol Can Industry Revenue (Million), by Country 2024 & 2032
- Figure 3: United states US Aerosol Can Industry Revenue Share (%), by Country 2024 & 2032
- Figure 4: North America US Aerosol Can Industry Revenue (Million), by Product type 2024 & 2032
- Figure 5: North America US Aerosol Can Industry Revenue Share (%), by Product type 2024 & 2032
- Figure 6: North America US Aerosol Can Industry Revenue (Million), by End-User 2024 & 2032
- Figure 7: North America US Aerosol Can Industry Revenue Share (%), by End-User 2024 & 2032
- Figure 8: North America US Aerosol Can Industry Revenue (Million), by Country 2024 & 2032
- Figure 9: North America US Aerosol Can Industry Revenue Share (%), by Country 2024 & 2032
- Figure 10: South America US Aerosol Can Industry Revenue (Million), by Product type 2024 & 2032
- Figure 11: South America US Aerosol Can Industry Revenue Share (%), by Product type 2024 & 2032
- Figure 12: South America US Aerosol Can Industry Revenue (Million), by End-User 2024 & 2032
- Figure 13: South America US Aerosol Can Industry Revenue Share (%), by End-User 2024 & 2032
- Figure 14: South America US Aerosol Can Industry Revenue (Million), by Country 2024 & 2032
- Figure 15: South America US Aerosol Can Industry Revenue Share (%), by Country 2024 & 2032
- Figure 16: Europe US Aerosol Can Industry Revenue (Million), by Product type 2024 & 2032
- Figure 17: Europe US Aerosol Can Industry Revenue Share (%), by Product type 2024 & 2032
- Figure 18: Europe US Aerosol Can Industry Revenue (Million), by End-User 2024 & 2032
- Figure 19: Europe US Aerosol Can Industry Revenue Share (%), by End-User 2024 & 2032
- Figure 20: Europe US Aerosol Can Industry Revenue (Million), by Country 2024 & 2032
- Figure 21: Europe US Aerosol Can Industry Revenue Share (%), by Country 2024 & 2032
- Figure 22: Middle East & Africa US Aerosol Can Industry Revenue (Million), by Product type 2024 & 2032
- Figure 23: Middle East & Africa US Aerosol Can Industry Revenue Share (%), by Product type 2024 & 2032
- Figure 24: Middle East & Africa US Aerosol Can Industry Revenue (Million), by End-User 2024 & 2032
- Figure 25: Middle East & Africa US Aerosol Can Industry Revenue Share (%), by End-User 2024 & 2032
- Figure 26: Middle East & Africa US Aerosol Can Industry Revenue (Million), by Country 2024 & 2032
- Figure 27: Middle East & Africa US Aerosol Can Industry Revenue Share (%), by Country 2024 & 2032
- Figure 28: Asia Pacific US Aerosol Can Industry Revenue (Million), by Product type 2024 & 2032
- Figure 29: Asia Pacific US Aerosol Can Industry Revenue Share (%), by Product type 2024 & 2032
- Figure 30: Asia Pacific US Aerosol Can Industry Revenue (Million), by End-User 2024 & 2032
- Figure 31: Asia Pacific US Aerosol Can Industry Revenue Share (%), by End-User 2024 & 2032
- Figure 32: Asia Pacific US Aerosol Can Industry Revenue (Million), by Country 2024 & 2032
- Figure 33: Asia Pacific US Aerosol Can Industry Revenue Share (%), by Country 2024 & 2032
List of Tables
- Table 1: Global US Aerosol Can Industry Revenue Million Forecast, by Region 2019 & 2032
- Table 2: Global US Aerosol Can Industry Revenue Million Forecast, by Product type 2019 & 2032
- Table 3: Global US Aerosol Can Industry Revenue Million Forecast, by End-User 2019 & 2032
- Table 4: Global US Aerosol Can Industry Revenue Million Forecast, by Region 2019 & 2032
- Table 5: Global US Aerosol Can Industry Revenue Million Forecast, by Country 2019 & 2032
- Table 6: Northeast US Aerosol Can Industry Revenue (Million) Forecast, by Application 2019 & 2032
- Table 7: Southeast US Aerosol Can Industry Revenue (Million) Forecast, by Application 2019 & 2032
- Table 8: Midwest US Aerosol Can Industry Revenue (Million) Forecast, by Application 2019 & 2032
- Table 9: Southwest US Aerosol Can Industry Revenue (Million) Forecast, by Application 2019 & 2032
- Table 10: West US Aerosol Can Industry Revenue (Million) Forecast, by Application 2019 & 2032
- Table 11: Global US Aerosol Can Industry Revenue Million Forecast, by Product type 2019 & 2032
- Table 12: Global US Aerosol Can Industry Revenue Million Forecast, by End-User 2019 & 2032
- Table 13: Global US Aerosol Can Industry Revenue Million Forecast, by Country 2019 & 2032
- Table 14: United States US Aerosol Can Industry Revenue (Million) Forecast, by Application 2019 & 2032
- Table 15: Canada US Aerosol Can Industry Revenue (Million) Forecast, by Application 2019 & 2032
- Table 16: Mexico US Aerosol Can Industry Revenue (Million) Forecast, by Application 2019 & 2032
- Table 17: Global US Aerosol Can Industry Revenue Million Forecast, by Product type 2019 & 2032
- Table 18: Global US Aerosol Can Industry Revenue Million Forecast, by End-User 2019 & 2032
- Table 19: Global US Aerosol Can Industry Revenue Million Forecast, by Country 2019 & 2032
- Table 20: Brazil US Aerosol Can Industry Revenue (Million) Forecast, by Application 2019 & 2032
- Table 21: Argentina US Aerosol Can Industry Revenue (Million) Forecast, by Application 2019 & 2032
- Table 22: Rest of South America US Aerosol Can Industry Revenue (Million) Forecast, by Application 2019 & 2032
- Table 23: Global US Aerosol Can Industry Revenue Million Forecast, by Product type 2019 & 2032
- Table 24: Global US Aerosol Can Industry Revenue Million Forecast, by End-User 2019 & 2032
- Table 25: Global US Aerosol Can Industry Revenue Million Forecast, by Country 2019 & 2032
- Table 26: United Kingdom US Aerosol Can Industry Revenue (Million) Forecast, by Application 2019 & 2032
- Table 27: Germany US Aerosol Can Industry Revenue (Million) Forecast, by Application 2019 & 2032
- Table 28: France US Aerosol Can Industry Revenue (Million) Forecast, by Application 2019 & 2032
- Table 29: Italy US Aerosol Can Industry Revenue (Million) Forecast, by Application 2019 & 2032
- Table 30: Spain US Aerosol Can Industry Revenue (Million) Forecast, by Application 2019 & 2032
- Table 31: Russia US Aerosol Can Industry Revenue (Million) Forecast, by Application 2019 & 2032
- Table 32: Benelux US Aerosol Can Industry Revenue (Million) Forecast, by Application 2019 & 2032
- Table 33: Nordics US Aerosol Can Industry Revenue (Million) Forecast, by Application 2019 & 2032
- Table 34: Rest of Europe US Aerosol Can Industry Revenue (Million) Forecast, by Application 2019 & 2032
- Table 35: Global US Aerosol Can Industry Revenue Million Forecast, by Product type 2019 & 2032
- Table 36: Global US Aerosol Can Industry Revenue Million Forecast, by End-User 2019 & 2032
- Table 37: Global US Aerosol Can Industry Revenue Million Forecast, by Country 2019 & 2032
- Table 38: Turkey US Aerosol Can Industry Revenue (Million) Forecast, by Application 2019 & 2032
- Table 39: Israel US Aerosol Can Industry Revenue (Million) Forecast, by Application 2019 & 2032
- Table 40: GCC US Aerosol Can Industry Revenue (Million) Forecast, by Application 2019 & 2032
- Table 41: North Africa US Aerosol Can Industry Revenue (Million) Forecast, by Application 2019 & 2032
- Table 42: South Africa US Aerosol Can Industry Revenue (Million) Forecast, by Application 2019 & 2032
- Table 43: Rest of Middle East & Africa US Aerosol Can Industry Revenue (Million) Forecast, by Application 2019 & 2032
- Table 44: Global US Aerosol Can Industry Revenue Million Forecast, by Product type 2019 & 2032
- Table 45: Global US Aerosol Can Industry Revenue Million Forecast, by End-User 2019 & 2032
- Table 46: Global US Aerosol Can Industry Revenue Million Forecast, by Country 2019 & 2032
- Table 47: China US Aerosol Can Industry Revenue (Million) Forecast, by Application 2019 & 2032
- Table 48: India US Aerosol Can Industry Revenue (Million) Forecast, by Application 2019 & 2032
- Table 49: Japan US Aerosol Can Industry Revenue (Million) Forecast, by Application 2019 & 2032
- Table 50: South Korea US Aerosol Can Industry Revenue (Million) Forecast, by Application 2019 & 2032
- Table 51: ASEAN US Aerosol Can Industry Revenue (Million) Forecast, by Application 2019 & 2032
- Table 52: Oceania US Aerosol Can Industry Revenue (Million) Forecast, by Application 2019 & 2032
- Table 53: Rest of Asia Pacific US Aerosol Can Industry Revenue (Million) Forecast, by Application 2019 & 2032
Frequently Asked Questions
1. What is the projected Compound Annual Growth Rate (CAGR) of the US Aerosol Can Industry?
The projected CAGR is approximately 1.31%.
2. Which companies are prominent players in the US Aerosol Can Industry?
Key companies in the market include CCL Container Inc *List Not Exhaustive, Exal Corporation, Ball Corporation, Crown Holdings Inc, Mauser Packaging Solutions.
3. What are the main segments of the US Aerosol Can Industry?
The market segments include Product type, End-User.
4. Can you provide details about the market size?
The market size is estimated to be USD XX Million as of 2022.
5. What are some drivers contributing to market growth?
; Growing Demand from the Cosmetic Industry.
6. What are the notable trends driving market growth?
Aluminum Cans to Register Highest Growth.
7. Are there any restraints impacting market growth?
; Increasing Competition from Substitute Packaging.
8. Can you provide examples of recent developments in the market?
N/A
9. What pricing options are available for accessing the report?
Pricing options include single-user, multi-user, and enterprise licenses priced at USD 3800, USD 4500, and USD 5800 respectively.
10. Is the market size provided in terms of value or volume?
The market size is provided in terms of value, measured in Million.
11. Are there any specific market keywords associated with the report?
Yes, the market keyword associated with the report is "US Aerosol Can Industry," which aids in identifying and referencing the specific market segment covered.
12. How do I determine which pricing option suits my needs best?
The pricing options vary based on user requirements and access needs. Individual users may opt for single-user licenses, while businesses requiring broader access may choose multi-user or enterprise licenses for cost-effective access to the report.
13. Are there any additional resources or data provided in the US Aerosol Can Industry report?
While the report offers comprehensive insights, it's advisable to review the specific contents or supplementary materials provided to ascertain if additional resources or data are available.
14. How can I stay updated on further developments or reports in the US Aerosol Can Industry?
To stay informed about further developments, trends, and reports in the US Aerosol Can Industry, consider subscribing to industry newsletters, following relevant companies and organizations, or regularly checking reputable industry news sources and publications.
Methodology
Step 1 - Identification of Relevant Samples Size from Population Database


Step 2 - Approaches for Defining Global Market Size (Value, Volume* & Price*)

Note*: In applicable scenarios
Step 3 - Data Sources
Primary Research
- Web Analytics
- Survey Reports
- Research Institute
- Latest Research Reports
- Opinion Leaders
Secondary Research
- Annual Reports
- White Paper
- Latest Press Release
- Industry Association
- Paid Database
- Investor Presentations

Step 4 - Data Triangulation
Involves using different sources of information in order to increase the validity of a study
These sources are likely to be stakeholders in a program - participants, other researchers, program staff, other community members, and so on.
Then we put all data in single framework & apply various statistical tools to find out the dynamic on the market.
During the analysis stage, feedback from the stakeholder groups would be compared to determine areas of agreement as well as areas of divergence


