

Key Insights
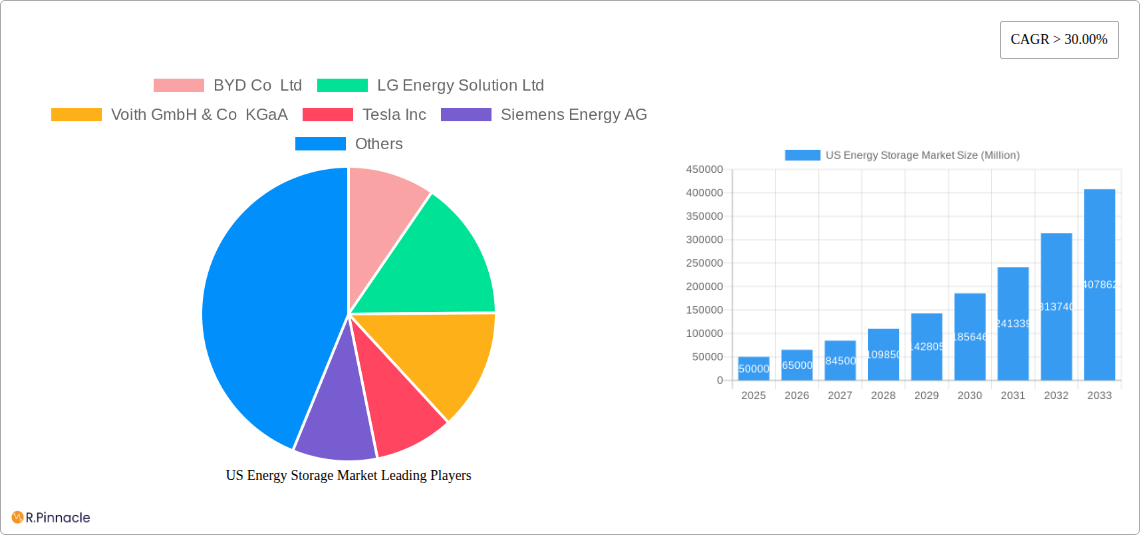
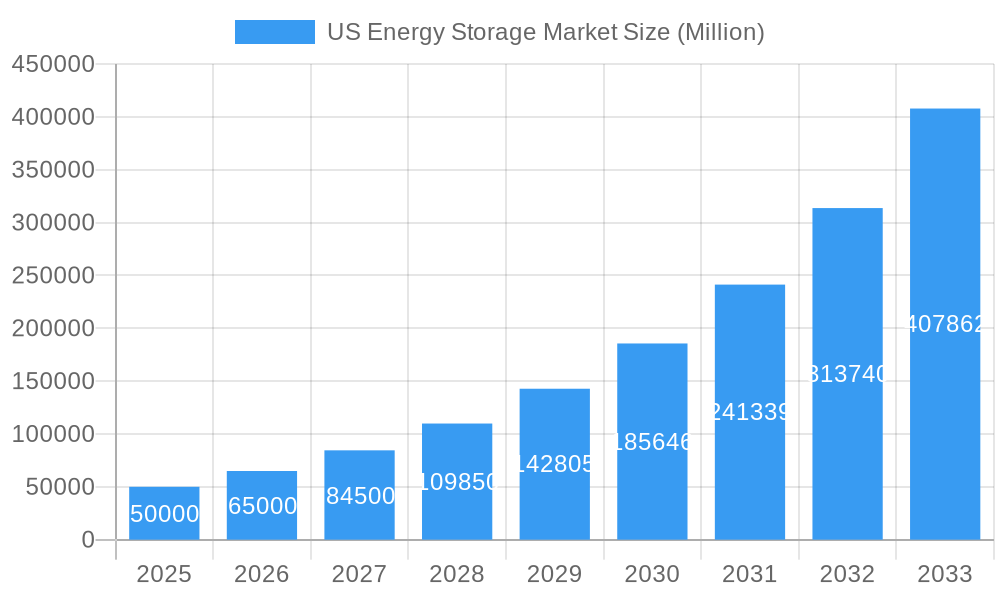
The US energy storage market is poised for significant expansion, projected to achieve a Compound Annual Growth Rate (CAGR) of 29.1% from 2025 to 2033. This robust growth is fueled by increasing renewable energy integration, driven by the need to mitigate intermittency in solar and wind power generation. Government initiatives, including tax credits and subsidies for clean energy infrastructure, are actively stimulating market development. Escalating electricity prices and heightened concerns regarding grid reliability are compelling both commercial and residential consumers to adopt energy storage solutions for cost optimization and enhanced energy security. The market is segmented by technology, with batteries holding a dominant position, complemented by emerging technologies such as pumped hydro and compressed air. Three-phase systems represent a larger share due to their suitability for high-capacity applications, while the commercial and industrial sectors lead in end-user adoption, followed by a rapidly growing residential segment. Key industry leaders, including BYD, LG Energy Solution, Tesla, and Siemens Energy, are actively influencing the market through innovation, strategic alliances, and expansion efforts. Geographically, substantial activity is observed across all US regions, with the Northeast and West regions anticipated to lead due to elevated renewable energy adoption rates and favorable policy frameworks.
US Energy Storage Market Market Size (In Billion)
Sustained market growth will depend on ongoing advancements in battery chemistry, enhancing energy density, lifespan, and cost-effectiveness. Critical infrastructure development, encompassing grid modernization and streamlined permitting, is essential for widespread deployment. Public awareness initiatives emphasizing the advantages of energy storage, coupled with consistent governmental support, will be vital for maintaining market momentum. Increased competition among manufacturers and the emergence of novel business models, such as energy-as-a-service, will foster market diversification and accessibility. Despite challenges related to initial investment costs and grid integration complexities, the US energy storage market presents an exceptionally promising outlook throughout the forecast period, with an estimated market size of 106.7 billion in the base year 2024.
US Energy Storage Market Company Market Share
US Energy Storage Market Report: 2019-2033 Forecast
This comprehensive report provides an in-depth analysis of the US Energy Storage Market, offering invaluable insights for industry professionals, investors, and strategic decision-makers. The study covers the period 2019-2033, with a base year of 2025 and a forecast period of 2025-2033. We analyze market dynamics, key players, technological advancements, and emerging trends to provide a clear picture of this rapidly evolving sector. The market is projected to reach xx Million by 2033, exhibiting a robust CAGR of xx%.
US Energy Storage Market Market Structure & Innovation Trends
This section analyzes the competitive landscape, focusing on market concentration, innovation drivers, regulatory frameworks, and M&A activities. We examine the market share of key players, including BYD Co Ltd, LG Energy Solution Ltd, Voith GmbH & Co KGaA, Tesla Inc, Siemens Energy AG, Sungrow Power Supply Co Ltd, Fluence Energy, Andritz AG, Enphase Energy, and Sonnen GmbH (list not exhaustive). The report delves into the impact of regulatory changes on market growth, identifies key technological disruptions influencing the sector, and analyzes the impact of product substitutes. Furthermore, it assesses end-user demographics and the financial implications of recent M&A activities, including deal values and their effect on market consolidation. Metrics such as market share distribution amongst top players and M&A deal values (in Millions) are included, providing a comprehensive overview of the market structure and its evolutionary trajectory.
US Energy Storage Market Market Dynamics & Trends
This section explores the market's dynamic growth trajectory, analyzing key growth drivers, technological disruptions, evolving consumer preferences, and the intensity of competitive dynamics. The report delves into specific market segments, assessing their individual growth rates and overall market penetration. Key factors impacting market dynamics, such as governmental regulations, technological advancements, fluctuating energy prices, and the increasing integration of renewable energy sources will be thoroughly examined. We analyze the impact of these factors on market growth, revealing both opportunities and challenges. The analysis uses quantitative data to support the findings, including the Compound Annual Growth Rate (CAGR) and market penetration metrics to provide a data-driven perspective on the market's direction.
Dominant Regions & Segments in US Energy Storage Market
This section pinpoints the leading regions, countries, and segments within the US Energy Storage Market. We analyze the dominance of specific technological segments (Batteries, Other Energy Storage System Technologies), phase classifications (Single Phase, Three Phase), and end-user applications (Residential, Commercial & Industrial). The analysis will reveal the factors contributing to the dominance of each segment.
- Key Drivers (Examples):
- Favorable government policies and incentives
- Robust infrastructure development
- Increasing demand from specific end-user sectors
- Technological advancements and cost reductions
- Geographic advantages and resource availability
The report provides a detailed examination of each segment's market size, growth potential, and competitive dynamics.
US Energy Storage Market Product Innovations
This section summarizes recent product developments, outlining their applications and competitive advantages. The analysis emphasizes technological trends and the market fit of these new products, focusing on innovation in battery chemistry, energy management systems, and grid integration technologies. The discussion will highlight the competitive landscape created by these advancements.
Report Scope & Segmentation Analysis
This report segments the US Energy Storage Market across several key dimensions:
Technology: Batteries (e.g., Lithium-ion, Flow batteries), Other Energy Storage System Technologies (e.g., Pumped hydro, Compressed air) Growth projections, market size (in Millions), and competitive dynamics for each technology segment are provided.
Phase: Single Phase, Three Phase – Analysis includes growth projections, market size, and competitive landscape for each phase category.
End-User: Residential, Commercial & Industrial – Growth projections, market size, and competitive landscapes are detailed for each end-user sector.
Key Drivers of US Energy Storage Market Growth
The growth of the US Energy Storage Market is driven by several key factors: The increasing adoption of renewable energy sources, coupled with supportive government policies and incentives, is a significant driver. Furthermore, technological advancements leading to cost reductions and improved efficiency are fueling market expansion. The growing need for grid stability and resilience also contributes to the market's growth trajectory.
Challenges in the US Energy Storage Market Sector
The US Energy Storage Market faces several challenges including regulatory hurdles that impact deployment and standardization, supply chain disruptions affecting the availability of raw materials and components, and intense competition among market participants impacting pricing and market share. These factors have a quantifiable impact on market growth and profitability.
Emerging Opportunities in US Energy Storage Market
Emerging opportunities exist in new market segments, such as microgrids and electric vehicle charging infrastructure. Advancements in battery technology, offering increased energy density and lifespan, are also creating new opportunities. Growing consumer awareness of environmental sustainability and the increasing adoption of smart home technologies are also expanding the market potential.
Leading Players in the US Energy Storage Market Market
Key Developments in US Energy Storage Market Industry
March 2021: Apple's initiative to switch 110 manufacturing partners globally to renewable energy and its California energy storage project significantly impacted the market by showcasing the large-scale adoption potential.
November 2021: The Apparent, California Energy Commission, and Los Angeles Department of Transportation agreement to power electric buses with a solar plus storage microgrid system demonstrates the growing interest in integrated renewable energy solutions. The project's scale highlights the potential for large-scale deployments within the transportation sector.
Future Outlook for US Energy Storage Market Market
The future outlook for the US Energy Storage Market is positive, driven by strong government support, continuous technological advancements, and growing consumer demand for cleaner energy solutions. Strategic opportunities exist for companies to capitalize on the expanding market by focusing on innovation, cost optimization, and efficient grid integration technologies. The market is poised for significant growth, with substantial potential for expansion across various sectors.
US Energy Storage Market Segmentation
-
1. Technology
- 1.1. Batteries
- 1.2. Other Energy Storage System Technologies
-
2. Phase
- 2.1. Single Phase
- 2.2. Three Phase
-
3. End User
- 3.1. Residential
- 3.2. Commercial and Industrial
US Energy Storage Market Segmentation By Geography
-
1. North America
- 1.1. United States
- 1.2. Canada
- 1.3. Mexico
-
2. South America
- 2.1. Brazil
- 2.2. Argentina
- 2.3. Rest of South America
-
3. Europe
- 3.1. United Kingdom
- 3.2. Germany
- 3.3. France
- 3.4. Italy
- 3.5. Spain
- 3.6. Russia
- 3.7. Benelux
- 3.8. Nordics
- 3.9. Rest of Europe
-
4. Middle East & Africa
- 4.1. Turkey
- 4.2. Israel
- 4.3. GCC
- 4.4. North Africa
- 4.5. South Africa
- 4.6. Rest of Middle East & Africa
-
5. Asia Pacific
- 5.1. China
- 5.2. India
- 5.3. Japan
- 5.4. South Korea
- 5.5. ASEAN
- 5.6. Oceania
- 5.7. Rest of Asia Pacific
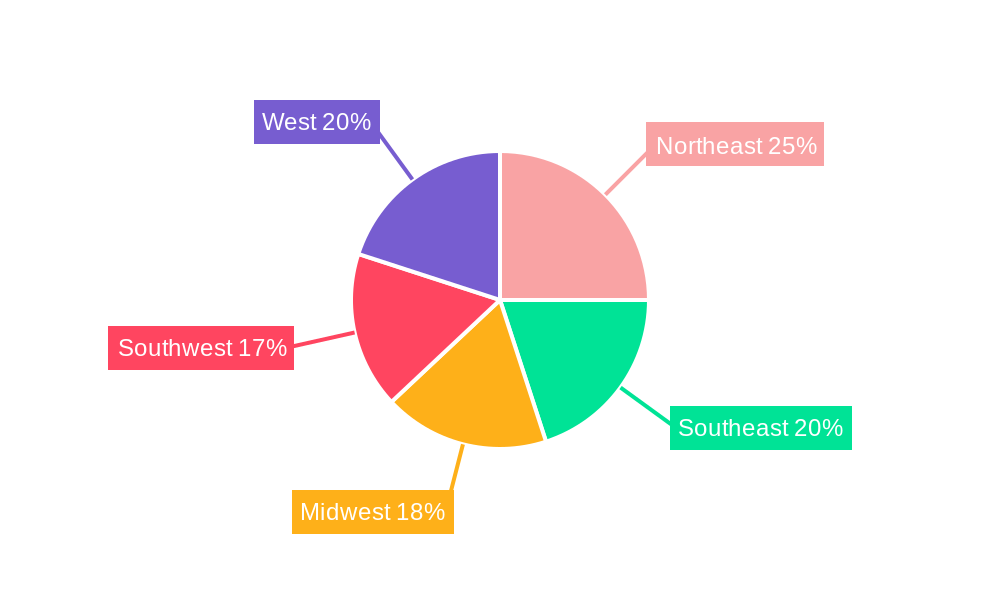
US Energy Storage Market Regional Market Share
Geographic Coverage of US Energy Storage Market
US Energy Storage Market REPORT HIGHLIGHTS
| Aspects | Details |
|---|---|
| Study Period | 2020-2034 |
| Base Year | 2025 |
| Estimated Year | 2026 |
| Forecast Period | 2026-2034 |
| Historical Period | 2020-2025 |
| Growth Rate | CAGR of 29.1% from 2020-2034 |
| Segmentation |
|
Table of Contents
- 1. Introduction
- 1.1. Research Scope
- 1.2. Market Segmentation
- 1.3. Research Objective
- 1.4. Definitions and Assumptions
- 2. Executive Summary
- 2.1. Market Snapshot
- 3. Market Dynamics
- 3.1. Market Drivers
- 3.2. Market Restrains
- 3.3. Market Trends
- 3.4. Market Opportunities
- 4. Market Factor Analysis
- 4.1. Porters Five Forces
- 4.1.1. Bargaining Power of Suppliers
- 4.1.2. Bargaining Power of Buyers
- 4.1.3. Threat of New Entrants
- 4.1.4. Threat of Substitutes
- 4.1.5. Competitive Rivalry
- 4.2. PESTEL analysis
- 4.3. BCG Analysis
- 4.3.1. Stars (High Growth, High Market Share)
- 4.3.2. Cash Cows (Low Growth, High Market Share)
- 4.3.3. Question Mark (High Growth, Low Market Share)
- 4.3.4. Dogs (Low Growth, Low Market Share)
- 4.4. Ansoff Matrix Analysis
- 4.5. Supply Chain Analysis
- 4.6. Regulatory Landscape
- 4.7. Current Market Potential and Opportunity Assessment (TAM–SAM–SOM Framework)
- 4.8. PRI Analyst Note
- 4.1. Porters Five Forces
- 5. Market Analysis, Insights and Forecast 2021-2033
- 5.1. Market Analysis, Insights and Forecast - by Technology
- 5.1.1. Batteries
- 5.1.2. Other Energy Storage System Technologies
- 5.2. Market Analysis, Insights and Forecast - by Phase
- 5.2.1. Single Phase
- 5.2.2. Three Phase
- 5.3. Market Analysis, Insights and Forecast - by End User
- 5.3.1. Residential
- 5.3.2. Commercial and Industrial
- 5.4. Market Analysis, Insights and Forecast - by Region
- 5.4.1. North America
- 5.4.2. South America
- 5.4.3. Europe
- 5.4.4. Middle East & Africa
- 5.4.5. Asia Pacific
- 5.1. Market Analysis, Insights and Forecast - by Technology
- 6. Global US Energy Storage Market Analysis, Insights and Forecast, 2021-2033
- 6.1. Market Analysis, Insights and Forecast - by Technology
- 6.1.1. Batteries
- 6.1.2. Other Energy Storage System Technologies
- 6.2. Market Analysis, Insights and Forecast - by Phase
- 6.2.1. Single Phase
- 6.2.2. Three Phase
- 6.3. Market Analysis, Insights and Forecast - by End User
- 6.3.1. Residential
- 6.3.2. Commercial and Industrial
- 6.1. Market Analysis, Insights and Forecast - by Technology
- 7. North America US Energy Storage Market Analysis, Insights and Forecast, 2020-2032
- 7.1. Market Analysis, Insights and Forecast - by Technology
- 7.1.1. Batteries
- 7.1.2. Other Energy Storage System Technologies
- 7.2. Market Analysis, Insights and Forecast - by Phase
- 7.2.1. Single Phase
- 7.2.2. Three Phase
- 7.3. Market Analysis, Insights and Forecast - by End User
- 7.3.1. Residential
- 7.3.2. Commercial and Industrial
- 7.1. Market Analysis, Insights and Forecast - by Technology
- 8. South America US Energy Storage Market Analysis, Insights and Forecast, 2020-2032
- 8.1. Market Analysis, Insights and Forecast - by Technology
- 8.1.1. Batteries
- 8.1.2. Other Energy Storage System Technologies
- 8.2. Market Analysis, Insights and Forecast - by Phase
- 8.2.1. Single Phase
- 8.2.2. Three Phase
- 8.3. Market Analysis, Insights and Forecast - by End User
- 8.3.1. Residential
- 8.3.2. Commercial and Industrial
- 8.1. Market Analysis, Insights and Forecast - by Technology
- 9. Europe US Energy Storage Market Analysis, Insights and Forecast, 2020-2032
- 9.1. Market Analysis, Insights and Forecast - by Technology
- 9.1.1. Batteries
- 9.1.2. Other Energy Storage System Technologies
- 9.2. Market Analysis, Insights and Forecast - by Phase
- 9.2.1. Single Phase
- 9.2.2. Three Phase
- 9.3. Market Analysis, Insights and Forecast - by End User
- 9.3.1. Residential
- 9.3.2. Commercial and Industrial
- 9.1. Market Analysis, Insights and Forecast - by Technology
- 10. Middle East & Africa US Energy Storage Market Analysis, Insights and Forecast, 2020-2032
- 10.1. Market Analysis, Insights and Forecast - by Technology
- 10.1.1. Batteries
- 10.1.2. Other Energy Storage System Technologies
- 10.2. Market Analysis, Insights and Forecast - by Phase
- 10.2.1. Single Phase
- 10.2.2. Three Phase
- 10.3. Market Analysis, Insights and Forecast - by End User
- 10.3.1. Residential
- 10.3.2. Commercial and Industrial
- 10.1. Market Analysis, Insights and Forecast - by Technology
- 11. Asia Pacific US Energy Storage Market Analysis, Insights and Forecast, 2020-2032
- 11.1. Market Analysis, Insights and Forecast - by Technology
- 11.1.1. Batteries
- 11.1.2. Other Energy Storage System Technologies
- 11.2. Market Analysis, Insights and Forecast - by Phase
- 11.2.1. Single Phase
- 11.2.2. Three Phase
- 11.3. Market Analysis, Insights and Forecast - by End User
- 11.3.1. Residential
- 11.3.2. Commercial and Industrial
- 11.1. Market Analysis, Insights and Forecast - by Technology
- 12. Competitive Analysis
- 12.1. Company Profiles
- 12.1.1 BYD Co Ltd
- 12.1.1.1. Company Overview
- 12.1.1.2. Products
- 12.1.1.3. Company Financials
- 12.1.1.4. SWOT Analysis
- 12.1.2 LG Energy Solution Ltd
- 12.1.2.1. Company Overview
- 12.1.2.2. Products
- 12.1.2.3. Company Financials
- 12.1.2.4. SWOT Analysis
- 12.1.3 Voith GmbH & Co KGaA
- 12.1.3.1. Company Overview
- 12.1.3.2. Products
- 12.1.3.3. Company Financials
- 12.1.3.4. SWOT Analysis
- 12.1.4 Tesla Inc
- 12.1.4.1. Company Overview
- 12.1.4.2. Products
- 12.1.4.3. Company Financials
- 12.1.4.4. SWOT Analysis
- 12.1.5 Siemens Energy AG
- 12.1.5.1. Company Overview
- 12.1.5.2. Products
- 12.1.5.3. Company Financials
- 12.1.5.4. SWOT Analysis
- 12.1.6 Sungrow Power Supply Co Ltd
- 12.1.6.1. Company Overview
- 12.1.6.2. Products
- 12.1.6.3. Company Financials
- 12.1.6.4. SWOT Analysis
- 12.1.7 Fluence Energy*List Not Exhaustive
- 12.1.7.1. Company Overview
- 12.1.7.2. Products
- 12.1.7.3. Company Financials
- 12.1.7.4. SWOT Analysis
- 12.1.8 Andritz AG
- 12.1.8.1. Company Overview
- 12.1.8.2. Products
- 12.1.8.3. Company Financials
- 12.1.8.4. SWOT Analysis
- 12.1.9 Enphase Energy
- 12.1.9.1. Company Overview
- 12.1.9.2. Products
- 12.1.9.3. Company Financials
- 12.1.9.4. SWOT Analysis
- 12.1.10 Sonnen GmbH
- 12.1.10.1. Company Overview
- 12.1.10.2. Products
- 12.1.10.3. Company Financials
- 12.1.10.4. SWOT Analysis
- 12.1.1 BYD Co Ltd
- 12.2. Market Entropy
- 12.2.1 Company's Key Areas Served
- 12.2.2 Recent Developments
- 12.3. Company Market Share Analysis 2025
- 12.3.1 Top 5 Companies Market Share Analysis
- 12.3.2 Top 3 Companies Market Share Analysis
- 12.4. List of Potential Customers
- 13. Research Methodology
List of Figures
- Figure 1: Global US Energy Storage Market Revenue Breakdown (billion, %) by Region 2025 & 2033
- Figure 2: North America US Energy Storage Market Revenue (billion), by Technology 2025 & 2033
- Figure 3: North America US Energy Storage Market Revenue Share (%), by Technology 2025 & 2033
- Figure 4: North America US Energy Storage Market Revenue (billion), by Phase 2025 & 2033
- Figure 5: North America US Energy Storage Market Revenue Share (%), by Phase 2025 & 2033
- Figure 6: North America US Energy Storage Market Revenue (billion), by End User 2025 & 2033
- Figure 7: North America US Energy Storage Market Revenue Share (%), by End User 2025 & 2033
- Figure 8: North America US Energy Storage Market Revenue (billion), by Country 2025 & 2033
- Figure 9: North America US Energy Storage Market Revenue Share (%), by Country 2025 & 2033
- Figure 10: South America US Energy Storage Market Revenue (billion), by Technology 2025 & 2033
- Figure 11: South America US Energy Storage Market Revenue Share (%), by Technology 2025 & 2033
- Figure 12: South America US Energy Storage Market Revenue (billion), by Phase 2025 & 2033
- Figure 13: South America US Energy Storage Market Revenue Share (%), by Phase 2025 & 2033
- Figure 14: South America US Energy Storage Market Revenue (billion), by End User 2025 & 2033
- Figure 15: South America US Energy Storage Market Revenue Share (%), by End User 2025 & 2033
- Figure 16: South America US Energy Storage Market Revenue (billion), by Country 2025 & 2033
- Figure 17: South America US Energy Storage Market Revenue Share (%), by Country 2025 & 2033
- Figure 18: Europe US Energy Storage Market Revenue (billion), by Technology 2025 & 2033
- Figure 19: Europe US Energy Storage Market Revenue Share (%), by Technology 2025 & 2033
- Figure 20: Europe US Energy Storage Market Revenue (billion), by Phase 2025 & 2033
- Figure 21: Europe US Energy Storage Market Revenue Share (%), by Phase 2025 & 2033
- Figure 22: Europe US Energy Storage Market Revenue (billion), by End User 2025 & 2033
- Figure 23: Europe US Energy Storage Market Revenue Share (%), by End User 2025 & 2033
- Figure 24: Europe US Energy Storage Market Revenue (billion), by Country 2025 & 2033
- Figure 25: Europe US Energy Storage Market Revenue Share (%), by Country 2025 & 2033
- Figure 26: Middle East & Africa US Energy Storage Market Revenue (billion), by Technology 2025 & 2033
- Figure 27: Middle East & Africa US Energy Storage Market Revenue Share (%), by Technology 2025 & 2033
- Figure 28: Middle East & Africa US Energy Storage Market Revenue (billion), by Phase 2025 & 2033
- Figure 29: Middle East & Africa US Energy Storage Market Revenue Share (%), by Phase 2025 & 2033
- Figure 30: Middle East & Africa US Energy Storage Market Revenue (billion), by End User 2025 & 2033
- Figure 31: Middle East & Africa US Energy Storage Market Revenue Share (%), by End User 2025 & 2033
- Figure 32: Middle East & Africa US Energy Storage Market Revenue (billion), by Country 2025 & 2033
- Figure 33: Middle East & Africa US Energy Storage Market Revenue Share (%), by Country 2025 & 2033
- Figure 34: Asia Pacific US Energy Storage Market Revenue (billion), by Technology 2025 & 2033
- Figure 35: Asia Pacific US Energy Storage Market Revenue Share (%), by Technology 2025 & 2033
- Figure 36: Asia Pacific US Energy Storage Market Revenue (billion), by Phase 2025 & 2033
- Figure 37: Asia Pacific US Energy Storage Market Revenue Share (%), by Phase 2025 & 2033
- Figure 38: Asia Pacific US Energy Storage Market Revenue (billion), by End User 2025 & 2033
- Figure 39: Asia Pacific US Energy Storage Market Revenue Share (%), by End User 2025 & 2033
- Figure 40: Asia Pacific US Energy Storage Market Revenue (billion), by Country 2025 & 2033
- Figure 41: Asia Pacific US Energy Storage Market Revenue Share (%), by Country 2025 & 2033
List of Tables
- Table 1: Global US Energy Storage Market Revenue billion Forecast, by Technology 2020 & 2033
- Table 2: Global US Energy Storage Market Revenue billion Forecast, by Phase 2020 & 2033
- Table 3: Global US Energy Storage Market Revenue billion Forecast, by End User 2020 & 2033
- Table 4: Global US Energy Storage Market Revenue billion Forecast, by Region 2020 & 2033
- Table 5: Global US Energy Storage Market Revenue billion Forecast, by Technology 2020 & 2033
- Table 6: Global US Energy Storage Market Revenue billion Forecast, by Phase 2020 & 2033
- Table 7: Global US Energy Storage Market Revenue billion Forecast, by End User 2020 & 2033
- Table 8: Global US Energy Storage Market Revenue billion Forecast, by Country 2020 & 2033
- Table 9: United States US Energy Storage Market Revenue (billion) Forecast, by Application 2020 & 2033
- Table 10: Canada US Energy Storage Market Revenue (billion) Forecast, by Application 2020 & 2033
- Table 11: Mexico US Energy Storage Market Revenue (billion) Forecast, by Application 2020 & 2033
- Table 12: Global US Energy Storage Market Revenue billion Forecast, by Technology 2020 & 2033
- Table 13: Global US Energy Storage Market Revenue billion Forecast, by Phase 2020 & 2033
- Table 14: Global US Energy Storage Market Revenue billion Forecast, by End User 2020 & 2033
- Table 15: Global US Energy Storage Market Revenue billion Forecast, by Country 2020 & 2033
- Table 16: Brazil US Energy Storage Market Revenue (billion) Forecast, by Application 2020 & 2033
- Table 17: Argentina US Energy Storage Market Revenue (billion) Forecast, by Application 2020 & 2033
- Table 18: Rest of South America US Energy Storage Market Revenue (billion) Forecast, by Application 2020 & 2033
- Table 19: Global US Energy Storage Market Revenue billion Forecast, by Technology 2020 & 2033
- Table 20: Global US Energy Storage Market Revenue billion Forecast, by Phase 2020 & 2033
- Table 21: Global US Energy Storage Market Revenue billion Forecast, by End User 2020 & 2033
- Table 22: Global US Energy Storage Market Revenue billion Forecast, by Country 2020 & 2033
- Table 23: United Kingdom US Energy Storage Market Revenue (billion) Forecast, by Application 2020 & 2033
- Table 24: Germany US Energy Storage Market Revenue (billion) Forecast, by Application 2020 & 2033
- Table 25: France US Energy Storage Market Revenue (billion) Forecast, by Application 2020 & 2033
- Table 26: Italy US Energy Storage Market Revenue (billion) Forecast, by Application 2020 & 2033
- Table 27: Spain US Energy Storage Market Revenue (billion) Forecast, by Application 2020 & 2033
- Table 28: Russia US Energy Storage Market Revenue (billion) Forecast, by Application 2020 & 2033
- Table 29: Benelux US Energy Storage Market Revenue (billion) Forecast, by Application 2020 & 2033
- Table 30: Nordics US Energy Storage Market Revenue (billion) Forecast, by Application 2020 & 2033
- Table 31: Rest of Europe US Energy Storage Market Revenue (billion) Forecast, by Application 2020 & 2033
- Table 32: Global US Energy Storage Market Revenue billion Forecast, by Technology 2020 & 2033
- Table 33: Global US Energy Storage Market Revenue billion Forecast, by Phase 2020 & 2033
- Table 34: Global US Energy Storage Market Revenue billion Forecast, by End User 2020 & 2033
- Table 35: Global US Energy Storage Market Revenue billion Forecast, by Country 2020 & 2033
- Table 36: Turkey US Energy Storage Market Revenue (billion) Forecast, by Application 2020 & 2033
- Table 37: Israel US Energy Storage Market Revenue (billion) Forecast, by Application 2020 & 2033
- Table 38: GCC US Energy Storage Market Revenue (billion) Forecast, by Application 2020 & 2033
- Table 39: North Africa US Energy Storage Market Revenue (billion) Forecast, by Application 2020 & 2033
- Table 40: South Africa US Energy Storage Market Revenue (billion) Forecast, by Application 2020 & 2033
- Table 41: Rest of Middle East & Africa US Energy Storage Market Revenue (billion) Forecast, by Application 2020 & 2033
- Table 42: Global US Energy Storage Market Revenue billion Forecast, by Technology 2020 & 2033
- Table 43: Global US Energy Storage Market Revenue billion Forecast, by Phase 2020 & 2033
- Table 44: Global US Energy Storage Market Revenue billion Forecast, by End User 2020 & 2033
- Table 45: Global US Energy Storage Market Revenue billion Forecast, by Country 2020 & 2033
- Table 46: China US Energy Storage Market Revenue (billion) Forecast, by Application 2020 & 2033
- Table 47: India US Energy Storage Market Revenue (billion) Forecast, by Application 2020 & 2033
- Table 48: Japan US Energy Storage Market Revenue (billion) Forecast, by Application 2020 & 2033
- Table 49: South Korea US Energy Storage Market Revenue (billion) Forecast, by Application 2020 & 2033
- Table 50: ASEAN US Energy Storage Market Revenue (billion) Forecast, by Application 2020 & 2033
- Table 51: Oceania US Energy Storage Market Revenue (billion) Forecast, by Application 2020 & 2033
- Table 52: Rest of Asia Pacific US Energy Storage Market Revenue (billion) Forecast, by Application 2020 & 2033
Frequently Asked Questions
1. What is the projected Compound Annual Growth Rate (CAGR) of the US Energy Storage Market?
The projected CAGR is approximately 29.1%.
2. Which companies are prominent players in the US Energy Storage Market?
Key companies in the market include BYD Co Ltd, LG Energy Solution Ltd, Voith GmbH & Co KGaA, Tesla Inc, Siemens Energy AG, Sungrow Power Supply Co Ltd, Fluence Energy*List Not Exhaustive, Andritz AG, Enphase Energy, Sonnen GmbH.
3. What are the main segments of the US Energy Storage Market?
The market segments include Technology, Phase, End User.
4. Can you provide details about the market size?
The market size is estimated to be USD 106.7 billion as of 2022.
5. What are some drivers contributing to market growth?
4.; The High Amount of Waste Generation in the Country4.; The growing Focus on Non-Fossil Fuel Sources.
6. What are the notable trends driving market growth?
Residential Segment Expected to Dominate the Market.
7. Are there any restraints impacting market growth?
4.; The Recycling Rate of Waste in Germany.
8. Can you provide examples of recent developments in the market?
In March 2021, Apple inspired the entire corporate world by setting up a solar farm to power its headquarters in California, the United States, and installing rooftop solar panels for its manufacturing park in the city. The company announced that the initiative has been taken by not only one arm, but its 110 manufacturing partners around the globe, which are switching to renewable options to power their infrastructure. It has also implemented a new energy storage project in California to pilot new solutions for renewable infrastructure.
9. What pricing options are available for accessing the report?
Pricing options include single-user, multi-user, and enterprise licenses priced at USD 3800, USD 4500, and USD 5800 respectively.
10. Is the market size provided in terms of value or volume?
The market size is provided in terms of value, measured in billion.
11. Are there any specific market keywords associated with the report?
Yes, the market keyword associated with the report is "US Energy Storage Market," which aids in identifying and referencing the specific market segment covered.
12. How do I determine which pricing option suits my needs best?
The pricing options vary based on user requirements and access needs. Individual users may opt for single-user licenses, while businesses requiring broader access may choose multi-user or enterprise licenses for cost-effective access to the report.
13. Are there any additional resources or data provided in the US Energy Storage Market report?
While the report offers comprehensive insights, it's advisable to review the specific contents or supplementary materials provided to ascertain if additional resources or data are available.
14. How can I stay updated on further developments or reports in the US Energy Storage Market?
To stay informed about further developments, trends, and reports in the US Energy Storage Market, consider subscribing to industry newsletters, following relevant companies and organizations, or regularly checking reputable industry news sources and publications.
Methodology
Step 1 - Identification of Relevant Samples Size from Population Database


Step 2 - Approaches for Defining Global Market Size (Value, Volume* & Price*)

Note*: In applicable scenarios
Step 3 - Data Sources
Primary Research
- Web Analytics
- Survey Reports
- Research Institute
- Latest Research Reports
- Opinion Leaders
Secondary Research
- Annual Reports
- White Paper
- Latest Press Release
- Industry Association
- Paid Database
- Investor Presentations

Step 4 - Data Triangulation
Involves using different sources of information in order to increase the validity of a study
These sources are likely to be stakeholders in a program - participants, other researchers, program staff, other community members, and so on.
Then we put all data in single framework & apply various statistical tools to find out the dynamic on the market.
During the analysis stage, feedback from the stakeholder groups would be compared to determine areas of agreement as well as areas of divergence