
Key Insights
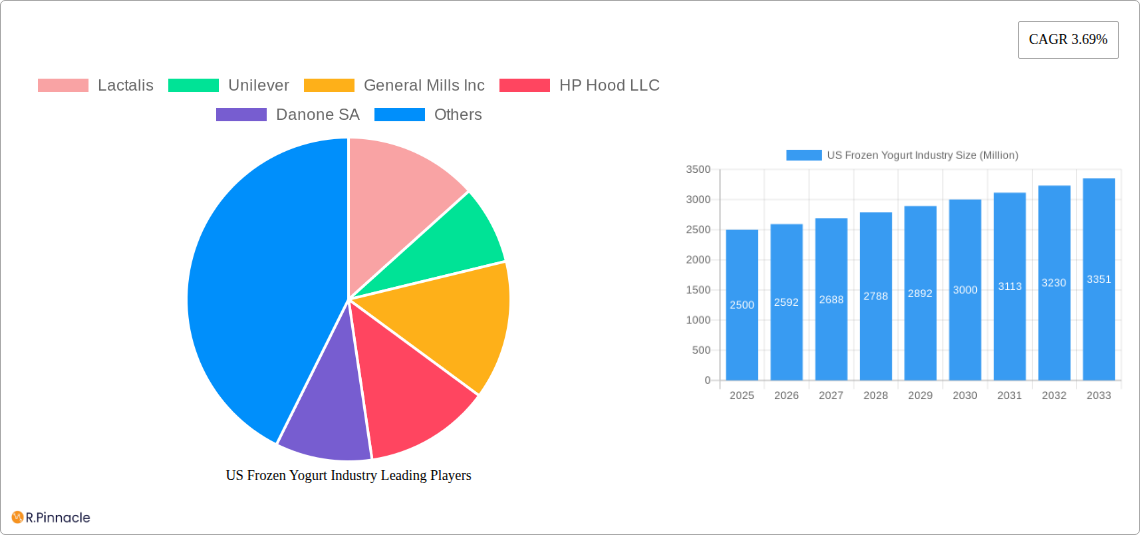
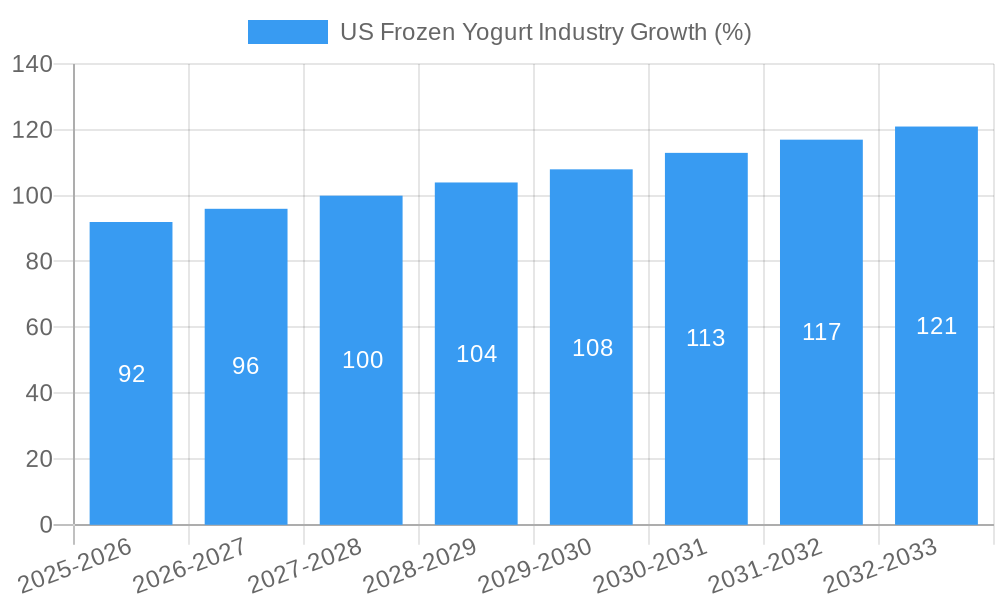
The US frozen yogurt market, valued at approximately $2.5 billion in 2025, is projected to experience steady growth, exhibiting a Compound Annual Growth Rate (CAGR) of 3.69% from 2025 to 2033. This growth is fueled by several key drivers. The increasing health consciousness among consumers is driving demand for healthier dessert options, with frozen yogurt often perceived as a lower-calorie alternative to ice cream. The rise of innovative flavors and product variations, including dairy-free and organic options, caters to evolving consumer preferences and dietary restrictions. Furthermore, strategic partnerships between frozen yogurt brands and retailers, particularly supermarkets and convenience stores, are expanding distribution channels and increasing market accessibility. The market is segmented by application (supermarket/hypermarkets, convenience stores, specialty stores, and other distribution channels) and by category (dairy-based and non-dairy frozen yogurt). Dairy-based frozen yogurt currently holds the largest market share, but non-dairy alternatives are experiencing significant growth driven by the increasing popularity of vegan and plant-based diets. While the market faces challenges like fluctuating dairy prices and intense competition from other dessert options, the overall outlook remains positive, driven by ongoing product innovation and expanding consumer demand.
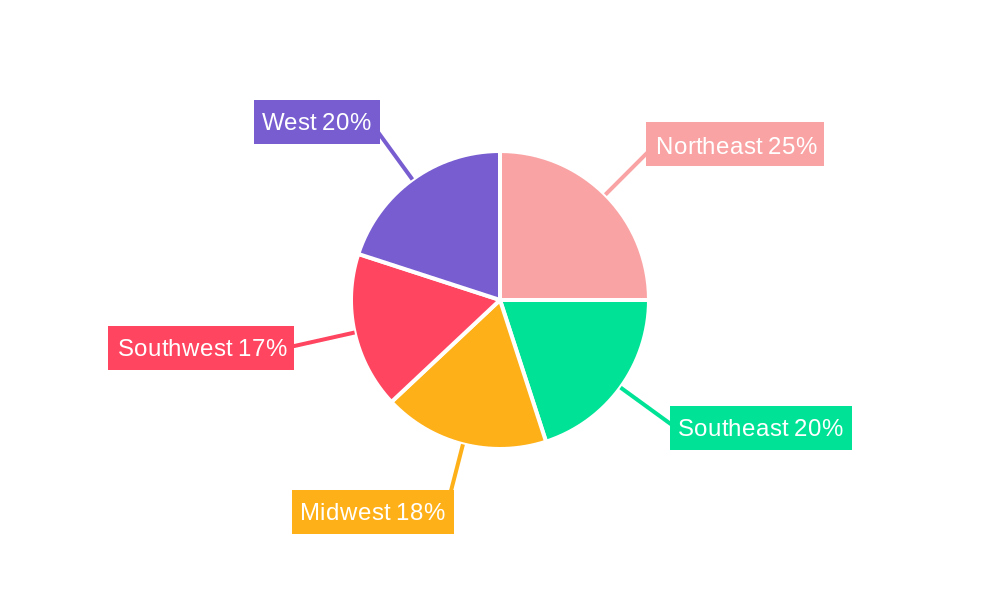
The regional distribution of the US frozen yogurt market reflects varying consumer preferences and purchasing power. The Northeast and West regions are expected to lead in market share due to higher population density and higher disposable incomes. However, growth potential exists across all regions, especially in the Southwest and Midwest, which are experiencing an increasing adoption of health-conscious lifestyles and a growing preference for convenient, on-the-go food options. Major players like Lactalis, Unilever, General Mills, HP Hood, Danone, Dairy Farmers of America, Wells Enterprises, and Prairie Farms Dairy are vying for market dominance through product diversification, strategic acquisitions, and enhanced brand visibility. These companies are actively adapting to changing consumer demands, investing in research and development, and focusing on building strong brand loyalty to maintain their competitive edge in the dynamic frozen yogurt landscape.
US Frozen Yogurt Industry Report: 2019-2033 - A Comprehensive Market Analysis
This comprehensive report provides a detailed analysis of the US Frozen Yogurt industry, offering invaluable insights for industry professionals, investors, and strategic decision-makers. The report covers the period from 2019 to 2033, with a focus on the estimated year 2025 and a forecast period of 2025-2033. Benefit from detailed segmentation analysis, market size estimations in Millions, and in-depth exploration of key players like Lactalis, Unilever, General Mills Inc, HP Hood LLC, Danone SA, Dairy Farmers of America Inc, Wells Enterprises, and Prairie Farms Dairy Inc. This data-driven report identifies growth opportunities, challenges, and future trends, enabling informed strategic planning.
US Frozen Yogurt Industry Market Structure & Innovation Trends
This section analyzes the competitive landscape of the US frozen yogurt market, including market concentration, innovation drivers, regulatory frameworks, product substitutes, end-user demographics, and M&A activities. The report assesses the market share held by key players such as Lactalis, Unilever, and General Mills Inc., quantifying their influence on market dynamics. We delve into the impact of regulatory changes on product development and distribution, examining the role of substitutes like ice cream and other frozen desserts. Further, the report explores the demographic trends influencing consumer preferences and the impact of M&A activities on market consolidation. We estimate the total value of M&A deals within the industry at approximately $XX Million during the historical period.
- Market Concentration: High, with top 5 players controlling an estimated xx% of market share in 2025.
- Innovation Drivers: Growing demand for healthier alternatives, functional ingredients, and unique flavors.
- Regulatory Framework: FDA regulations regarding labeling, ingredients, and safety standards.
- Product Substitutes: Ice cream, sorbet, and other frozen desserts.
- End-User Demographics: Growing preference among health-conscious millennials and Gen Z consumers.
- M&A Activity: Consolidation through acquisitions and mergers to expand market reach and product portfolios.
US Frozen Yogurt Industry Market Dynamics & Trends
This section explores the key factors driving market growth, including changing consumer preferences towards healthier frozen treats, technological advancements in production and packaging, and the increasing prevalence of online retail channels. We analyze the competitive landscape, highlighting the strategies employed by major players to maintain their market position. The report projects a CAGR of xx% for the US frozen yogurt market during the forecast period (2025-2033), with market penetration expected to reach xx% by 2033. Specific trends such as the rise of non-dairy options and the increasing demand for organic and sustainably sourced ingredients are also examined. We will assess the impact of technological advancements such as automation in production and innovative packaging solutions. The competitive dynamics within the market will be detailed, highlighting the strategies employed by key players to capture market share.
Dominant Regions & Segments in US Frozen Yogurt Industry
This section identifies the leading regions and segments within the US frozen yogurt market. Detailed analysis will reveal the key drivers behind the dominance of particular regions and segments.
By Application:
- Supermarket/Hypermarkets: This segment is projected to maintain its leading position due to widespread availability and high consumer traffic. Key drivers include strong retail infrastructure and established distribution networks.
- Convenience Stores: This segment experiences steady growth driven by convenience and impulse purchases.
- Specialty Stores: Growth is driven by the increasing demand for premium and specialized frozen yogurt products.
- Other Distribution Channels: This includes online retailers and food service establishments, showcasing increasing growth due to convenience and delivery services.
By Category:
- Dairy-based Frozen Yogurt: This segment remains dominant due to established consumer preference and familiarity with traditional flavors and textures.
- Non-dairy Frozen Yogurt: This is experiencing the fastest growth fueled by increasing consumer demand for plant-based alternatives and allergen-free options.
US Frozen Yogurt Industry Product Innovations
The US frozen yogurt market witnesses continuous product innovation driven by consumer demand for healthier, more convenient, and unique flavors. Recent developments include the introduction of low-sugar, high-protein options, plant-based alternatives, and innovative flavor combinations. Companies are also exploring sustainable packaging solutions and incorporating functional ingredients to enhance product appeal. This focus on innovation ensures market competitiveness and caters to evolving consumer preferences.
Report Scope & Segmentation Analysis
This report provides a comprehensive overview of the US Frozen Yogurt market segmented by application (Supermarket/Hypermarkets, Convenience Stores, Specialty Stores, Other Distribution Channels) and by category (Dairy-based Frozen Yogurt, Non-dairy Frozen Yogurt). Each segment is analyzed in detail, including market size, growth projections, and competitive dynamics. For example, the Supermarket/Hypermarket segment is expected to witness steady growth driven by established distribution channels, while the Non-dairy segment is projected to experience rapid expansion due to rising demand for plant-based alternatives.
Key Drivers of US Frozen Yogurt Industry Growth
Several factors are driving the growth of the US frozen yogurt industry. These include the increasing popularity of health-conscious consumers seeking healthier dessert alternatives, the rise of innovative flavors and product variations, and the expansion of distribution channels, including online platforms and specialty stores. Furthermore, favorable economic conditions and increasing disposable incomes also contribute to the market's expansion.
Challenges in the US Frozen Yogurt Industry Sector
The US frozen yogurt industry faces challenges such as increasing competition from other frozen dessert options, fluctuations in raw material prices, and stringent regulatory requirements concerning labeling and ingredients. Supply chain disruptions and maintaining consistent product quality across various distribution channels also present operational difficulties. These challenges necessitate efficient supply chain management and consistent product innovation to maintain market competitiveness.
Emerging Opportunities in US Frozen Yogurt Industry
The US frozen yogurt market presents several emerging opportunities. The growing demand for plant-based and organic options opens new avenues for product development. Expanding into new market segments, such as the food service sector and online retail channels, offers significant potential. Moreover, incorporating functional ingredients and focusing on sustainable practices further enhance market prospects.
Leading Players in the US Frozen Yogurt Industry Market
- Lactalis
- Unilever
- General Mills Inc
- HP Hood LLC
- Danone SA
- Dairy Farmers of America Inc
- Wells Enterprises
- Prairie Farms Dairy Inc
Key Developments in US Frozen Yogurt Industry
- 2022 Q3: Unilever launched a new line of organic frozen yogurt.
- 2023 Q1: General Mills acquired a smaller frozen yogurt producer, expanding its market share.
- 2024 Q2: Lactalis introduced a new range of plant-based frozen yogurt. (Further key developments will be detailed in the full report)
Future Outlook for US Frozen Yogurt Industry Market
The US frozen yogurt market is poised for continued growth, driven by evolving consumer preferences, technological advancements, and the introduction of innovative products. The increasing demand for healthier and more convenient options, coupled with expanding distribution channels and strategic acquisitions, will propel market expansion. This positive outlook presents significant opportunities for established players and new entrants alike. The market is anticipated to reach $XX Million by 2033.
US Frozen Yogurt Industry Segmentation
-
1. Category
- 1.1. Dairy-based Frozen Yogurt
- 1.2. Non-dairy Frozen Yogurt
-
2. Application
- 2.1. Supermarket/Hypermarkets
- 2.2. Convenience Stores
- 2.3. Specialty Stores
- 2.4. Other Distribution Channels
US Frozen Yogurt Industry Segmentation By Geography
-
1. North America
- 1.1. United States
- 1.2. Canada
- 1.3. Mexico
-
2. South America
- 2.1. Brazil
- 2.2. Argentina
- 2.3. Rest of South America
-
3. Europe
- 3.1. United Kingdom
- 3.2. Germany
- 3.3. France
- 3.4. Italy
- 3.5. Spain
- 3.6. Russia
- 3.7. Benelux
- 3.8. Nordics
- 3.9. Rest of Europe
-
4. Middle East & Africa
- 4.1. Turkey
- 4.2. Israel
- 4.3. GCC
- 4.4. North Africa
- 4.5. South Africa
- 4.6. Rest of Middle East & Africa
-
5. Asia Pacific
- 5.1. China
- 5.2. India
- 5.3. Japan
- 5.4. South Korea
- 5.5. ASEAN
- 5.6. Oceania
- 5.7. Rest of Asia Pacific
US Frozen Yogurt Industry REPORT HIGHLIGHTS
| Aspects | Details |
|---|---|
| Study Period | 2019-2033 |
| Base Year | 2024 |
| Estimated Year | 2025 |
| Forecast Period | 2025-2033 |
| Historical Period | 2019-2024 |
| Growth Rate | CAGR of 3.69% from 2019-2033 |
| Segmentation |
|
Table of Contents
- 1. Introduction
- 1.1. Research Scope
- 1.2. Market Segmentation
- 1.3. Research Methodology
- 1.4. Definitions and Assumptions
- 2. Executive Summary
- 2.1. Introduction
- 3. Market Dynamics
- 3.1. Introduction
- 3.2. Market Drivers
- 3.2.1. Increasing Health Concerns are Supporting the Market's Growth; Growing Consumer Preference for Convenience Seafood
- 3.3. Market Restrains
- 3.3.1. Rising Concern About Quality and Safety Standards of Canned Tuna
- 3.4. Market Trends
- 3.4.1. Growing Demand for Non-Dairy Frozen Yogurt
- 4. Market Factor Analysis
- 4.1. Porters Five Forces
- 4.2. Supply/Value Chain
- 4.3. PESTEL analysis
- 4.4. Market Entropy
- 4.5. Patent/Trademark Analysis
- 5. Global US Frozen Yogurt Industry Analysis, Insights and Forecast, 2019-2031
- 5.1. Market Analysis, Insights and Forecast - by Category
- 5.1.1. Dairy-based Frozen Yogurt
- 5.1.2. Non-dairy Frozen Yogurt
- 5.2. Market Analysis, Insights and Forecast - by Application
- 5.2.1. Supermarket/Hypermarkets
- 5.2.2. Convenience Stores
- 5.2.3. Specialty Stores
- 5.2.4. Other Distribution Channels
- 5.3. Market Analysis, Insights and Forecast - by Region
- 5.3.1. North America
- 5.3.2. South America
- 5.3.3. Europe
- 5.3.4. Middle East & Africa
- 5.3.5. Asia Pacific
- 5.1. Market Analysis, Insights and Forecast - by Category
- 6. North America US Frozen Yogurt Industry Analysis, Insights and Forecast, 2019-2031
- 6.1. Market Analysis, Insights and Forecast - by Category
- 6.1.1. Dairy-based Frozen Yogurt
- 6.1.2. Non-dairy Frozen Yogurt
- 6.2. Market Analysis, Insights and Forecast - by Application
- 6.2.1. Supermarket/Hypermarkets
- 6.2.2. Convenience Stores
- 6.2.3. Specialty Stores
- 6.2.4. Other Distribution Channels
- 6.1. Market Analysis, Insights and Forecast - by Category
- 7. South America US Frozen Yogurt Industry Analysis, Insights and Forecast, 2019-2031
- 7.1. Market Analysis, Insights and Forecast - by Category
- 7.1.1. Dairy-based Frozen Yogurt
- 7.1.2. Non-dairy Frozen Yogurt
- 7.2. Market Analysis, Insights and Forecast - by Application
- 7.2.1. Supermarket/Hypermarkets
- 7.2.2. Convenience Stores
- 7.2.3. Specialty Stores
- 7.2.4. Other Distribution Channels
- 7.1. Market Analysis, Insights and Forecast - by Category
- 8. Europe US Frozen Yogurt Industry Analysis, Insights and Forecast, 2019-2031
- 8.1. Market Analysis, Insights and Forecast - by Category
- 8.1.1. Dairy-based Frozen Yogurt
- 8.1.2. Non-dairy Frozen Yogurt
- 8.2. Market Analysis, Insights and Forecast - by Application
- 8.2.1. Supermarket/Hypermarkets
- 8.2.2. Convenience Stores
- 8.2.3. Specialty Stores
- 8.2.4. Other Distribution Channels
- 8.1. Market Analysis, Insights and Forecast - by Category
- 9. Middle East & Africa US Frozen Yogurt Industry Analysis, Insights and Forecast, 2019-2031
- 9.1. Market Analysis, Insights and Forecast - by Category
- 9.1.1. Dairy-based Frozen Yogurt
- 9.1.2. Non-dairy Frozen Yogurt
- 9.2. Market Analysis, Insights and Forecast - by Application
- 9.2.1. Supermarket/Hypermarkets
- 9.2.2. Convenience Stores
- 9.2.3. Specialty Stores
- 9.2.4. Other Distribution Channels
- 9.1. Market Analysis, Insights and Forecast - by Category
- 10. Asia Pacific US Frozen Yogurt Industry Analysis, Insights and Forecast, 2019-2031
- 10.1. Market Analysis, Insights and Forecast - by Category
- 10.1.1. Dairy-based Frozen Yogurt
- 10.1.2. Non-dairy Frozen Yogurt
- 10.2. Market Analysis, Insights and Forecast - by Application
- 10.2.1. Supermarket/Hypermarkets
- 10.2.2. Convenience Stores
- 10.2.3. Specialty Stores
- 10.2.4. Other Distribution Channels
- 10.1. Market Analysis, Insights and Forecast - by Category
- 11. Northeast US Frozen Yogurt Industry Analysis, Insights and Forecast, 2019-2031
- 12. Southeast US Frozen Yogurt Industry Analysis, Insights and Forecast, 2019-2031
- 13. Midwest US Frozen Yogurt Industry Analysis, Insights and Forecast, 2019-2031
- 14. Southwest US Frozen Yogurt Industry Analysis, Insights and Forecast, 2019-2031
- 15. West US Frozen Yogurt Industry Analysis, Insights and Forecast, 2019-2031
- 16. Competitive Analysis
- 16.1. Global Market Share Analysis 2024
- 16.2. Company Profiles
- 16.2.1 Lactalis
- 16.2.1.1. Overview
- 16.2.1.2. Products
- 16.2.1.3. SWOT Analysis
- 16.2.1.4. Recent Developments
- 16.2.1.5. Financials (Based on Availability)
- 16.2.2 Unilever
- 16.2.2.1. Overview
- 16.2.2.2. Products
- 16.2.2.3. SWOT Analysis
- 16.2.2.4. Recent Developments
- 16.2.2.5. Financials (Based on Availability)
- 16.2.3 General Mills Inc
- 16.2.3.1. Overview
- 16.2.3.2. Products
- 16.2.3.3. SWOT Analysis
- 16.2.3.4. Recent Developments
- 16.2.3.5. Financials (Based on Availability)
- 16.2.4 HP Hood LLC
- 16.2.4.1. Overview
- 16.2.4.2. Products
- 16.2.4.3. SWOT Analysis
- 16.2.4.4. Recent Developments
- 16.2.4.5. Financials (Based on Availability)
- 16.2.5 Danone SA
- 16.2.5.1. Overview
- 16.2.5.2. Products
- 16.2.5.3. SWOT Analysis
- 16.2.5.4. Recent Developments
- 16.2.5.5. Financials (Based on Availability)
- 16.2.6 Dairy Farmers of America Inc
- 16.2.6.1. Overview
- 16.2.6.2. Products
- 16.2.6.3. SWOT Analysis
- 16.2.6.4. Recent Developments
- 16.2.6.5. Financials (Based on Availability)
- 16.2.7 Wells Enterpris
- 16.2.7.1. Overview
- 16.2.7.2. Products
- 16.2.7.3. SWOT Analysis
- 16.2.7.4. Recent Developments
- 16.2.7.5. Financials (Based on Availability)
- 16.2.8 Prairie Farms Dairy Inc
- 16.2.8.1. Overview
- 16.2.8.2. Products
- 16.2.8.3. SWOT Analysis
- 16.2.8.4. Recent Developments
- 16.2.8.5. Financials (Based on Availability)
- 16.2.1 Lactalis
List of Figures
- Figure 1: Global US Frozen Yogurt Industry Revenue Breakdown (Million, %) by Region 2024 & 2032
- Figure 2: United states US Frozen Yogurt Industry Revenue (Million), by Country 2024 & 2032
- Figure 3: United states US Frozen Yogurt Industry Revenue Share (%), by Country 2024 & 2032
- Figure 4: North America US Frozen Yogurt Industry Revenue (Million), by Category 2024 & 2032
- Figure 5: North America US Frozen Yogurt Industry Revenue Share (%), by Category 2024 & 2032
- Figure 6: North America US Frozen Yogurt Industry Revenue (Million), by Application 2024 & 2032
- Figure 7: North America US Frozen Yogurt Industry Revenue Share (%), by Application 2024 & 2032
- Figure 8: North America US Frozen Yogurt Industry Revenue (Million), by Country 2024 & 2032
- Figure 9: North America US Frozen Yogurt Industry Revenue Share (%), by Country 2024 & 2032
- Figure 10: South America US Frozen Yogurt Industry Revenue (Million), by Category 2024 & 2032
- Figure 11: South America US Frozen Yogurt Industry Revenue Share (%), by Category 2024 & 2032
- Figure 12: South America US Frozen Yogurt Industry Revenue (Million), by Application 2024 & 2032
- Figure 13: South America US Frozen Yogurt Industry Revenue Share (%), by Application 2024 & 2032
- Figure 14: South America US Frozen Yogurt Industry Revenue (Million), by Country 2024 & 2032
- Figure 15: South America US Frozen Yogurt Industry Revenue Share (%), by Country 2024 & 2032
- Figure 16: Europe US Frozen Yogurt Industry Revenue (Million), by Category 2024 & 2032
- Figure 17: Europe US Frozen Yogurt Industry Revenue Share (%), by Category 2024 & 2032
- Figure 18: Europe US Frozen Yogurt Industry Revenue (Million), by Application 2024 & 2032
- Figure 19: Europe US Frozen Yogurt Industry Revenue Share (%), by Application 2024 & 2032
- Figure 20: Europe US Frozen Yogurt Industry Revenue (Million), by Country 2024 & 2032
- Figure 21: Europe US Frozen Yogurt Industry Revenue Share (%), by Country 2024 & 2032
- Figure 22: Middle East & Africa US Frozen Yogurt Industry Revenue (Million), by Category 2024 & 2032
- Figure 23: Middle East & Africa US Frozen Yogurt Industry Revenue Share (%), by Category 2024 & 2032
- Figure 24: Middle East & Africa US Frozen Yogurt Industry Revenue (Million), by Application 2024 & 2032
- Figure 25: Middle East & Africa US Frozen Yogurt Industry Revenue Share (%), by Application 2024 & 2032
- Figure 26: Middle East & Africa US Frozen Yogurt Industry Revenue (Million), by Country 2024 & 2032
- Figure 27: Middle East & Africa US Frozen Yogurt Industry Revenue Share (%), by Country 2024 & 2032
- Figure 28: Asia Pacific US Frozen Yogurt Industry Revenue (Million), by Category 2024 & 2032
- Figure 29: Asia Pacific US Frozen Yogurt Industry Revenue Share (%), by Category 2024 & 2032
- Figure 30: Asia Pacific US Frozen Yogurt Industry Revenue (Million), by Application 2024 & 2032
- Figure 31: Asia Pacific US Frozen Yogurt Industry Revenue Share (%), by Application 2024 & 2032
- Figure 32: Asia Pacific US Frozen Yogurt Industry Revenue (Million), by Country 2024 & 2032
- Figure 33: Asia Pacific US Frozen Yogurt Industry Revenue Share (%), by Country 2024 & 2032
List of Tables
- Table 1: Global US Frozen Yogurt Industry Revenue Million Forecast, by Region 2019 & 2032
- Table 2: Global US Frozen Yogurt Industry Revenue Million Forecast, by Category 2019 & 2032
- Table 3: Global US Frozen Yogurt Industry Revenue Million Forecast, by Application 2019 & 2032
- Table 4: Global US Frozen Yogurt Industry Revenue Million Forecast, by Region 2019 & 2032
- Table 5: Global US Frozen Yogurt Industry Revenue Million Forecast, by Country 2019 & 2032
- Table 6: Northeast US Frozen Yogurt Industry Revenue (Million) Forecast, by Application 2019 & 2032
- Table 7: Southeast US Frozen Yogurt Industry Revenue (Million) Forecast, by Application 2019 & 2032
- Table 8: Midwest US Frozen Yogurt Industry Revenue (Million) Forecast, by Application 2019 & 2032
- Table 9: Southwest US Frozen Yogurt Industry Revenue (Million) Forecast, by Application 2019 & 2032
- Table 10: West US Frozen Yogurt Industry Revenue (Million) Forecast, by Application 2019 & 2032
- Table 11: Global US Frozen Yogurt Industry Revenue Million Forecast, by Category 2019 & 2032
- Table 12: Global US Frozen Yogurt Industry Revenue Million Forecast, by Application 2019 & 2032
- Table 13: Global US Frozen Yogurt Industry Revenue Million Forecast, by Country 2019 & 2032
- Table 14: United States US Frozen Yogurt Industry Revenue (Million) Forecast, by Application 2019 & 2032
- Table 15: Canada US Frozen Yogurt Industry Revenue (Million) Forecast, by Application 2019 & 2032
- Table 16: Mexico US Frozen Yogurt Industry Revenue (Million) Forecast, by Application 2019 & 2032
- Table 17: Global US Frozen Yogurt Industry Revenue Million Forecast, by Category 2019 & 2032
- Table 18: Global US Frozen Yogurt Industry Revenue Million Forecast, by Application 2019 & 2032
- Table 19: Global US Frozen Yogurt Industry Revenue Million Forecast, by Country 2019 & 2032
- Table 20: Brazil US Frozen Yogurt Industry Revenue (Million) Forecast, by Application 2019 & 2032
- Table 21: Argentina US Frozen Yogurt Industry Revenue (Million) Forecast, by Application 2019 & 2032
- Table 22: Rest of South America US Frozen Yogurt Industry Revenue (Million) Forecast, by Application 2019 & 2032
- Table 23: Global US Frozen Yogurt Industry Revenue Million Forecast, by Category 2019 & 2032
- Table 24: Global US Frozen Yogurt Industry Revenue Million Forecast, by Application 2019 & 2032
- Table 25: Global US Frozen Yogurt Industry Revenue Million Forecast, by Country 2019 & 2032
- Table 26: United Kingdom US Frozen Yogurt Industry Revenue (Million) Forecast, by Application 2019 & 2032
- Table 27: Germany US Frozen Yogurt Industry Revenue (Million) Forecast, by Application 2019 & 2032
- Table 28: France US Frozen Yogurt Industry Revenue (Million) Forecast, by Application 2019 & 2032
- Table 29: Italy US Frozen Yogurt Industry Revenue (Million) Forecast, by Application 2019 & 2032
- Table 30: Spain US Frozen Yogurt Industry Revenue (Million) Forecast, by Application 2019 & 2032
- Table 31: Russia US Frozen Yogurt Industry Revenue (Million) Forecast, by Application 2019 & 2032
- Table 32: Benelux US Frozen Yogurt Industry Revenue (Million) Forecast, by Application 2019 & 2032
- Table 33: Nordics US Frozen Yogurt Industry Revenue (Million) Forecast, by Application 2019 & 2032
- Table 34: Rest of Europe US Frozen Yogurt Industry Revenue (Million) Forecast, by Application 2019 & 2032
- Table 35: Global US Frozen Yogurt Industry Revenue Million Forecast, by Category 2019 & 2032
- Table 36: Global US Frozen Yogurt Industry Revenue Million Forecast, by Application 2019 & 2032
- Table 37: Global US Frozen Yogurt Industry Revenue Million Forecast, by Country 2019 & 2032
- Table 38: Turkey US Frozen Yogurt Industry Revenue (Million) Forecast, by Application 2019 & 2032
- Table 39: Israel US Frozen Yogurt Industry Revenue (Million) Forecast, by Application 2019 & 2032
- Table 40: GCC US Frozen Yogurt Industry Revenue (Million) Forecast, by Application 2019 & 2032
- Table 41: North Africa US Frozen Yogurt Industry Revenue (Million) Forecast, by Application 2019 & 2032
- Table 42: South Africa US Frozen Yogurt Industry Revenue (Million) Forecast, by Application 2019 & 2032
- Table 43: Rest of Middle East & Africa US Frozen Yogurt Industry Revenue (Million) Forecast, by Application 2019 & 2032
- Table 44: Global US Frozen Yogurt Industry Revenue Million Forecast, by Category 2019 & 2032
- Table 45: Global US Frozen Yogurt Industry Revenue Million Forecast, by Application 2019 & 2032
- Table 46: Global US Frozen Yogurt Industry Revenue Million Forecast, by Country 2019 & 2032
- Table 47: China US Frozen Yogurt Industry Revenue (Million) Forecast, by Application 2019 & 2032
- Table 48: India US Frozen Yogurt Industry Revenue (Million) Forecast, by Application 2019 & 2032
- Table 49: Japan US Frozen Yogurt Industry Revenue (Million) Forecast, by Application 2019 & 2032
- Table 50: South Korea US Frozen Yogurt Industry Revenue (Million) Forecast, by Application 2019 & 2032
- Table 51: ASEAN US Frozen Yogurt Industry Revenue (Million) Forecast, by Application 2019 & 2032
- Table 52: Oceania US Frozen Yogurt Industry Revenue (Million) Forecast, by Application 2019 & 2032
- Table 53: Rest of Asia Pacific US Frozen Yogurt Industry Revenue (Million) Forecast, by Application 2019 & 2032
Frequently Asked Questions
1. What is the projected Compound Annual Growth Rate (CAGR) of the US Frozen Yogurt Industry?
The projected CAGR is approximately 3.69%.
2. Which companies are prominent players in the US Frozen Yogurt Industry?
Key companies in the market include Lactalis, Unilever, General Mills Inc, HP Hood LLC, Danone SA, Dairy Farmers of America Inc, Wells Enterpris, Prairie Farms Dairy Inc.
3. What are the main segments of the US Frozen Yogurt Industry?
The market segments include Category, Application.
4. Can you provide details about the market size?
The market size is estimated to be USD XX Million as of 2022.
5. What are some drivers contributing to market growth?
Increasing Health Concerns are Supporting the Market's Growth; Growing Consumer Preference for Convenience Seafood.
6. What are the notable trends driving market growth?
Growing Demand for Non-Dairy Frozen Yogurt.
7. Are there any restraints impacting market growth?
Rising Concern About Quality and Safety Standards of Canned Tuna.
8. Can you provide examples of recent developments in the market?
N/A
9. What pricing options are available for accessing the report?
Pricing options include single-user, multi-user, and enterprise licenses priced at USD 3800, USD 4500, and USD 5800 respectively.
10. Is the market size provided in terms of value or volume?
The market size is provided in terms of value, measured in Million.
11. Are there any specific market keywords associated with the report?
Yes, the market keyword associated with the report is "US Frozen Yogurt Industry," which aids in identifying and referencing the specific market segment covered.
12. How do I determine which pricing option suits my needs best?
The pricing options vary based on user requirements and access needs. Individual users may opt for single-user licenses, while businesses requiring broader access may choose multi-user or enterprise licenses for cost-effective access to the report.
13. Are there any additional resources or data provided in the US Frozen Yogurt Industry report?
While the report offers comprehensive insights, it's advisable to review the specific contents or supplementary materials provided to ascertain if additional resources or data are available.
14. How can I stay updated on further developments or reports in the US Frozen Yogurt Industry?
To stay informed about further developments, trends, and reports in the US Frozen Yogurt Industry, consider subscribing to industry newsletters, following relevant companies and organizations, or regularly checking reputable industry news sources and publications.
Methodology
Step 1 - Identification of Relevant Samples Size from Population Database


Step 2 - Approaches for Defining Global Market Size (Value, Volume* & Price*)

Note*: In applicable scenarios
Step 3 - Data Sources
Primary Research
- Web Analytics
- Survey Reports
- Research Institute
- Latest Research Reports
- Opinion Leaders
Secondary Research
- Annual Reports
- White Paper
- Latest Press Release
- Industry Association
- Paid Database
- Investor Presentations

Step 4 - Data Triangulation
Involves using different sources of information in order to increase the validity of a study
These sources are likely to be stakeholders in a program - participants, other researchers, program staff, other community members, and so on.
Then we put all data in single framework & apply various statistical tools to find out the dynamic on the market.
During the analysis stage, feedback from the stakeholder groups would be compared to determine areas of agreement as well as areas of divergence


