

Key Insights
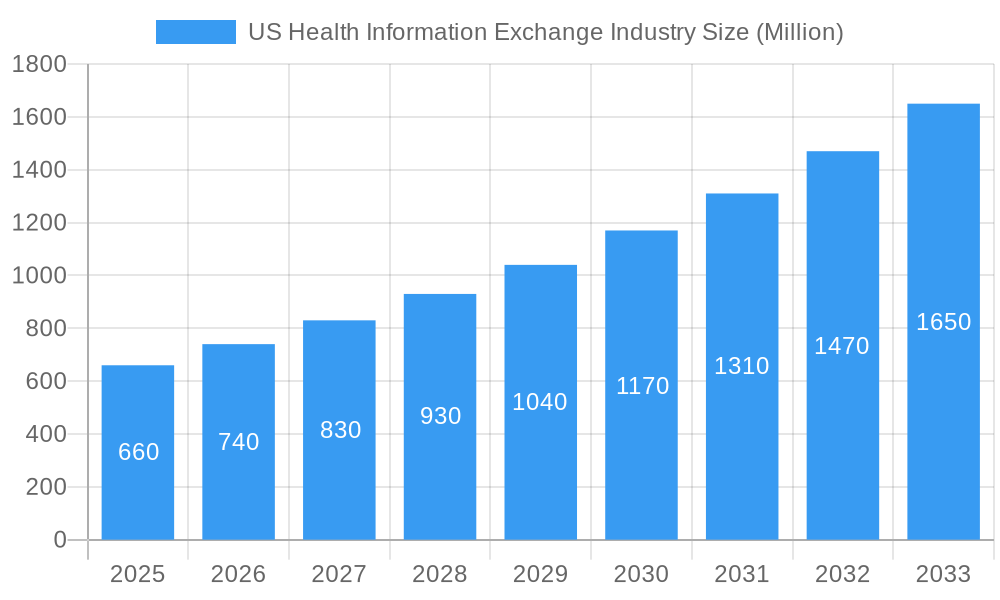
The US Health Information Exchange (HIE) market, valued at $0.66 billion in 2025, is projected to experience robust growth, driven by a compound annual growth rate (CAGR) of 12.12% from 2025 to 2033. This expansion is fueled by several key factors. Increasing government mandates for interoperability and data sharing to improve patient care and reduce healthcare costs are significant drivers. The rising adoption of electronic health records (EHRs) and the growing need for seamless data exchange between healthcare providers are further accelerating market growth. Furthermore, advancements in technologies like cloud computing, artificial intelligence (AI), and blockchain are enhancing the security, efficiency, and scalability of HIE solutions. The increasing focus on value-based care models and population health management also contributes to the demand for efficient data exchange platforms. Different exchange types, including direct exchange, query-based exchange, and consumer-mediated exchange, cater to diverse needs within the healthcare ecosystem. The market is segmented by components (EMPI, HPD, RLS, Clinical Data Repositories, etc.), implementation models (centralized, decentralized, hybrid), setup types (private, public), and applications (internal interfacing, secure messaging, workflow management, etc.). Major players like Epic, Cerner, McKesson, and Allscripts are actively shaping the market landscape through innovation and strategic partnerships.
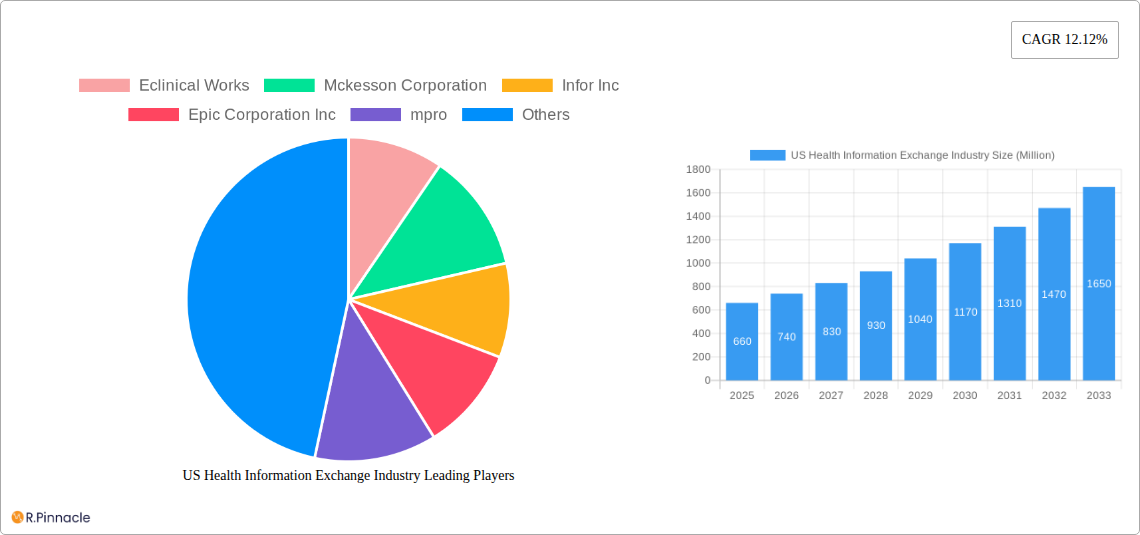
US Health Information Exchange Industry Market Size (In Million)
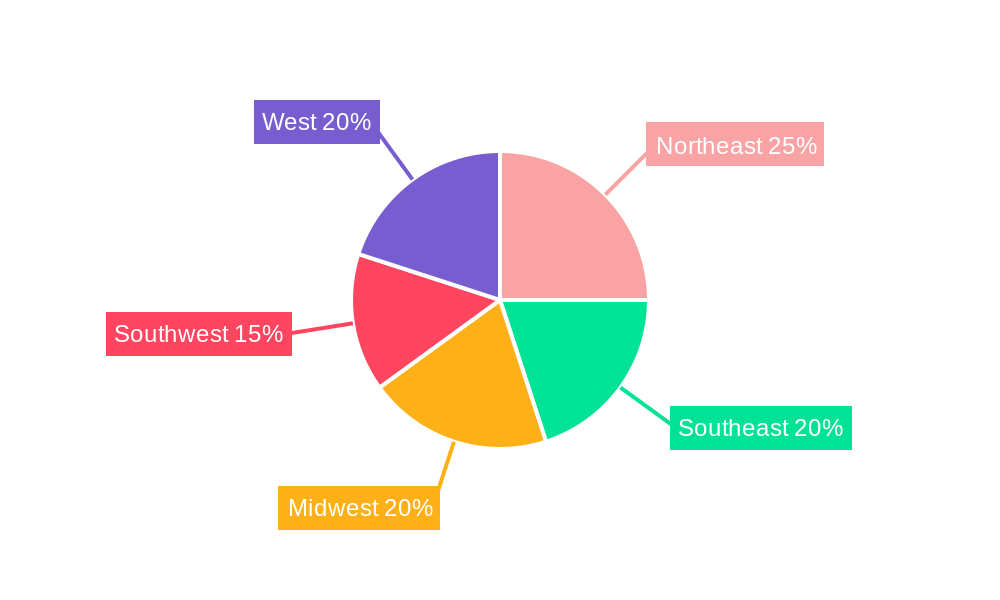
The regional distribution of the US HIE market reflects the uneven distribution of healthcare facilities and technological adoption across the country. While precise regional breakdowns are not provided, it is likely that states with higher concentrations of healthcare institutions and advanced digital infrastructure, such as those in the Northeast and West, exhibit larger market shares. However, growth is expected across all regions as government initiatives and technological advancements reach wider areas. The market's future trajectory depends on the continued success of government initiatives promoting interoperability, the pace of EHR adoption, and the ability of HIE solutions to adapt to evolving regulatory landscapes and patient privacy concerns. Addressing cybersecurity challenges and ensuring data integrity will be crucial for maintaining market confidence and sustained growth.
US Health Information Exchange Industry Company Market Share
This comprehensive report provides an in-depth analysis of the US Health Information Exchange (HIE) industry, offering valuable insights for stakeholders across the healthcare ecosystem. Covering the period from 2019 to 2033, with a focus on 2025, this report examines market dynamics, technological advancements, and key players shaping the future of healthcare data exchange. The report projects a market valued at $XX Million in 2025, and forecasts substantial growth through 2033.
US Health Information Exchange Industry Market Structure & Innovation Trends
This section analyzes the competitive landscape, innovation drivers, and regulatory influences within the US HIE market. The market is characterized by a mix of large established players and emerging innovative companies. Market concentration is moderate, with key players such as Epic Corporation Inc, Cerner Corporation, and McKesson Corporation holding significant market share, estimated at xx%, xx%, and xx% respectively, in 2025. However, smaller, specialized companies are also making significant contributions, particularly in niche segments.
Mergers and acquisitions (M&A) activity has been significant, with deal values totaling $XX Million in the past five years. Notable acquisitions include [Insert specific examples if available, otherwise use "several strategic acquisitions aimed at expanding product portfolios and geographic reach"]. The regulatory environment, primarily driven by HIPAA and other federal and state regulations, significantly impacts market operations and innovation. The industry is subject to stringent data privacy and security requirements, influencing technological advancements and vendor selection. Product substitutes are limited, primarily driven by internal legacy systems that require substantial upgrades before seamless data exchange can be achieved. The end-user demographic is expanding, encompassing healthcare providers, payers, and increasingly, consumers themselves.
- Market Share (2025, estimated):
- Epic Corporation Inc: xx%
- Cerner Corporation: xx%
- McKesson Corporation: xx%
- Others: xx%
- M&A Deal Value (2019-2024): $XX Million
US Health Information Exchange Industry Market Dynamics & Trends
The US HIE market is experiencing robust growth, driven by several factors. The increasing adoption of electronic health records (EHRs) and the growing need for interoperability are key market drivers. Technological advancements, such as cloud computing and artificial intelligence (AI), are accelerating the development of more sophisticated and efficient HIE solutions. Furthermore, consumer preferences for greater access and control over their health data are shaping the market. The market is witnessing a shift towards consumer-mediated exchanges, driven by increasing patient empowerment and demand for data portability. Competitive dynamics are intense, with established players facing challenges from nimble startups offering innovative solutions. The Compound Annual Growth Rate (CAGR) is projected to be xx% during the forecast period (2025-2033), with market penetration expected to reach xx% by 2033.
Dominant Regions & Segments in US Health Information Exchange Industry
The US HIE market exhibits regional variations in adoption and growth. [Specify the leading region based on your data. For example: The Northeast region demonstrates the highest market penetration due to factors such as robust healthcare infrastructure and early adoption of EHRs.] However, growth is anticipated across all regions as the demand for interoperable healthcare data increases nationwide.
Key Drivers:
- Economic Policies: Government initiatives promoting interoperability and data exchange are crucial.
- Healthcare Infrastructure: Robust IT infrastructure and high internet penetration are essential.
- Regulatory Frameworks: Clear regulations and compliance standards foster growth.
Dominant Segments (2025, estimated):
- Exchange Type: Direct Exchange holds the largest market share due to its reliability and security features, followed by Query-based Exchange and then Consumer-mediated Exchange which is growing rapidly.
- Component: Enterprise Master Person Index (EMPI) is a critical component, followed by Healthcare Provider Directory (HPD) and Record Locator Service (RLS). Clinical Data Repositories are also a significant component, with growth driven by the increasing need for comprehensive patient data aggregation.
- Implementation Model: Decentralized/Federated models are gaining popularity due to their flexibility and scalability.
- Setup Type: Private setups remain prevalent due to data security and privacy concerns. However, public setups are growing, driven by initiatives to improve data sharing and collaboration.
- Application: Internal interfacing and secure messaging remain core applications, while workflow management and web portal development are witnessing rapid growth. Patient safety applications are also gaining traction.
US Health Information Exchange Industry Product Innovations
The HIE industry is characterized by continuous product innovation, driven by advancements in data analytics, AI, and cloud computing. New products are focused on improving data interoperability, enhancing security features, and offering more user-friendly interfaces. The integration of AI and machine learning algorithms is enabling more sophisticated data analysis, leading to improved patient outcomes and operational efficiencies. These innovations are improving market fit by addressing the critical needs of healthcare providers and payers for seamless data exchange and improved decision-making.
Report Scope & Segmentation Analysis
This report provides a detailed segmentation analysis of the US HIE market across various parameters, including exchange type, components, implementation models, setup type, and applications. Each segment's market size, growth projections, and competitive dynamics are thoroughly examined. For example, the Direct Exchange segment is projected to grow at a CAGR of xx% during the forecast period (2025-2033), driven by the increasing demand for secure and reliable data exchange. Similarly, the EMPI component is expected to experience strong growth due to its crucial role in patient identification and data linkage. The report provides a detailed analysis of each segment, providing valuable insights into market trends and opportunities.
Key Drivers of US Health Information Exchange Industry Growth
Several factors are driving the growth of the US HIE industry. Technological advancements, including cloud computing and AI, are enabling the development of more efficient and scalable HIE solutions. Government initiatives promoting interoperability and data exchange are creating a favorable regulatory environment. The rising adoption of EHRs and the increasing demand for improved patient care are also contributing to market growth. Furthermore, the growing awareness of the benefits of data sharing among healthcare providers and payers is driving increased adoption of HIE solutions. The need for improved population health management and reduced healthcare costs also fuel market expansion.
Challenges in the US Health Information Exchange Industry Sector
Despite the significant growth potential, the US HIE industry faces several challenges. Data security and privacy concerns are paramount, requiring robust security measures and compliance with strict regulations. Interoperability issues, particularly between different EHR systems, can hinder data exchange. The high cost of implementation and maintenance of HIE solutions can be a barrier to entry for some providers. Furthermore, the need for standardization and harmonization of data formats and protocols is crucial to ensure seamless data exchange across different systems. These challenges result in significant delays in data access impacting patient care, operational inefficiencies and potentially negatively impacting financial performance.
Emerging Opportunities in US Health Information Exchange Industry
The US HIE industry presents several emerging opportunities. The increasing adoption of telehealth and remote patient monitoring is creating new demand for secure data exchange solutions. The growth of value-based care models is driving the need for more comprehensive patient data aggregation and analysis. The increasing focus on population health management is creating opportunities for HIE solutions to support better disease prevention and care coordination. Furthermore, advancements in AI and machine learning are enabling more sophisticated data analytics, creating new opportunities for improving patient outcomes and reducing healthcare costs.
Leading Players in the US Health Information Exchange Industry Market
- Eclinical Works
- Mckesson Corporation
- Infor Inc
- Epic Corporation Inc
- mpro
- Cerner Corporation
- Optum Inc
- Allscripts Healthcare Solutions Inc
- Nextgen Healthcare Information Systems LLC
- Newgen Software Technologies
- Conifer Health Solutions
- Medicity Inc
Key Developments in US Health Information Exchange Industry Industry
- October 2022: Mpowered Health launched its xChange, a consumer-mediated healthcare data exchange, expanding options for patient data access and control. This significantly impacts market dynamics by empowering patients and increasing competition.
- March 2022: mpro5 Inc entered the US market, focusing on real-time data collection and leveraging technology to simplify complex healthcare operations. This highlights a shift towards real-time data analytics and efficiency improvements in the industry.
Future Outlook for US Health Information Exchange Industry Market
The future outlook for the US HIE market is positive, driven by continued technological advancements, increasing government support, and growing demand for interoperable healthcare data. The market is poised for significant growth, with increasing adoption of cloud-based solutions, AI-powered analytics, and consumer-centric data exchange platforms. Strategic partnerships and collaborations are likely to play a crucial role in shaping the future of the industry, further enhancing data sharing and improving patient care. The industry is expected to continue its trajectory of growth and innovation, driven by technological advancements, changing healthcare models, and increasing emphasis on patient-centered care.
US Health Information Exchange Industry Segmentation
-
1. Implementation Model
- 1.1. Centralized/Consolidated Models
- 1.2. Decentralized/Federated Models
- 1.3. Hybrid Model
-
2. Setup Type
- 2.1. Private
- 2.2. Public
-
3. Application
- 3.1. Internal Interfacing
- 3.2. Secure Messaging
- 3.3. Workflow Management
- 3.4. Web Portal Development
- 3.5. Patient Safety
-
4. Exchange Type
- 4.1. Direct Exchange
- 4.2. Query-based Exchange
- 4.3. Consumer-mediated Exchange
-
5. Component
- 5.1. Enterprise Master Person Index (EMPI)
- 5.2. Healthcare Provider Directory (HPD)
- 5.3. Record Locator Service (RLS)
- 5.4. Clinical Data Repository
- 5.5. Other Components
US Health Information Exchange Industry Segmentation By Geography
-
1. North America
- 1.1. United States
- 1.2. Canada
- 1.3. Mexico
-
2. South America
- 2.1. Brazil
- 2.2. Argentina
- 2.3. Rest of South America
-
3. Europe
- 3.1. United Kingdom
- 3.2. Germany
- 3.3. France
- 3.4. Italy
- 3.5. Spain
- 3.6. Russia
- 3.7. Benelux
- 3.8. Nordics
- 3.9. Rest of Europe
-
4. Middle East & Africa
- 4.1. Turkey
- 4.2. Israel
- 4.3. GCC
- 4.4. North Africa
- 4.5. South Africa
- 4.6. Rest of Middle East & Africa
-
5. Asia Pacific
- 5.1. China
- 5.2. India
- 5.3. Japan
- 5.4. South Korea
- 5.5. ASEAN
- 5.6. Oceania
- 5.7. Rest of Asia Pacific
US Health Information Exchange Industry Regional Market Share
Geographic Coverage of US Health Information Exchange Industry
US Health Information Exchange Industry REPORT HIGHLIGHTS
| Aspects | Details |
|---|---|
| Study Period | 2020-2034 |
| Base Year | 2025 |
| Estimated Year | 2026 |
| Forecast Period | 2026-2034 |
| Historical Period | 2020-2025 |
| Growth Rate | CAGR of 12.12% from 2020-2034 |
| Segmentation |
|
Table of Contents
- 1. Introduction
- 1.1. Research Scope
- 1.2. Market Segmentation
- 1.3. Research Objective
- 1.4. Definitions and Assumptions
- 2. Executive Summary
- 2.1. Market Snapshot
- 3. Market Dynamics
- 3.1. Market Drivers
- 3.2. Market Restrains
- 3.3. Market Trends
- 3.4. Market Opportunities
- 4. Market Factor Analysis
- 4.1. Porters Five Forces
- 4.1.1. Bargaining Power of Suppliers
- 4.1.2. Bargaining Power of Buyers
- 4.1.3. Threat of New Entrants
- 4.1.4. Threat of Substitutes
- 4.1.5. Competitive Rivalry
- 4.2. PESTEL analysis
- 4.3. BCG Analysis
- 4.3.1. Stars (High Growth, High Market Share)
- 4.3.2. Cash Cows (Low Growth, High Market Share)
- 4.3.3. Question Mark (High Growth, Low Market Share)
- 4.3.4. Dogs (Low Growth, Low Market Share)
- 4.4. Ansoff Matrix Analysis
- 4.5. Supply Chain Analysis
- 4.6. Regulatory Landscape
- 4.7. Current Market Potential and Opportunity Assessment (TAM–SAM–SOM Framework)
- 4.8. PRI Analyst Note
- 4.1. Porters Five Forces
- 5. Market Analysis, Insights and Forecast 2021-2033
- 5.1. Market Analysis, Insights and Forecast - by Implementation Model
- 5.1.1. Centralized/Consolidated Models
- 5.1.2. Decentralized/Federated Models
- 5.1.3. Hybrid Model
- 5.2. Market Analysis, Insights and Forecast - by Setup Type
- 5.2.1. Private
- 5.2.2. Public
- 5.3. Market Analysis, Insights and Forecast - by Application
- 5.3.1. Internal Interfacing
- 5.3.2. Secure Messaging
- 5.3.3. Workflow Management
- 5.3.4. Web Portal Development
- 5.3.5. Patient Safety
- 5.4. Market Analysis, Insights and Forecast - by Exchange Type
- 5.4.1. Direct Exchange
- 5.4.2. Query-based Exchange
- 5.4.3. Consumer-mediated Exchange
- 5.5. Market Analysis, Insights and Forecast - by Component
- 5.5.1. Enterprise Master Person Index (EMPI)
- 5.5.2. Healthcare Provider Directory (HPD)
- 5.5.3. Record Locator Service (RLS)
- 5.5.4. Clinical Data Repository
- 5.5.5. Other Components
- 5.6. Market Analysis, Insights and Forecast - by Region
- 5.6.1. North America
- 5.6.2. South America
- 5.6.3. Europe
- 5.6.4. Middle East & Africa
- 5.6.5. Asia Pacific
- 5.1. Market Analysis, Insights and Forecast - by Implementation Model
- 6. Global US Health Information Exchange Industry Analysis, Insights and Forecast, 2021-2033
- 6.1. Market Analysis, Insights and Forecast - by Implementation Model
- 6.1.1. Centralized/Consolidated Models
- 6.1.2. Decentralized/Federated Models
- 6.1.3. Hybrid Model
- 6.2. Market Analysis, Insights and Forecast - by Setup Type
- 6.2.1. Private
- 6.2.2. Public
- 6.3. Market Analysis, Insights and Forecast - by Application
- 6.3.1. Internal Interfacing
- 6.3.2. Secure Messaging
- 6.3.3. Workflow Management
- 6.3.4. Web Portal Development
- 6.3.5. Patient Safety
- 6.4. Market Analysis, Insights and Forecast - by Exchange Type
- 6.4.1. Direct Exchange
- 6.4.2. Query-based Exchange
- 6.4.3. Consumer-mediated Exchange
- 6.5. Market Analysis, Insights and Forecast - by Component
- 6.5.1. Enterprise Master Person Index (EMPI)
- 6.5.2. Healthcare Provider Directory (HPD)
- 6.5.3. Record Locator Service (RLS)
- 6.5.4. Clinical Data Repository
- 6.5.5. Other Components
- 6.1. Market Analysis, Insights and Forecast - by Implementation Model
- 7. North America US Health Information Exchange Industry Analysis, Insights and Forecast, 2020-2032
- 7.1. Market Analysis, Insights and Forecast - by Implementation Model
- 7.1.1. Centralized/Consolidated Models
- 7.1.2. Decentralized/Federated Models
- 7.1.3. Hybrid Model
- 7.2. Market Analysis, Insights and Forecast - by Setup Type
- 7.2.1. Private
- 7.2.2. Public
- 7.3. Market Analysis, Insights and Forecast - by Application
- 7.3.1. Internal Interfacing
- 7.3.2. Secure Messaging
- 7.3.3. Workflow Management
- 7.3.4. Web Portal Development
- 7.3.5. Patient Safety
- 7.4. Market Analysis, Insights and Forecast - by Exchange Type
- 7.4.1. Direct Exchange
- 7.4.2. Query-based Exchange
- 7.4.3. Consumer-mediated Exchange
- 7.5. Market Analysis, Insights and Forecast - by Component
- 7.5.1. Enterprise Master Person Index (EMPI)
- 7.5.2. Healthcare Provider Directory (HPD)
- 7.5.3. Record Locator Service (RLS)
- 7.5.4. Clinical Data Repository
- 7.5.5. Other Components
- 7.1. Market Analysis, Insights and Forecast - by Implementation Model
- 8. South America US Health Information Exchange Industry Analysis, Insights and Forecast, 2020-2032
- 8.1. Market Analysis, Insights and Forecast - by Implementation Model
- 8.1.1. Centralized/Consolidated Models
- 8.1.2. Decentralized/Federated Models
- 8.1.3. Hybrid Model
- 8.2. Market Analysis, Insights and Forecast - by Setup Type
- 8.2.1. Private
- 8.2.2. Public
- 8.3. Market Analysis, Insights and Forecast - by Application
- 8.3.1. Internal Interfacing
- 8.3.2. Secure Messaging
- 8.3.3. Workflow Management
- 8.3.4. Web Portal Development
- 8.3.5. Patient Safety
- 8.4. Market Analysis, Insights and Forecast - by Exchange Type
- 8.4.1. Direct Exchange
- 8.4.2. Query-based Exchange
- 8.4.3. Consumer-mediated Exchange
- 8.5. Market Analysis, Insights and Forecast - by Component
- 8.5.1. Enterprise Master Person Index (EMPI)
- 8.5.2. Healthcare Provider Directory (HPD)
- 8.5.3. Record Locator Service (RLS)
- 8.5.4. Clinical Data Repository
- 8.5.5. Other Components
- 8.1. Market Analysis, Insights and Forecast - by Implementation Model
- 9. Europe US Health Information Exchange Industry Analysis, Insights and Forecast, 2020-2032
- 9.1. Market Analysis, Insights and Forecast - by Implementation Model
- 9.1.1. Centralized/Consolidated Models
- 9.1.2. Decentralized/Federated Models
- 9.1.3. Hybrid Model
- 9.2. Market Analysis, Insights and Forecast - by Setup Type
- 9.2.1. Private
- 9.2.2. Public
- 9.3. Market Analysis, Insights and Forecast - by Application
- 9.3.1. Internal Interfacing
- 9.3.2. Secure Messaging
- 9.3.3. Workflow Management
- 9.3.4. Web Portal Development
- 9.3.5. Patient Safety
- 9.4. Market Analysis, Insights and Forecast - by Exchange Type
- 9.4.1. Direct Exchange
- 9.4.2. Query-based Exchange
- 9.4.3. Consumer-mediated Exchange
- 9.5. Market Analysis, Insights and Forecast - by Component
- 9.5.1. Enterprise Master Person Index (EMPI)
- 9.5.2. Healthcare Provider Directory (HPD)
- 9.5.3. Record Locator Service (RLS)
- 9.5.4. Clinical Data Repository
- 9.5.5. Other Components
- 9.1. Market Analysis, Insights and Forecast - by Implementation Model
- 10. Middle East & Africa US Health Information Exchange Industry Analysis, Insights and Forecast, 2020-2032
- 10.1. Market Analysis, Insights and Forecast - by Implementation Model
- 10.1.1. Centralized/Consolidated Models
- 10.1.2. Decentralized/Federated Models
- 10.1.3. Hybrid Model
- 10.2. Market Analysis, Insights and Forecast - by Setup Type
- 10.2.1. Private
- 10.2.2. Public
- 10.3. Market Analysis, Insights and Forecast - by Application
- 10.3.1. Internal Interfacing
- 10.3.2. Secure Messaging
- 10.3.3. Workflow Management
- 10.3.4. Web Portal Development
- 10.3.5. Patient Safety
- 10.4. Market Analysis, Insights and Forecast - by Exchange Type
- 10.4.1. Direct Exchange
- 10.4.2. Query-based Exchange
- 10.4.3. Consumer-mediated Exchange
- 10.5. Market Analysis, Insights and Forecast - by Component
- 10.5.1. Enterprise Master Person Index (EMPI)
- 10.5.2. Healthcare Provider Directory (HPD)
- 10.5.3. Record Locator Service (RLS)
- 10.5.4. Clinical Data Repository
- 10.5.5. Other Components
- 10.1. Market Analysis, Insights and Forecast - by Implementation Model
- 11. Asia Pacific US Health Information Exchange Industry Analysis, Insights and Forecast, 2020-2032
- 11.1. Market Analysis, Insights and Forecast - by Implementation Model
- 11.1.1. Centralized/Consolidated Models
- 11.1.2. Decentralized/Federated Models
- 11.1.3. Hybrid Model
- 11.2. Market Analysis, Insights and Forecast - by Setup Type
- 11.2.1. Private
- 11.2.2. Public
- 11.3. Market Analysis, Insights and Forecast - by Application
- 11.3.1. Internal Interfacing
- 11.3.2. Secure Messaging
- 11.3.3. Workflow Management
- 11.3.4. Web Portal Development
- 11.3.5. Patient Safety
- 11.4. Market Analysis, Insights and Forecast - by Exchange Type
- 11.4.1. Direct Exchange
- 11.4.2. Query-based Exchange
- 11.4.3. Consumer-mediated Exchange
- 11.5. Market Analysis, Insights and Forecast - by Component
- 11.5.1. Enterprise Master Person Index (EMPI)
- 11.5.2. Healthcare Provider Directory (HPD)
- 11.5.3. Record Locator Service (RLS)
- 11.5.4. Clinical Data Repository
- 11.5.5. Other Components
- 11.1. Market Analysis, Insights and Forecast - by Implementation Model
- 12. Competitive Analysis
- 12.1. Company Profiles
- 12.1.1 Eclinical Works
- 12.1.1.1. Company Overview
- 12.1.1.2. Products
- 12.1.1.3. Company Financials
- 12.1.1.4. SWOT Analysis
- 12.1.2 Mckesson Corporation
- 12.1.2.1. Company Overview
- 12.1.2.2. Products
- 12.1.2.3. Company Financials
- 12.1.2.4. SWOT Analysis
- 12.1.3 Infor Inc
- 12.1.3.1. Company Overview
- 12.1.3.2. Products
- 12.1.3.3. Company Financials
- 12.1.3.4. SWOT Analysis
- 12.1.4 Epic Corporation Inc
- 12.1.4.1. Company Overview
- 12.1.4.2. Products
- 12.1.4.3. Company Financials
- 12.1.4.4. SWOT Analysis
- 12.1.5 mpro
- 12.1.5.1. Company Overview
- 12.1.5.2. Products
- 12.1.5.3. Company Financials
- 12.1.5.4. SWOT Analysis
- 12.1.6 Cerner Corporation
- 12.1.6.1. Company Overview
- 12.1.6.2. Products
- 12.1.6.3. Company Financials
- 12.1.6.4. SWOT Analysis
- 12.1.7 Optum Inc
- 12.1.7.1. Company Overview
- 12.1.7.2. Products
- 12.1.7.3. Company Financials
- 12.1.7.4. SWOT Analysis
- 12.1.8 Allscripts Healthcare Solutions Inc
- 12.1.8.1. Company Overview
- 12.1.8.2. Products
- 12.1.8.3. Company Financials
- 12.1.8.4. SWOT Analysis
- 12.1.9 Nextgen Healthcare Information Systems LLC
- 12.1.9.1. Company Overview
- 12.1.9.2. Products
- 12.1.9.3. Company Financials
- 12.1.9.4. SWOT Analysis
- 12.1.10 Newgen Software Technologies
- 12.1.10.1. Company Overview
- 12.1.10.2. Products
- 12.1.10.3. Company Financials
- 12.1.10.4. SWOT Analysis
- 12.1.11 Conifer Health Solutions
- 12.1.11.1. Company Overview
- 12.1.11.2. Products
- 12.1.11.3. Company Financials
- 12.1.11.4. SWOT Analysis
- 12.1.12 Medicity Inc
- 12.1.12.1. Company Overview
- 12.1.12.2. Products
- 12.1.12.3. Company Financials
- 12.1.12.4. SWOT Analysis
- 12.1.1 Eclinical Works
- 12.2. Market Entropy
- 12.2.1 Company's Key Areas Served
- 12.2.2 Recent Developments
- 12.3. Company Market Share Analysis 2025
- 12.3.1 Top 5 Companies Market Share Analysis
- 12.3.2 Top 3 Companies Market Share Analysis
- 12.4. List of Potential Customers
- 13. Research Methodology
List of Figures
- Figure 1: Global US Health Information Exchange Industry Revenue Breakdown (Million, %) by Region 2025 & 2033
- Figure 2: North America US Health Information Exchange Industry Revenue (Million), by Implementation Model 2025 & 2033
- Figure 3: North America US Health Information Exchange Industry Revenue Share (%), by Implementation Model 2025 & 2033
- Figure 4: North America US Health Information Exchange Industry Revenue (Million), by Setup Type 2025 & 2033
- Figure 5: North America US Health Information Exchange Industry Revenue Share (%), by Setup Type 2025 & 2033
- Figure 6: North America US Health Information Exchange Industry Revenue (Million), by Application 2025 & 2033
- Figure 7: North America US Health Information Exchange Industry Revenue Share (%), by Application 2025 & 2033
- Figure 8: North America US Health Information Exchange Industry Revenue (Million), by Exchange Type 2025 & 2033
- Figure 9: North America US Health Information Exchange Industry Revenue Share (%), by Exchange Type 2025 & 2033
- Figure 10: North America US Health Information Exchange Industry Revenue (Million), by Component 2025 & 2033
- Figure 11: North America US Health Information Exchange Industry Revenue Share (%), by Component 2025 & 2033
- Figure 12: North America US Health Information Exchange Industry Revenue (Million), by Country 2025 & 2033
- Figure 13: North America US Health Information Exchange Industry Revenue Share (%), by Country 2025 & 2033
- Figure 14: South America US Health Information Exchange Industry Revenue (Million), by Implementation Model 2025 & 2033
- Figure 15: South America US Health Information Exchange Industry Revenue Share (%), by Implementation Model 2025 & 2033
- Figure 16: South America US Health Information Exchange Industry Revenue (Million), by Setup Type 2025 & 2033
- Figure 17: South America US Health Information Exchange Industry Revenue Share (%), by Setup Type 2025 & 2033
- Figure 18: South America US Health Information Exchange Industry Revenue (Million), by Application 2025 & 2033
- Figure 19: South America US Health Information Exchange Industry Revenue Share (%), by Application 2025 & 2033
- Figure 20: South America US Health Information Exchange Industry Revenue (Million), by Exchange Type 2025 & 2033
- Figure 21: South America US Health Information Exchange Industry Revenue Share (%), by Exchange Type 2025 & 2033
- Figure 22: South America US Health Information Exchange Industry Revenue (Million), by Component 2025 & 2033
- Figure 23: South America US Health Information Exchange Industry Revenue Share (%), by Component 2025 & 2033
- Figure 24: South America US Health Information Exchange Industry Revenue (Million), by Country 2025 & 2033
- Figure 25: South America US Health Information Exchange Industry Revenue Share (%), by Country 2025 & 2033
- Figure 26: Europe US Health Information Exchange Industry Revenue (Million), by Implementation Model 2025 & 2033
- Figure 27: Europe US Health Information Exchange Industry Revenue Share (%), by Implementation Model 2025 & 2033
- Figure 28: Europe US Health Information Exchange Industry Revenue (Million), by Setup Type 2025 & 2033
- Figure 29: Europe US Health Information Exchange Industry Revenue Share (%), by Setup Type 2025 & 2033
- Figure 30: Europe US Health Information Exchange Industry Revenue (Million), by Application 2025 & 2033
- Figure 31: Europe US Health Information Exchange Industry Revenue Share (%), by Application 2025 & 2033
- Figure 32: Europe US Health Information Exchange Industry Revenue (Million), by Exchange Type 2025 & 2033
- Figure 33: Europe US Health Information Exchange Industry Revenue Share (%), by Exchange Type 2025 & 2033
- Figure 34: Europe US Health Information Exchange Industry Revenue (Million), by Component 2025 & 2033
- Figure 35: Europe US Health Information Exchange Industry Revenue Share (%), by Component 2025 & 2033
- Figure 36: Europe US Health Information Exchange Industry Revenue (Million), by Country 2025 & 2033
- Figure 37: Europe US Health Information Exchange Industry Revenue Share (%), by Country 2025 & 2033
- Figure 38: Middle East & Africa US Health Information Exchange Industry Revenue (Million), by Implementation Model 2025 & 2033
- Figure 39: Middle East & Africa US Health Information Exchange Industry Revenue Share (%), by Implementation Model 2025 & 2033
- Figure 40: Middle East & Africa US Health Information Exchange Industry Revenue (Million), by Setup Type 2025 & 2033
- Figure 41: Middle East & Africa US Health Information Exchange Industry Revenue Share (%), by Setup Type 2025 & 2033
- Figure 42: Middle East & Africa US Health Information Exchange Industry Revenue (Million), by Application 2025 & 2033
- Figure 43: Middle East & Africa US Health Information Exchange Industry Revenue Share (%), by Application 2025 & 2033
- Figure 44: Middle East & Africa US Health Information Exchange Industry Revenue (Million), by Exchange Type 2025 & 2033
- Figure 45: Middle East & Africa US Health Information Exchange Industry Revenue Share (%), by Exchange Type 2025 & 2033
- Figure 46: Middle East & Africa US Health Information Exchange Industry Revenue (Million), by Component 2025 & 2033
- Figure 47: Middle East & Africa US Health Information Exchange Industry Revenue Share (%), by Component 2025 & 2033
- Figure 48: Middle East & Africa US Health Information Exchange Industry Revenue (Million), by Country 2025 & 2033
- Figure 49: Middle East & Africa US Health Information Exchange Industry Revenue Share (%), by Country 2025 & 2033
- Figure 50: Asia Pacific US Health Information Exchange Industry Revenue (Million), by Implementation Model 2025 & 2033
- Figure 51: Asia Pacific US Health Information Exchange Industry Revenue Share (%), by Implementation Model 2025 & 2033
- Figure 52: Asia Pacific US Health Information Exchange Industry Revenue (Million), by Setup Type 2025 & 2033
- Figure 53: Asia Pacific US Health Information Exchange Industry Revenue Share (%), by Setup Type 2025 & 2033
- Figure 54: Asia Pacific US Health Information Exchange Industry Revenue (Million), by Application 2025 & 2033
- Figure 55: Asia Pacific US Health Information Exchange Industry Revenue Share (%), by Application 2025 & 2033
- Figure 56: Asia Pacific US Health Information Exchange Industry Revenue (Million), by Exchange Type 2025 & 2033
- Figure 57: Asia Pacific US Health Information Exchange Industry Revenue Share (%), by Exchange Type 2025 & 2033
- Figure 58: Asia Pacific US Health Information Exchange Industry Revenue (Million), by Component 2025 & 2033
- Figure 59: Asia Pacific US Health Information Exchange Industry Revenue Share (%), by Component 2025 & 2033
- Figure 60: Asia Pacific US Health Information Exchange Industry Revenue (Million), by Country 2025 & 2033
- Figure 61: Asia Pacific US Health Information Exchange Industry Revenue Share (%), by Country 2025 & 2033
List of Tables
- Table 1: Global US Health Information Exchange Industry Revenue Million Forecast, by Implementation Model 2020 & 2033
- Table 2: Global US Health Information Exchange Industry Revenue Million Forecast, by Setup Type 2020 & 2033
- Table 3: Global US Health Information Exchange Industry Revenue Million Forecast, by Application 2020 & 2033
- Table 4: Global US Health Information Exchange Industry Revenue Million Forecast, by Exchange Type 2020 & 2033
- Table 5: Global US Health Information Exchange Industry Revenue Million Forecast, by Component 2020 & 2033
- Table 6: Global US Health Information Exchange Industry Revenue Million Forecast, by Region 2020 & 2033
- Table 7: Global US Health Information Exchange Industry Revenue Million Forecast, by Implementation Model 2020 & 2033
- Table 8: Global US Health Information Exchange Industry Revenue Million Forecast, by Setup Type 2020 & 2033
- Table 9: Global US Health Information Exchange Industry Revenue Million Forecast, by Application 2020 & 2033
- Table 10: Global US Health Information Exchange Industry Revenue Million Forecast, by Exchange Type 2020 & 2033
- Table 11: Global US Health Information Exchange Industry Revenue Million Forecast, by Component 2020 & 2033
- Table 12: Global US Health Information Exchange Industry Revenue Million Forecast, by Country 2020 & 2033
- Table 13: United States US Health Information Exchange Industry Revenue (Million) Forecast, by Application 2020 & 2033
- Table 14: Canada US Health Information Exchange Industry Revenue (Million) Forecast, by Application 2020 & 2033
- Table 15: Mexico US Health Information Exchange Industry Revenue (Million) Forecast, by Application 2020 & 2033
- Table 16: Global US Health Information Exchange Industry Revenue Million Forecast, by Implementation Model 2020 & 2033
- Table 17: Global US Health Information Exchange Industry Revenue Million Forecast, by Setup Type 2020 & 2033
- Table 18: Global US Health Information Exchange Industry Revenue Million Forecast, by Application 2020 & 2033
- Table 19: Global US Health Information Exchange Industry Revenue Million Forecast, by Exchange Type 2020 & 2033
- Table 20: Global US Health Information Exchange Industry Revenue Million Forecast, by Component 2020 & 2033
- Table 21: Global US Health Information Exchange Industry Revenue Million Forecast, by Country 2020 & 2033
- Table 22: Brazil US Health Information Exchange Industry Revenue (Million) Forecast, by Application 2020 & 2033
- Table 23: Argentina US Health Information Exchange Industry Revenue (Million) Forecast, by Application 2020 & 2033
- Table 24: Rest of South America US Health Information Exchange Industry Revenue (Million) Forecast, by Application 2020 & 2033
- Table 25: Global US Health Information Exchange Industry Revenue Million Forecast, by Implementation Model 2020 & 2033
- Table 26: Global US Health Information Exchange Industry Revenue Million Forecast, by Setup Type 2020 & 2033
- Table 27: Global US Health Information Exchange Industry Revenue Million Forecast, by Application 2020 & 2033
- Table 28: Global US Health Information Exchange Industry Revenue Million Forecast, by Exchange Type 2020 & 2033
- Table 29: Global US Health Information Exchange Industry Revenue Million Forecast, by Component 2020 & 2033
- Table 30: Global US Health Information Exchange Industry Revenue Million Forecast, by Country 2020 & 2033
- Table 31: United Kingdom US Health Information Exchange Industry Revenue (Million) Forecast, by Application 2020 & 2033
- Table 32: Germany US Health Information Exchange Industry Revenue (Million) Forecast, by Application 2020 & 2033
- Table 33: France US Health Information Exchange Industry Revenue (Million) Forecast, by Application 2020 & 2033
- Table 34: Italy US Health Information Exchange Industry Revenue (Million) Forecast, by Application 2020 & 2033
- Table 35: Spain US Health Information Exchange Industry Revenue (Million) Forecast, by Application 2020 & 2033
- Table 36: Russia US Health Information Exchange Industry Revenue (Million) Forecast, by Application 2020 & 2033
- Table 37: Benelux US Health Information Exchange Industry Revenue (Million) Forecast, by Application 2020 & 2033
- Table 38: Nordics US Health Information Exchange Industry Revenue (Million) Forecast, by Application 2020 & 2033
- Table 39: Rest of Europe US Health Information Exchange Industry Revenue (Million) Forecast, by Application 2020 & 2033
- Table 40: Global US Health Information Exchange Industry Revenue Million Forecast, by Implementation Model 2020 & 2033
- Table 41: Global US Health Information Exchange Industry Revenue Million Forecast, by Setup Type 2020 & 2033
- Table 42: Global US Health Information Exchange Industry Revenue Million Forecast, by Application 2020 & 2033
- Table 43: Global US Health Information Exchange Industry Revenue Million Forecast, by Exchange Type 2020 & 2033
- Table 44: Global US Health Information Exchange Industry Revenue Million Forecast, by Component 2020 & 2033
- Table 45: Global US Health Information Exchange Industry Revenue Million Forecast, by Country 2020 & 2033
- Table 46: Turkey US Health Information Exchange Industry Revenue (Million) Forecast, by Application 2020 & 2033
- Table 47: Israel US Health Information Exchange Industry Revenue (Million) Forecast, by Application 2020 & 2033
- Table 48: GCC US Health Information Exchange Industry Revenue (Million) Forecast, by Application 2020 & 2033
- Table 49: North Africa US Health Information Exchange Industry Revenue (Million) Forecast, by Application 2020 & 2033
- Table 50: South Africa US Health Information Exchange Industry Revenue (Million) Forecast, by Application 2020 & 2033
- Table 51: Rest of Middle East & Africa US Health Information Exchange Industry Revenue (Million) Forecast, by Application 2020 & 2033
- Table 52: Global US Health Information Exchange Industry Revenue Million Forecast, by Implementation Model 2020 & 2033
- Table 53: Global US Health Information Exchange Industry Revenue Million Forecast, by Setup Type 2020 & 2033
- Table 54: Global US Health Information Exchange Industry Revenue Million Forecast, by Application 2020 & 2033
- Table 55: Global US Health Information Exchange Industry Revenue Million Forecast, by Exchange Type 2020 & 2033
- Table 56: Global US Health Information Exchange Industry Revenue Million Forecast, by Component 2020 & 2033
- Table 57: Global US Health Information Exchange Industry Revenue Million Forecast, by Country 2020 & 2033
- Table 58: China US Health Information Exchange Industry Revenue (Million) Forecast, by Application 2020 & 2033
- Table 59: India US Health Information Exchange Industry Revenue (Million) Forecast, by Application 2020 & 2033
- Table 60: Japan US Health Information Exchange Industry Revenue (Million) Forecast, by Application 2020 & 2033
- Table 61: South Korea US Health Information Exchange Industry Revenue (Million) Forecast, by Application 2020 & 2033
- Table 62: ASEAN US Health Information Exchange Industry Revenue (Million) Forecast, by Application 2020 & 2033
- Table 63: Oceania US Health Information Exchange Industry Revenue (Million) Forecast, by Application 2020 & 2033
- Table 64: Rest of Asia Pacific US Health Information Exchange Industry Revenue (Million) Forecast, by Application 2020 & 2033
Frequently Asked Questions
1. What is the projected Compound Annual Growth Rate (CAGR) of the US Health Information Exchange Industry?
The projected CAGR is approximately 12.12%.
2. Which companies are prominent players in the US Health Information Exchange Industry?
Key companies in the market include Eclinical Works, Mckesson Corporation, Infor Inc, Epic Corporation Inc, mpro, Cerner Corporation, Optum Inc, Allscripts Healthcare Solutions Inc, Nextgen Healthcare Information Systems LLC, Newgen Software Technologies, Conifer Health Solutions, Medicity Inc.
3. What are the main segments of the US Health Information Exchange Industry?
The market segments include Implementation Model, Setup Type, Application, Exchange Type, Component.
4. Can you provide details about the market size?
The market size is estimated to be USD 0.66 Million as of 2022.
5. What are some drivers contributing to market growth?
Increasing Demand for Electronic Health Records Resulting in the Expansion of the Market; Government Support via Various Programs and Incentives; Reduction in Healthcare Cost and Improved Efficacy.
6. What are the notable trends driving market growth?
The Decentralized/Federated Model is Expected to Hold a Notable Market Share Over the Forecast Period.
7. Are there any restraints impacting market growth?
Huge Initial Infrastructural Investment and Slow Return on Investment; Data Privacy and Security Concerns.
8. Can you provide examples of recent developments in the market?
In October 2022, Mpowered Health launched its xChange, the United States consumer-mediated healthcare data exchange. The exchange enables health plans, health systems, and other healthcare organizations to request and obtain medical records from consumers with their consent.
9. What pricing options are available for accessing the report?
Pricing options include single-user, multi-user, and enterprise licenses priced at USD 3800, USD 4500, and USD 5800 respectively.
10. Is the market size provided in terms of value or volume?
The market size is provided in terms of value, measured in Million.
11. Are there any specific market keywords associated with the report?
Yes, the market keyword associated with the report is "US Health Information Exchange Industry," which aids in identifying and referencing the specific market segment covered.
12. How do I determine which pricing option suits my needs best?
The pricing options vary based on user requirements and access needs. Individual users may opt for single-user licenses, while businesses requiring broader access may choose multi-user or enterprise licenses for cost-effective access to the report.
13. Are there any additional resources or data provided in the US Health Information Exchange Industry report?
While the report offers comprehensive insights, it's advisable to review the specific contents or supplementary materials provided to ascertain if additional resources or data are available.
14. How can I stay updated on further developments or reports in the US Health Information Exchange Industry?
To stay informed about further developments, trends, and reports in the US Health Information Exchange Industry, consider subscribing to industry newsletters, following relevant companies and organizations, or regularly checking reputable industry news sources and publications.
Methodology
Step 1 - Identification of Relevant Samples Size from Population Database


Step 2 - Approaches for Defining Global Market Size (Value, Volume* & Price*)

Note*: In applicable scenarios
Step 3 - Data Sources
Primary Research
- Web Analytics
- Survey Reports
- Research Institute
- Latest Research Reports
- Opinion Leaders
Secondary Research
- Annual Reports
- White Paper
- Latest Press Release
- Industry Association
- Paid Database
- Investor Presentations

Step 4 - Data Triangulation
Involves using different sources of information in order to increase the validity of a study
These sources are likely to be stakeholders in a program - participants, other researchers, program staff, other community members, and so on.
Then we put all data in single framework & apply various statistical tools to find out the dynamic on the market.
During the analysis stage, feedback from the stakeholder groups would be compared to determine areas of agreement as well as areas of divergence