Key Insights
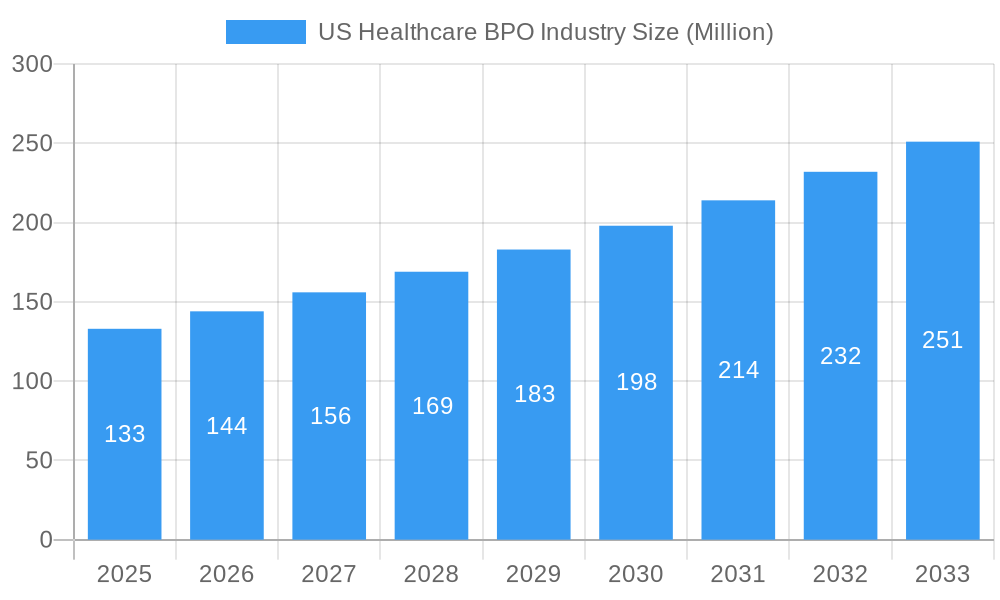
The US healthcare BPO market, valued at $133 million in 2025, is projected to experience robust growth, driven by a confluence of factors. The increasing complexity of healthcare regulations, coupled with the rising demand for cost-effective and efficient administrative processes, is fueling the outsourcing of various functions to specialized BPO providers. Key drivers include the need for enhanced patient engagement, improved revenue cycle management, and streamlined pharmaceutical operations. Trends such as the adoption of advanced analytics, cloud-based solutions, and automation are further accelerating market expansion. While data security concerns and integration challenges represent potential restraints, the overall outlook remains positive, with a projected Compound Annual Growth Rate (CAGR) of 8.11% from 2025 to 2033. This growth is expected across all segments, including patient enrollment services, patient care, revenue cycle management, pharmaceutical R&D and manufacturing support, and payer services (claims management, CRM, and operational management). The significant market share held by established players like Accenture, Cognizant, and UnitedHealth Group reflects the industry's maturity and the importance of established expertise. However, smaller, specialized providers are also finding niches within specific service offerings. The geographic distribution is expected to remain concentrated in the United States, with regional variations potentially influenced by healthcare infrastructure and regulatory landscapes.
US Healthcare BPO Industry Market Size (In Million)
The diverse range of services offered within the US healthcare BPO sector caters to the multifaceted needs of providers and payers. The increasing adoption of value-based care models further necessitates efficient back-office operations and data analytics, driving demand for sophisticated BPO solutions. Market growth will likely be influenced by advancements in technology, particularly AI and machine learning, which can automate processes, improve accuracy, and enhance decision-making. Furthermore, the ongoing consolidation within the healthcare industry could lead to larger-scale outsourcing contracts and further market concentration. While challenges related to workforce training and talent acquisition remain, the long-term outlook for the US healthcare BPO industry suggests significant growth potential, driven by the enduring need for cost optimization, efficiency gains, and technological advancements within the healthcare sector.
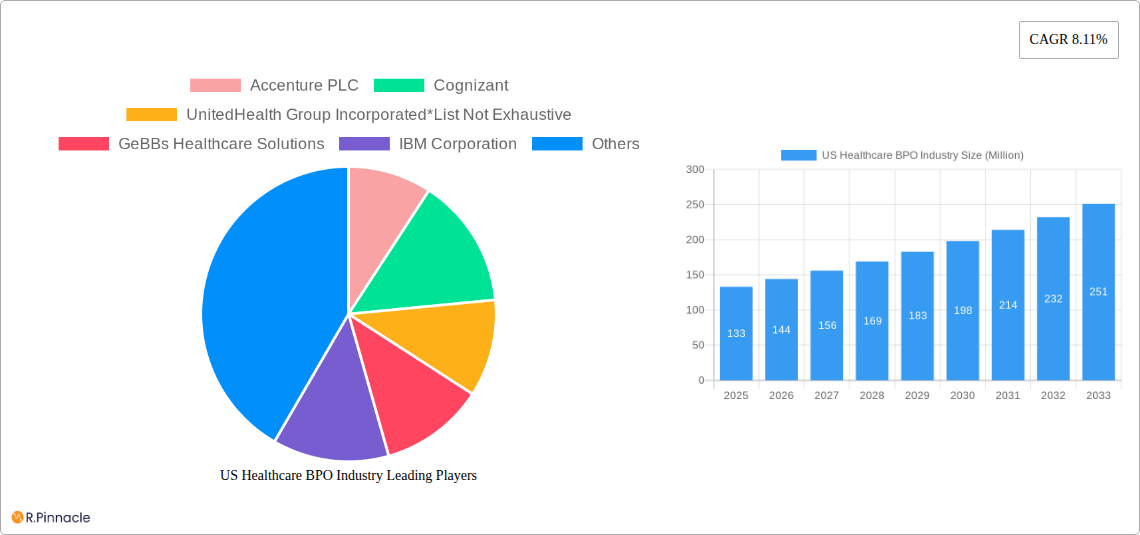
US Healthcare BPO Industry Company Market Share
US Healthcare BPO Industry: A Comprehensive Market Report (2019-2033)
This in-depth report provides a comprehensive analysis of the US Healthcare Business Process Outsourcing (BPO) industry, offering invaluable insights for industry professionals, investors, and strategic decision-makers. The study covers the period from 2019 to 2033, with a focus on the 2025-2033 forecast period. The report leverages extensive data analysis to illuminate market dynamics, growth drivers, and emerging opportunities within this rapidly evolving sector.
US Healthcare BPO Industry Market Structure & Innovation Trends
The US Healthcare BPO market is characterized by a moderately concentrated structure, with several large players holding significant market share. Accenture PLC, Cognizant, and UnitedHealth Group Incorporated are among the leading players, although the market also includes numerous smaller, specialized firms like GeBBs Healthcare Solutions, IBM Corporation, Sutherland Healthcare Solutions, Parexel International, IQVIA, Capgemini, and Genpact Limited. Market share analysis reveals that the top 5 players account for approximately xx% of the market (2025 estimate). Innovation is driven primarily by advancements in healthcare technology, such as AI and machine learning, cloud computing, and the increasing adoption of digital health solutions. The regulatory landscape, including HIPAA compliance and data security regulations, significantly influences market operations. The industry experiences continuous M&A activity, with deal values exceeding $xx Million in recent years. For example, the March 2022 acquisition of Healthcare Resource Group Inc. by CPSI demonstrates the ongoing consolidation within the RCM segment. Substitute products, such as in-house healthcare administration, pose a competitive challenge, particularly for smaller BPO providers. Finally, the demographics of end-users – hospitals, clinics, pharmaceutical companies, and payers – significantly impact service demand and market segmentation.
- Market Concentration: Top 5 players hold approximately xx% market share (2025).
- Innovation Drivers: AI, machine learning, cloud computing, digital health solutions.
- M&A Activity: Total deal value exceeding $xx Million in recent years.
- Regulatory Framework: HIPAA compliance, data security regulations.
- End-User Demographics: Hospitals, clinics, pharmaceutical companies, payers.
US Healthcare BPO Industry Market Dynamics & Trends
The US Healthcare BPO market is experiencing robust growth, driven by several key factors. The increasing demand for cost-effective healthcare solutions, coupled with a growing need for efficient administrative and operational support, fuels market expansion. Technological advancements, particularly in areas like AI-powered automation and cloud-based solutions, are streamlining processes and increasing efficiency. Consumer preferences, particularly the demand for personalized and seamless healthcare experiences, are further driving the market. The competitive landscape is characterized by intense rivalry among established players and emerging entrants, leading to continuous innovation and service diversification. The market is projected to grow at a CAGR of xx% during the forecast period (2025-2033), reaching a market size of $xx Million by 2033. Market penetration within various segments is also expanding as awareness of BPO's benefits increases among healthcare providers and payers.
Dominant Regions & Segments in US Healthcare BPO Industry
The US Healthcare BPO market is geographically diverse, with significant activity across various regions. However, the Northeast and West Coast regions currently demonstrate the strongest market presence due to higher concentrations of healthcare providers and pharmaceutical companies. Revenue Cycle Management (RCM) within the Provider Services segment is a dominant sector, driven by the ongoing need to optimize billing and collections processes for increased efficiency and profitability. Within Payer Services, Claims Management and Customer Relationship Management (CRM) show high growth potential because of rising insurance enrollment and increasing expectations for excellent customer experiences.
- Key Drivers (RCM): Increasing regulatory scrutiny, complex billing procedures, need for improved operational efficiency.
- Key Drivers (Claims Management): Rising insurance claims volumes, stringent regulatory compliance requirements, focus on fraud prevention.
- Key Drivers (CRM): Increasing patient expectations for personalized care, need for enhanced communication channels, importance of customer loyalty.
US Healthcare BPO Industry Product Innovations
Recent product innovations in the US Healthcare BPO industry focus on integrating advanced technologies to enhance efficiency and improve outcomes. AI-powered solutions automate tasks such as claims processing and patient enrollment, while cloud-based platforms enable seamless data sharing and collaboration. These innovations deliver improved cost-effectiveness, reduced operational bottlenecks, and enhanced patient experience, significantly improving market fit and creating a competitive advantage for providers.
Report Scope & Segmentation Analysis
This report segments the US Healthcare BPO market by service type (Provider Services, Pharmaceutical Services, Payer Services) and further sub-segments within each category.
Provider Services: Patient Enrollment and Strategic Planning, Patient Care Service, Revenue Cycle Management. Each segment demonstrates significant growth potential, driven by factors such as increased patient volumes and the need for efficient operations. Market size projections vary across segments, with RCM currently holding the largest share.
Pharmaceutical Services: Research and Development, Manufacturing, Non-clinical Services. Growth is propelled by the pharmaceutical industry's focus on cost optimization and increased outsourcing of non-core activities.
Payer Services: Human Resource Management, Claims Management, Customer Relationship Management (CRM), Operational/Administrative Management, Care Management, Provider Management, Other Payer Services. The growth of this segment is driven by the increasing complexity of healthcare insurance and the growing need for efficient administrative and operational support.
Key Drivers of US Healthcare BPO Industry Growth
The US Healthcare BPO industry's growth is driven by a convergence of technological, economic, and regulatory factors. The increasing adoption of advanced technologies such as AI and machine learning enables automation of various processes, leading to cost reductions and efficiency gains. Economic pressures on healthcare providers and payers fuel the demand for cost-effective outsourcing solutions. Furthermore, stringent regulatory compliance requirements necessitate specialized expertise, pushing organizations to leverage the services of experienced BPO providers.
Challenges in the US Healthcare BPO Industry Sector
The US Healthcare BPO industry faces several challenges, including stringent regulatory compliance requirements (HIPAA), data security concerns, and maintaining the quality and consistency of services across diverse locations. Supply chain disruptions can also impact service delivery, and competitive pressures from both established players and new entrants create a dynamic and demanding landscape. These challenges can result in increased operational costs and potential disruptions to service delivery.
Emerging Opportunities in US Healthcare BPO Industry
Emerging opportunities within the US Healthcare BPO industry include expanding into new markets, particularly in underserved regions, and leveraging emerging technologies like blockchain and telehealth to deliver innovative solutions. Growing demand for specialized services, including data analytics and population health management, creates further expansion potential. Finally, the focus on value-based care presents opportunities for BPO providers to demonstrate their ability to improve outcomes and reduce costs.
Leading Players in the US Healthcare BPO Industry Market
- Accenture PLC
- Cognizant
- UnitedHealth Group Incorporated
- GeBBs Healthcare Solutions
- IBM Corporation
- Sutherland Healthcare Solutions
- Parexel International
- IQVIA
- Capgemini
- Genpact Limited
Key Developments in US Healthcare BPO Industry
May 2023: Atento recognized as a leader in Frost Radar for Customer Experience and Outsourcing services in Latin America. This highlights the growing importance of customer experience in the BPO industry and the global expansion of leading providers.
March 2022: CPSI's acquisition of Healthcare Resource Group Inc. strengthens CPSI's position in the RCM market and signifies the ongoing consolidation trend within the industry.
Future Outlook for US Healthcare BPO Industry Market
The future outlook for the US Healthcare BPO market is positive, with continued growth driven by technological advancements, increased demand for cost-effective healthcare solutions, and the rising adoption of value-based care models. Strategic opportunities exist for BPO providers to focus on specialized services, invest in cutting-edge technologies, and expand into new geographic markets. The market's overall growth potential remains strong, underpinned by the ongoing transformation of the healthcare industry.
US Healthcare BPO Industry Segmentation
-
1. Payer Service
- 1.1. Human Resource Management
- 1.2. Claims Management
- 1.3. Customer Relationship Management (CRM)
- 1.4. Operational/Administrative Management
- 1.5. Care Management
- 1.6. Provider Management
- 1.7. Other Payer Services
-
2. Pharmaceutical Service
- 2.1. Research and Development
- 2.2. Manufacturing
-
2.3. Non-clinical Services
- 2.3.1. Supply Chain Management and Logistics
- 2.3.2. Sales and Marketing Services
- 2.3.3. Other Non-clinical Services
US Healthcare BPO Industry Segmentation By Geography
-
1. North America
- 1.1. United States
- 1.2. Canada
- 1.3. Mexico
-
2. South America
- 2.1. Brazil
- 2.2. Argentina
- 2.3. Rest of South America
-
3. Europe
- 3.1. United Kingdom
- 3.2. Germany
- 3.3. France
- 3.4. Italy
- 3.5. Spain
- 3.6. Russia
- 3.7. Benelux
- 3.8. Nordics
- 3.9. Rest of Europe
-
4. Middle East & Africa
- 4.1. Turkey
- 4.2. Israel
- 4.3. GCC
- 4.4. North Africa
- 4.5. South Africa
- 4.6. Rest of Middle East & Africa
-
5. Asia Pacific
- 5.1. China
- 5.2. India
- 5.3. Japan
- 5.4. South Korea
- 5.5. ASEAN
- 5.6. Oceania
- 5.7. Rest of Asia Pacific
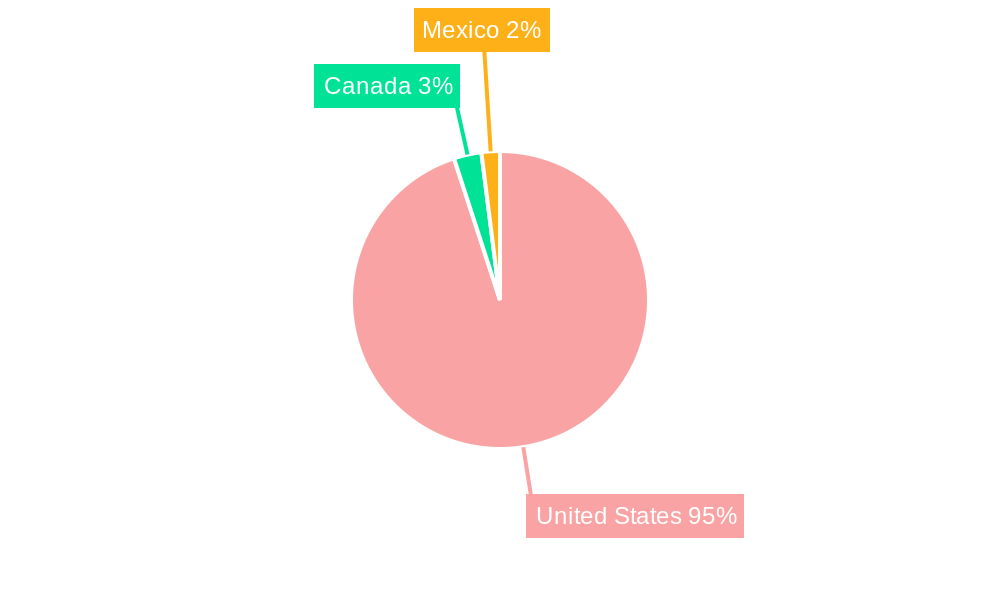
US Healthcare BPO Industry Regional Market Share
Geographic Coverage of US Healthcare BPO Industry
US Healthcare BPO Industry REPORT HIGHLIGHTS
| Aspects | Details |
|---|---|
| Study Period | 2020-2034 |
| Base Year | 2025 |
| Estimated Year | 2026 |
| Forecast Period | 2026-2034 |
| Historical Period | 2020-2025 |
| Growth Rate | CAGR of 8.11% from 2020-2034 |
| Segmentation |
|
Table of Contents
- 1. Introduction
- 1.1. Research Scope
- 1.2. Market Segmentation
- 1.3. Research Objective
- 1.4. Definitions and Assumptions
- 2. Executive Summary
- 2.1. Market Snapshot
- 3. Market Dynamics
- 3.1. Market Drivers
- 3.2. Market Restrains
- 3.3. Market Trends
- 3.4. Market Opportunities
- 4. Market Factor Analysis
- 4.1. Porters Five Forces
- 4.1.1. Bargaining Power of Suppliers
- 4.1.2. Bargaining Power of Buyers
- 4.1.3. Threat of New Entrants
- 4.1.4. Threat of Substitutes
- 4.1.5. Competitive Rivalry
- 4.2. PESTEL analysis
- 4.3. BCG Analysis
- 4.3.1. Stars (High Growth, High Market Share)
- 4.3.2. Cash Cows (Low Growth, High Market Share)
- 4.3.3. Question Mark (High Growth, Low Market Share)
- 4.3.4. Dogs (Low Growth, Low Market Share)
- 4.4. Ansoff Matrix Analysis
- 4.5. Supply Chain Analysis
- 4.6. Regulatory Landscape
- 4.7. Current Market Potential and Opportunity Assessment (TAM–SAM–SOM Framework)
- 4.8. PRI Analyst Note
- 4.1. Porters Five Forces
- 5. Market Analysis, Insights and Forecast 2021-2033
- 5.1. Market Analysis, Insights and Forecast - by Payer Service
- 5.1.1. Human Resource Management
- 5.1.2. Claims Management
- 5.1.3. Customer Relationship Management (CRM)
- 5.1.4. Operational/Administrative Management
- 5.1.5. Care Management
- 5.1.6. Provider Management
- 5.1.7. Other Payer Services
- 5.2. Market Analysis, Insights and Forecast - by Pharmaceutical Service
- 5.2.1. Research and Development
- 5.2.2. Manufacturing
- 5.2.3. Non-clinical Services
- 5.2.3.1. Supply Chain Management and Logistics
- 5.2.3.2. Sales and Marketing Services
- 5.2.3.3. Other Non-clinical Services
- 5.3. Market Analysis, Insights and Forecast - by Region
- 5.3.1. North America
- 5.3.2. South America
- 5.3.3. Europe
- 5.3.4. Middle East & Africa
- 5.3.5. Asia Pacific
- 5.1. Market Analysis, Insights and Forecast - by Payer Service
- 6. Global US Healthcare BPO Industry Analysis, Insights and Forecast, 2021-2033
- 6.1. Market Analysis, Insights and Forecast - by Payer Service
- 6.1.1. Human Resource Management
- 6.1.2. Claims Management
- 6.1.3. Customer Relationship Management (CRM)
- 6.1.4. Operational/Administrative Management
- 6.1.5. Care Management
- 6.1.6. Provider Management
- 6.1.7. Other Payer Services
- 6.2. Market Analysis, Insights and Forecast - by Pharmaceutical Service
- 6.2.1. Research and Development
- 6.2.2. Manufacturing
- 6.2.3. Non-clinical Services
- 6.2.3.1. Supply Chain Management and Logistics
- 6.2.3.2. Sales and Marketing Services
- 6.2.3.3. Other Non-clinical Services
- 6.1. Market Analysis, Insights and Forecast - by Payer Service
- 7. North America US Healthcare BPO Industry Analysis, Insights and Forecast, 2020-2032
- 7.1. Market Analysis, Insights and Forecast - by Payer Service
- 7.1.1. Human Resource Management
- 7.1.2. Claims Management
- 7.1.3. Customer Relationship Management (CRM)
- 7.1.4. Operational/Administrative Management
- 7.1.5. Care Management
- 7.1.6. Provider Management
- 7.1.7. Other Payer Services
- 7.2. Market Analysis, Insights and Forecast - by Pharmaceutical Service
- 7.2.1. Research and Development
- 7.2.2. Manufacturing
- 7.2.3. Non-clinical Services
- 7.2.3.1. Supply Chain Management and Logistics
- 7.2.3.2. Sales and Marketing Services
- 7.2.3.3. Other Non-clinical Services
- 7.1. Market Analysis, Insights and Forecast - by Payer Service
- 8. South America US Healthcare BPO Industry Analysis, Insights and Forecast, 2020-2032
- 8.1. Market Analysis, Insights and Forecast - by Payer Service
- 8.1.1. Human Resource Management
- 8.1.2. Claims Management
- 8.1.3. Customer Relationship Management (CRM)
- 8.1.4. Operational/Administrative Management
- 8.1.5. Care Management
- 8.1.6. Provider Management
- 8.1.7. Other Payer Services
- 8.2. Market Analysis, Insights and Forecast - by Pharmaceutical Service
- 8.2.1. Research and Development
- 8.2.2. Manufacturing
- 8.2.3. Non-clinical Services
- 8.2.3.1. Supply Chain Management and Logistics
- 8.2.3.2. Sales and Marketing Services
- 8.2.3.3. Other Non-clinical Services
- 8.1. Market Analysis, Insights and Forecast - by Payer Service
- 9. Europe US Healthcare BPO Industry Analysis, Insights and Forecast, 2020-2032
- 9.1. Market Analysis, Insights and Forecast - by Payer Service
- 9.1.1. Human Resource Management
- 9.1.2. Claims Management
- 9.1.3. Customer Relationship Management (CRM)
- 9.1.4. Operational/Administrative Management
- 9.1.5. Care Management
- 9.1.6. Provider Management
- 9.1.7. Other Payer Services
- 9.2. Market Analysis, Insights and Forecast - by Pharmaceutical Service
- 9.2.1. Research and Development
- 9.2.2. Manufacturing
- 9.2.3. Non-clinical Services
- 9.2.3.1. Supply Chain Management and Logistics
- 9.2.3.2. Sales and Marketing Services
- 9.2.3.3. Other Non-clinical Services
- 9.1. Market Analysis, Insights and Forecast - by Payer Service
- 10. Middle East & Africa US Healthcare BPO Industry Analysis, Insights and Forecast, 2020-2032
- 10.1. Market Analysis, Insights and Forecast - by Payer Service
- 10.1.1. Human Resource Management
- 10.1.2. Claims Management
- 10.1.3. Customer Relationship Management (CRM)
- 10.1.4. Operational/Administrative Management
- 10.1.5. Care Management
- 10.1.6. Provider Management
- 10.1.7. Other Payer Services
- 10.2. Market Analysis, Insights and Forecast - by Pharmaceutical Service
- 10.2.1. Research and Development
- 10.2.2. Manufacturing
- 10.2.3. Non-clinical Services
- 10.2.3.1. Supply Chain Management and Logistics
- 10.2.3.2. Sales and Marketing Services
- 10.2.3.3. Other Non-clinical Services
- 10.1. Market Analysis, Insights and Forecast - by Payer Service
- 11. Asia Pacific US Healthcare BPO Industry Analysis, Insights and Forecast, 2020-2032
- 11.1. Market Analysis, Insights and Forecast - by Payer Service
- 11.1.1. Human Resource Management
- 11.1.2. Claims Management
- 11.1.3. Customer Relationship Management (CRM)
- 11.1.4. Operational/Administrative Management
- 11.1.5. Care Management
- 11.1.6. Provider Management
- 11.1.7. Other Payer Services
- 11.2. Market Analysis, Insights and Forecast - by Pharmaceutical Service
- 11.2.1. Research and Development
- 11.2.2. Manufacturing
- 11.2.3. Non-clinical Services
- 11.2.3.1. Supply Chain Management and Logistics
- 11.2.3.2. Sales and Marketing Services
- 11.2.3.3. Other Non-clinical Services
- 11.1. Market Analysis, Insights and Forecast - by Payer Service
- 12. Competitive Analysis
- 12.1. Company Profiles
- 12.1.1 Accenture PLC
- 12.1.1.1. Company Overview
- 12.1.1.2. Products
- 12.1.1.3. Company Financials
- 12.1.1.4. SWOT Analysis
- 12.1.2 Cognizant
- 12.1.2.1. Company Overview
- 12.1.2.2. Products
- 12.1.2.3. Company Financials
- 12.1.2.4. SWOT Analysis
- 12.1.3 UnitedHealth Group Incorporated*List Not Exhaustive
- 12.1.3.1. Company Overview
- 12.1.3.2. Products
- 12.1.3.3. Company Financials
- 12.1.3.4. SWOT Analysis
- 12.1.4 GeBBs Healthcare Solutions
- 12.1.4.1. Company Overview
- 12.1.4.2. Products
- 12.1.4.3. Company Financials
- 12.1.4.4. SWOT Analysis
- 12.1.5 IBM Corporation
- 12.1.5.1. Company Overview
- 12.1.5.2. Products
- 12.1.5.3. Company Financials
- 12.1.5.4. SWOT Analysis
- 12.1.6 Sutherland Healthcare Solutions
- 12.1.6.1. Company Overview
- 12.1.6.2. Products
- 12.1.6.3. Company Financials
- 12.1.6.4. SWOT Analysis
- 12.1.7 Parexel International
- 12.1.7.1. Company Overview
- 12.1.7.2. Products
- 12.1.7.3. Company Financials
- 12.1.7.4. SWOT Analysis
- 12.1.8 IQVIA
- 12.1.8.1. Company Overview
- 12.1.8.2. Products
- 12.1.8.3. Company Financials
- 12.1.8.4. SWOT Analysis
- 12.1.9 Capgemini
- 12.1.9.1. Company Overview
- 12.1.9.2. Products
- 12.1.9.3. Company Financials
- 12.1.9.4. SWOT Analysis
- 12.1.10 Genpact Limited
- 12.1.10.1. Company Overview
- 12.1.10.2. Products
- 12.1.10.3. Company Financials
- 12.1.10.4. SWOT Analysis
- 12.1.1 Accenture PLC
- 12.2. Market Entropy
- 12.2.1 Company's Key Areas Served
- 12.2.2 Recent Developments
- 12.3. Company Market Share Analysis 2025
- 12.3.1 Top 5 Companies Market Share Analysis
- 12.3.2 Top 3 Companies Market Share Analysis
- 12.4. List of Potential Customers
- 13. Research Methodology
List of Figures
- Figure 1: Global US Healthcare BPO Industry Revenue Breakdown (Million, %) by Region 2025 & 2033
- Figure 2: North America US Healthcare BPO Industry Revenue (Million), by Payer Service 2025 & 2033
- Figure 3: North America US Healthcare BPO Industry Revenue Share (%), by Payer Service 2025 & 2033
- Figure 4: North America US Healthcare BPO Industry Revenue (Million), by Pharmaceutical Service 2025 & 2033
- Figure 5: North America US Healthcare BPO Industry Revenue Share (%), by Pharmaceutical Service 2025 & 2033
- Figure 6: North America US Healthcare BPO Industry Revenue (Million), by Country 2025 & 2033
- Figure 7: North America US Healthcare BPO Industry Revenue Share (%), by Country 2025 & 2033
- Figure 8: South America US Healthcare BPO Industry Revenue (Million), by Payer Service 2025 & 2033
- Figure 9: South America US Healthcare BPO Industry Revenue Share (%), by Payer Service 2025 & 2033
- Figure 10: South America US Healthcare BPO Industry Revenue (Million), by Pharmaceutical Service 2025 & 2033
- Figure 11: South America US Healthcare BPO Industry Revenue Share (%), by Pharmaceutical Service 2025 & 2033
- Figure 12: South America US Healthcare BPO Industry Revenue (Million), by Country 2025 & 2033
- Figure 13: South America US Healthcare BPO Industry Revenue Share (%), by Country 2025 & 2033
- Figure 14: Europe US Healthcare BPO Industry Revenue (Million), by Payer Service 2025 & 2033
- Figure 15: Europe US Healthcare BPO Industry Revenue Share (%), by Payer Service 2025 & 2033
- Figure 16: Europe US Healthcare BPO Industry Revenue (Million), by Pharmaceutical Service 2025 & 2033
- Figure 17: Europe US Healthcare BPO Industry Revenue Share (%), by Pharmaceutical Service 2025 & 2033
- Figure 18: Europe US Healthcare BPO Industry Revenue (Million), by Country 2025 & 2033
- Figure 19: Europe US Healthcare BPO Industry Revenue Share (%), by Country 2025 & 2033
- Figure 20: Middle East & Africa US Healthcare BPO Industry Revenue (Million), by Payer Service 2025 & 2033
- Figure 21: Middle East & Africa US Healthcare BPO Industry Revenue Share (%), by Payer Service 2025 & 2033
- Figure 22: Middle East & Africa US Healthcare BPO Industry Revenue (Million), by Pharmaceutical Service 2025 & 2033
- Figure 23: Middle East & Africa US Healthcare BPO Industry Revenue Share (%), by Pharmaceutical Service 2025 & 2033
- Figure 24: Middle East & Africa US Healthcare BPO Industry Revenue (Million), by Country 2025 & 2033
- Figure 25: Middle East & Africa US Healthcare BPO Industry Revenue Share (%), by Country 2025 & 2033
- Figure 26: Asia Pacific US Healthcare BPO Industry Revenue (Million), by Payer Service 2025 & 2033
- Figure 27: Asia Pacific US Healthcare BPO Industry Revenue Share (%), by Payer Service 2025 & 2033
- Figure 28: Asia Pacific US Healthcare BPO Industry Revenue (Million), by Pharmaceutical Service 2025 & 2033
- Figure 29: Asia Pacific US Healthcare BPO Industry Revenue Share (%), by Pharmaceutical Service 2025 & 2033
- Figure 30: Asia Pacific US Healthcare BPO Industry Revenue (Million), by Country 2025 & 2033
- Figure 31: Asia Pacific US Healthcare BPO Industry Revenue Share (%), by Country 2025 & 2033
List of Tables
- Table 1: Global US Healthcare BPO Industry Revenue Million Forecast, by Payer Service 2020 & 2033
- Table 2: Global US Healthcare BPO Industry Revenue Million Forecast, by Pharmaceutical Service 2020 & 2033
- Table 3: Global US Healthcare BPO Industry Revenue Million Forecast, by Region 2020 & 2033
- Table 4: Global US Healthcare BPO Industry Revenue Million Forecast, by Payer Service 2020 & 2033
- Table 5: Global US Healthcare BPO Industry Revenue Million Forecast, by Pharmaceutical Service 2020 & 2033
- Table 6: Global US Healthcare BPO Industry Revenue Million Forecast, by Country 2020 & 2033
- Table 7: United States US Healthcare BPO Industry Revenue (Million) Forecast, by Application 2020 & 2033
- Table 8: Canada US Healthcare BPO Industry Revenue (Million) Forecast, by Application 2020 & 2033
- Table 9: Mexico US Healthcare BPO Industry Revenue (Million) Forecast, by Application 2020 & 2033
- Table 10: Global US Healthcare BPO Industry Revenue Million Forecast, by Payer Service 2020 & 2033
- Table 11: Global US Healthcare BPO Industry Revenue Million Forecast, by Pharmaceutical Service 2020 & 2033
- Table 12: Global US Healthcare BPO Industry Revenue Million Forecast, by Country 2020 & 2033
- Table 13: Brazil US Healthcare BPO Industry Revenue (Million) Forecast, by Application 2020 & 2033
- Table 14: Argentina US Healthcare BPO Industry Revenue (Million) Forecast, by Application 2020 & 2033
- Table 15: Rest of South America US Healthcare BPO Industry Revenue (Million) Forecast, by Application 2020 & 2033
- Table 16: Global US Healthcare BPO Industry Revenue Million Forecast, by Payer Service 2020 & 2033
- Table 17: Global US Healthcare BPO Industry Revenue Million Forecast, by Pharmaceutical Service 2020 & 2033
- Table 18: Global US Healthcare BPO Industry Revenue Million Forecast, by Country 2020 & 2033
- Table 19: United Kingdom US Healthcare BPO Industry Revenue (Million) Forecast, by Application 2020 & 2033
- Table 20: Germany US Healthcare BPO Industry Revenue (Million) Forecast, by Application 2020 & 2033
- Table 21: France US Healthcare BPO Industry Revenue (Million) Forecast, by Application 2020 & 2033
- Table 22: Italy US Healthcare BPO Industry Revenue (Million) Forecast, by Application 2020 & 2033
- Table 23: Spain US Healthcare BPO Industry Revenue (Million) Forecast, by Application 2020 & 2033
- Table 24: Russia US Healthcare BPO Industry Revenue (Million) Forecast, by Application 2020 & 2033
- Table 25: Benelux US Healthcare BPO Industry Revenue (Million) Forecast, by Application 2020 & 2033
- Table 26: Nordics US Healthcare BPO Industry Revenue (Million) Forecast, by Application 2020 & 2033
- Table 27: Rest of Europe US Healthcare BPO Industry Revenue (Million) Forecast, by Application 2020 & 2033
- Table 28: Global US Healthcare BPO Industry Revenue Million Forecast, by Payer Service 2020 & 2033
- Table 29: Global US Healthcare BPO Industry Revenue Million Forecast, by Pharmaceutical Service 2020 & 2033
- Table 30: Global US Healthcare BPO Industry Revenue Million Forecast, by Country 2020 & 2033
- Table 31: Turkey US Healthcare BPO Industry Revenue (Million) Forecast, by Application 2020 & 2033
- Table 32: Israel US Healthcare BPO Industry Revenue (Million) Forecast, by Application 2020 & 2033
- Table 33: GCC US Healthcare BPO Industry Revenue (Million) Forecast, by Application 2020 & 2033
- Table 34: North Africa US Healthcare BPO Industry Revenue (Million) Forecast, by Application 2020 & 2033
- Table 35: South Africa US Healthcare BPO Industry Revenue (Million) Forecast, by Application 2020 & 2033
- Table 36: Rest of Middle East & Africa US Healthcare BPO Industry Revenue (Million) Forecast, by Application 2020 & 2033
- Table 37: Global US Healthcare BPO Industry Revenue Million Forecast, by Payer Service 2020 & 2033
- Table 38: Global US Healthcare BPO Industry Revenue Million Forecast, by Pharmaceutical Service 2020 & 2033
- Table 39: Global US Healthcare BPO Industry Revenue Million Forecast, by Country 2020 & 2033
- Table 40: China US Healthcare BPO Industry Revenue (Million) Forecast, by Application 2020 & 2033
- Table 41: India US Healthcare BPO Industry Revenue (Million) Forecast, by Application 2020 & 2033
- Table 42: Japan US Healthcare BPO Industry Revenue (Million) Forecast, by Application 2020 & 2033
- Table 43: South Korea US Healthcare BPO Industry Revenue (Million) Forecast, by Application 2020 & 2033
- Table 44: ASEAN US Healthcare BPO Industry Revenue (Million) Forecast, by Application 2020 & 2033
- Table 45: Oceania US Healthcare BPO Industry Revenue (Million) Forecast, by Application 2020 & 2033
- Table 46: Rest of Asia Pacific US Healthcare BPO Industry Revenue (Million) Forecast, by Application 2020 & 2033
Frequently Asked Questions
1. What is the projected Compound Annual Growth Rate (CAGR) of the US Healthcare BPO Industry?
The projected CAGR is approximately 8.11%.
2. Which companies are prominent players in the US Healthcare BPO Industry?
Key companies in the market include Accenture PLC, Cognizant, UnitedHealth Group Incorporated*List Not Exhaustive, GeBBs Healthcare Solutions, IBM Corporation, Sutherland Healthcare Solutions, Parexel International, IQVIA, Capgemini, Genpact Limited.
3. What are the main segments of the US Healthcare BPO Industry?
The market segments include Payer Service, Pharmaceutical Service.
4. Can you provide details about the market size?
The market size is estimated to be USD 133 Million as of 2022.
5. What are some drivers contributing to market growth?
Rapid Increase in Clinical Process Outsourcing (CPO); Increasing R&D in the Healthcare Industry.
6. What are the notable trends driving market growth?
Claims Management is Expected to Grow with High CAGR in the Forecast Period.
7. Are there any restraints impacting market growth?
Data Integrity and Confidentiality.
8. Can you provide examples of recent developments in the market?
May 2023: Atento, a major provider of customer relationship and business process outsourcing (CRM/BPO) services, reported that Frost & Sullivan recognized it as a leader in the Frost Radar for Customer Experience and Outsourcing services in Latin America for 2022.
9. What pricing options are available for accessing the report?
Pricing options include single-user, multi-user, and enterprise licenses priced at USD 3800, USD 4500, and USD 5800 respectively.
10. Is the market size provided in terms of value or volume?
The market size is provided in terms of value, measured in Million.
11. Are there any specific market keywords associated with the report?
Yes, the market keyword associated with the report is "US Healthcare BPO Industry," which aids in identifying and referencing the specific market segment covered.
12. How do I determine which pricing option suits my needs best?
The pricing options vary based on user requirements and access needs. Individual users may opt for single-user licenses, while businesses requiring broader access may choose multi-user or enterprise licenses for cost-effective access to the report.
13. Are there any additional resources or data provided in the US Healthcare BPO Industry report?
While the report offers comprehensive insights, it's advisable to review the specific contents or supplementary materials provided to ascertain if additional resources or data are available.
14. How can I stay updated on further developments or reports in the US Healthcare BPO Industry?
To stay informed about further developments, trends, and reports in the US Healthcare BPO Industry, consider subscribing to industry newsletters, following relevant companies and organizations, or regularly checking reputable industry news sources and publications.
Methodology
Step 1 - Identification of Relevant Samples Size from Population Database


Step 2 - Approaches for Defining Global Market Size (Value, Volume* & Price*)

Note*: In applicable scenarios
Step 3 - Data Sources
Primary Research
- Web Analytics
- Survey Reports
- Research Institute
- Latest Research Reports
- Opinion Leaders
Secondary Research
- Annual Reports
- White Paper
- Latest Press Release
- Industry Association
- Paid Database
- Investor Presentations

Step 4 - Data Triangulation
Involves using different sources of information in order to increase the validity of a study
These sources are likely to be stakeholders in a program - participants, other researchers, program staff, other community members, and so on.
Then we put all data in single framework & apply various statistical tools to find out the dynamic on the market.
During the analysis stage, feedback from the stakeholder groups would be compared to determine areas of agreement as well as areas of divergence

