
Key Insights
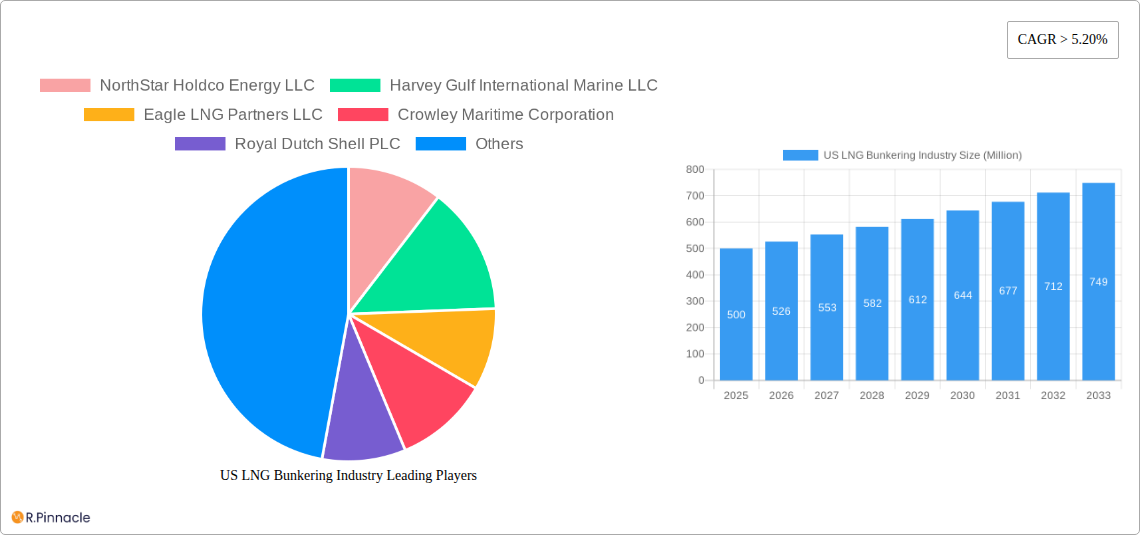
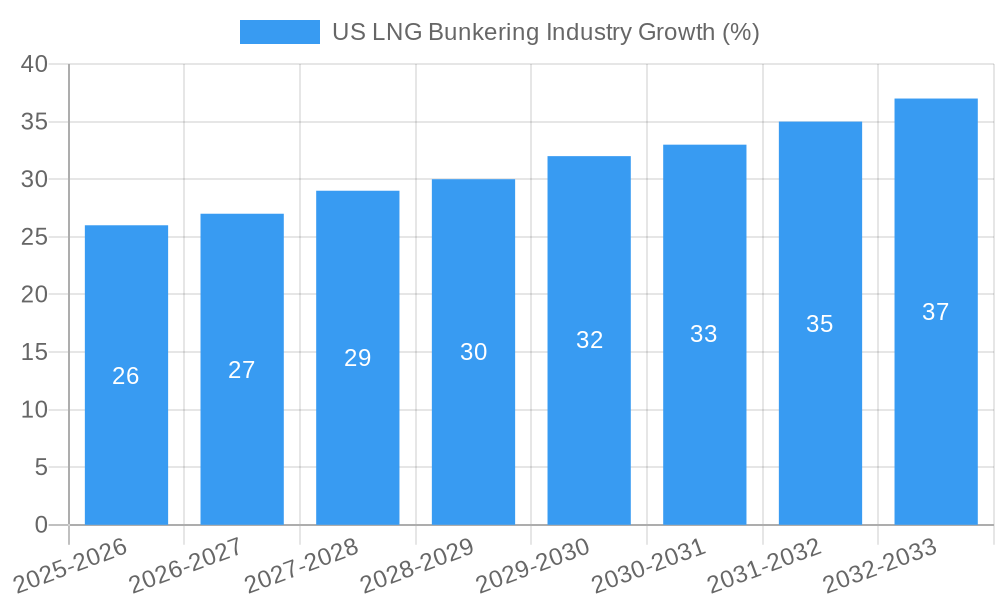
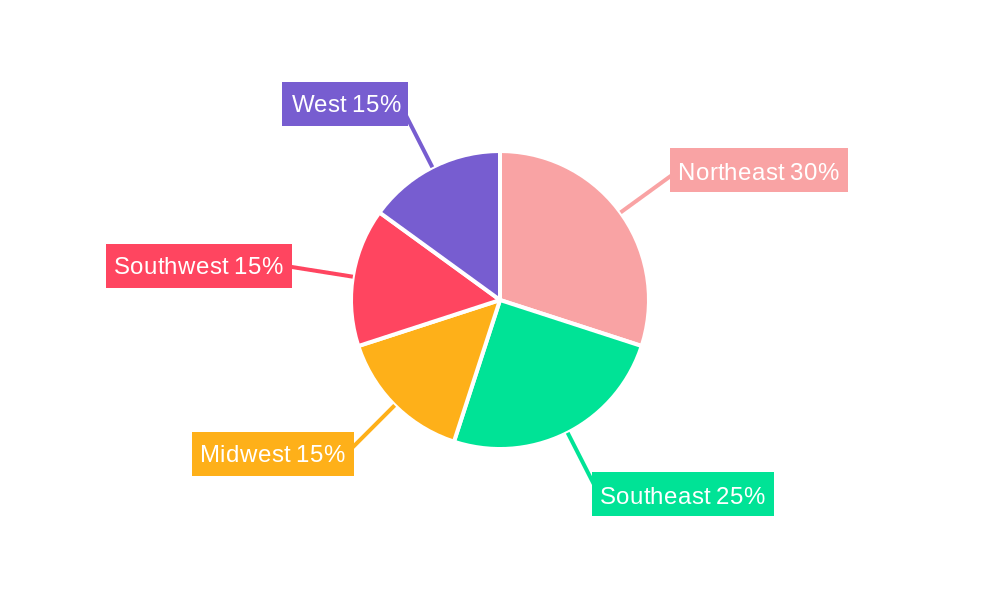
The US LNG bunkering market, valued at approximately $500 million in 2025, is projected to experience robust growth, exceeding a 5.20% CAGR through 2033. This expansion is fueled by several key drivers. The increasing adoption of LNG as a cleaner marine fuel, driven by stringent environmental regulations like the IMO 2020 sulfur cap and growing environmental concerns, is a major catalyst. Furthermore, the expansion of LNG infrastructure, including the development of dedicated LNG bunkering vessels and onshore liquefaction facilities, is significantly facilitating market penetration. The growth is further amplified by the rising demand for LNG-fueled vessels across various segments, particularly in the tanker, container, and ferry sectors. The US government's support for cleaner maritime transportation also plays a significant role in fostering market growth. Regional variations exist, with the Northeast and Southeast likely experiencing faster growth due to higher port activity and existing LNG infrastructure.
However, challenges remain. High initial investment costs associated with LNG bunkering infrastructure and the limited availability of LNG bunkering ports across the US could impede market expansion, at least in the short term. Price volatility in LNG and the availability of alternative, albeit less environmentally friendly, marine fuels also pose potential restraints. Despite these factors, the long-term outlook for the US LNG bunkering market remains positive, given the growing impetus towards decarbonization in the shipping industry and the inherent economic advantages of LNG as a cleaner and potentially more cost-effective fuel in the long run. The increasing involvement of major players like NorthStar Holdco Energy LLC, Harvey Gulf International Marine LLC, and Crowley Maritime Corporation is indicative of the market's strong growth potential. The various end-user segments, including tanker fleets, container fleets, and ferries, represent a diverse and expanding market.
This comprehensive report provides an in-depth analysis of the US LNG bunkering industry, offering crucial insights for industry professionals, investors, and strategic decision-makers. With a focus on market structure, dynamics, and future trends, this report covers the period from 2019 to 2033, with a base year of 2025 and a forecast period of 2025-2033. The report leverages extensive data analysis and expert insights to deliver actionable intelligence, enabling informed strategic planning and investment decisions.
US LNG Bunkering Industry Market Structure & Innovation Trends
This section analyzes the competitive landscape of the US LNG bunkering market, exploring market concentration, innovation drivers, regulatory frameworks, and M&A activities. The report delves into the market share of key players, including NorthStar Holdco Energy LLC, Harvey Gulf International Marine LLC, Eagle LNG Partners LLC, Crowley Maritime Corporation, Royal Dutch Shell PLC, Conrad Shipyards LLC, and JAX LNG LLC. We examine the impact of regulatory changes on market dynamics and assess the potential for future consolidation through mergers and acquisitions. The analysis includes an estimation of M&A deal values for the historical period (2019-2024), revealing total deal values of approximately $XX Million. The report also identifies key innovation drivers, such as advancements in LNG bunkering technology and evolving environmental regulations, and analyzes the impact of these trends on market growth. The report further assesses the influence of product substitutes and analyzes end-user demographics, providing a comprehensive overview of the market structure and its evolution. The market share of the top three players in 2025 is estimated at approximately XX%.
US LNG Bunkering Industry Market Dynamics & Trends
This section examines the driving forces shaping the US LNG bunkering market's growth trajectory. We analyze market growth drivers, including the increasing adoption of LNG as a marine fuel, stringent environmental regulations aimed at reducing greenhouse gas emissions, and growing demand for cleaner energy solutions within the maritime sector. The report quantifies this growth with a projected Compound Annual Growth Rate (CAGR) of XX% from 2025 to 2033. Technological disruptions, such as advancements in LNG bunkering infrastructure and technology, are assessed for their impact on market penetration. This section also details shifting consumer preferences towards environmentally sustainable fuel options, analyzing their impact on market dynamics. A thorough examination of competitive dynamics, including pricing strategies, market positioning, and expansion strategies of key players, provides further insights into market trends. Market penetration of LNG bunkering is expected to reach XX% by 2033.
Dominant Regions & Segments in US LNG Bunkering Industry
This section identifies the leading regions and segments within the US LNG bunkering market. The analysis reveals that the [Insert Leading Region/State] region holds a dominant position, driven by factors such as favorable economic policies, robust infrastructure, and a high concentration of port activities.
- Key Drivers for Dominant Region:
- Supportive Government Policies and Incentives
- Well-Developed Port Infrastructure
- Strategic Location and High Vessel Traffic
- Availability of LNG Supply
The report further segments the market by end-user, including:
- Tanker Fleet: The tanker fleet segment is expected to dominate, driven by the increasing transport of LNG globally and the need for efficient bunkering solutions.
- Container Fleet: Growth in this segment is fueled by the rising demand for container shipping and the adoption of cleaner fuels.
- Bulk and General Cargo Fleet: This segment demonstrates moderate growth, driven by increasing environmental awareness and regulatory pressures.
- Ferries and OSV: This segment shows promising growth potential, driven by the increasing adoption of LNG in short-sea shipping and offshore operations.
- Others: This segment includes smaller vessels and niche applications with varied growth trajectories.
A detailed analysis of each segment's dominance is provided, highlighting market size, growth projections, and competitive dynamics.
US LNG Bunkering Industry Product Innovations
This section highlights recent advancements in LNG bunkering technologies and their applications within the market. Innovation is driven primarily by improvements in LNG storage and handling systems, as well as the development of more efficient and environmentally friendly bunkering processes. These technological trends are enhancing safety, efficiency, and reducing environmental impact, thereby improving market fit and driving growth. New technologies focus on minimizing boil-off gas (BOG) and improving the overall efficiency of the bunkering process.
Report Scope & Segmentation Analysis
This report segments the US LNG bunkering market by end-user, providing detailed analysis of each segment: Tanker Fleet, Container Fleet, Bulk and General Cargo Fleet, Ferries and OSV, and Others. Each segment's growth projections, market size, and competitive dynamics are analyzed, providing a comprehensive understanding of the market's structure and future potential. For example, the Tanker Fleet segment is projected to reach $XX Million by 2033, driven by the growing global LNG trade.
Key Drivers of US LNG Bunkering Industry Growth
Several key factors drive the growth of the US LNG bunkering industry. Stringent environmental regulations, such as the International Maritime Organization's (IMO) 2020 sulfur cap, incentivize the adoption of cleaner fuels like LNG. The increasing availability of LNG infrastructure, including dedicated bunkering vessels and onshore facilities, further supports market expansion. Finally, rising global demand for LNG, coupled with favorable government policies and incentives, fuels the industry’s growth trajectory.
Challenges in the US LNG Bunkering Industry Sector
Despite its promising growth outlook, the US LNG bunkering industry faces several challenges. High initial investment costs associated with LNG bunkering infrastructure pose a significant barrier to entry. Fluctuations in LNG prices can also impact market stability and profitability. Furthermore, the availability of skilled labor and the complexity of LNG handling present operational hurdles. These factors can collectively impact market growth, potentially slowing expansion.
Emerging Opportunities in US LNG Bunkering Industry
The US LNG bunkering market presents several emerging opportunities. The growing demand for cleaner fuels in the maritime sector opens up new market segments for LNG bunkering. Advancements in LNG bunkering technology, such as the development of smaller-scale LNG bunkering vessels, are expanding the accessibility of LNG as a fuel source. Furthermore, increasing collaboration between industry stakeholders and the development of robust regulatory frameworks will create a more supportive environment for industry expansion.
Leading Players in the US LNG Bunkering Industry Market
- NorthStar Holdco Energy LLC
- Harvey Gulf International Marine LLC
- Eagle LNG Partners LLC
- Crowley Maritime Corporation
- Royal Dutch Shell PLC
- Conrad Shipyards LLC
- JAX LNG LLC
Key Developments in US LNG Bunkering Industry
- [Month, Year]: [Company Name] launches a new LNG bunkering vessel, expanding its capacity and reach.
- [Month, Year]: [Regulatory Body] introduces new regulations aimed at reducing greenhouse gas emissions from ships, further driving LNG adoption.
- [Month, Year]: [Company A] and [Company B] announce a strategic partnership to develop LNG bunkering infrastructure.
Future Outlook for US LNG Bunkering Industry Market
The future outlook for the US LNG bunkering industry remains positive, driven by several key factors. The continued implementation of stricter environmental regulations will drive the demand for LNG as a marine fuel. Advancements in LNG bunkering technology will improve efficiency and reduce costs. Government support and incentives will further accelerate market growth. Therefore, the industry is poised for substantial growth in the coming years, presenting significant opportunities for investment and expansion.
US LNG Bunkering Industry Segmentation
-
1. End-User
- 1.1. Tanker Fleet
- 1.2. Container Fleet
- 1.3. Bulk and General Cargo Fleet
- 1.4. Ferries and OSV
- 1.5. Others
US LNG Bunkering Industry Segmentation By Geography
-
1. North America
- 1.1. United States
- 1.2. Canada
- 1.3. Mexico
-
2. South America
- 2.1. Brazil
- 2.2. Argentina
- 2.3. Rest of South America
-
3. Europe
- 3.1. United Kingdom
- 3.2. Germany
- 3.3. France
- 3.4. Italy
- 3.5. Spain
- 3.6. Russia
- 3.7. Benelux
- 3.8. Nordics
- 3.9. Rest of Europe
-
4. Middle East & Africa
- 4.1. Turkey
- 4.2. Israel
- 4.3. GCC
- 4.4. North Africa
- 4.5. South Africa
- 4.6. Rest of Middle East & Africa
-
5. Asia Pacific
- 5.1. China
- 5.2. India
- 5.3. Japan
- 5.4. South Korea
- 5.5. ASEAN
- 5.6. Oceania
- 5.7. Rest of Asia Pacific
US LNG Bunkering Industry REPORT HIGHLIGHTS
| Aspects | Details |
|---|---|
| Study Period | 2019-2033 |
| Base Year | 2024 |
| Estimated Year | 2025 |
| Forecast Period | 2025-2033 |
| Historical Period | 2019-2024 |
| Growth Rate | CAGR of > 5.20% from 2019-2033 |
| Segmentation |
|
Table of Contents
- 1. Introduction
- 1.1. Research Scope
- 1.2. Market Segmentation
- 1.3. Research Methodology
- 1.4. Definitions and Assumptions
- 2. Executive Summary
- 2.1. Introduction
- 3. Market Dynamics
- 3.1. Introduction
- 3.2. Market Drivers
- 3.2.1. 4.; Increasing Production from Unconventional Sources4.; Growing Energy Demand in the Region
- 3.3. Market Restrains
- 3.3.1. 4.; Environmental Concerns
- 3.4. Market Trends
- 3.4.1. Container Fleet is Expected to Dominate in the Market
- 4. Market Factor Analysis
- 4.1. Porters Five Forces
- 4.2. Supply/Value Chain
- 4.3. PESTEL analysis
- 4.4. Market Entropy
- 4.5. Patent/Trademark Analysis
- 5. Global US LNG Bunkering Industry Analysis, Insights and Forecast, 2019-2031
- 5.1. Market Analysis, Insights and Forecast - by End-User
- 5.1.1. Tanker Fleet
- 5.1.2. Container Fleet
- 5.1.3. Bulk and General Cargo Fleet
- 5.1.4. Ferries and OSV
- 5.1.5. Others
- 5.2. Market Analysis, Insights and Forecast - by Region
- 5.2.1. North America
- 5.2.2. South America
- 5.2.3. Europe
- 5.2.4. Middle East & Africa
- 5.2.5. Asia Pacific
- 5.1. Market Analysis, Insights and Forecast - by End-User
- 6. North America US LNG Bunkering Industry Analysis, Insights and Forecast, 2019-2031
- 6.1. Market Analysis, Insights and Forecast - by End-User
- 6.1.1. Tanker Fleet
- 6.1.2. Container Fleet
- 6.1.3. Bulk and General Cargo Fleet
- 6.1.4. Ferries and OSV
- 6.1.5. Others
- 6.1. Market Analysis, Insights and Forecast - by End-User
- 7. South America US LNG Bunkering Industry Analysis, Insights and Forecast, 2019-2031
- 7.1. Market Analysis, Insights and Forecast - by End-User
- 7.1.1. Tanker Fleet
- 7.1.2. Container Fleet
- 7.1.3. Bulk and General Cargo Fleet
- 7.1.4. Ferries and OSV
- 7.1.5. Others
- 7.1. Market Analysis, Insights and Forecast - by End-User
- 8. Europe US LNG Bunkering Industry Analysis, Insights and Forecast, 2019-2031
- 8.1. Market Analysis, Insights and Forecast - by End-User
- 8.1.1. Tanker Fleet
- 8.1.2. Container Fleet
- 8.1.3. Bulk and General Cargo Fleet
- 8.1.4. Ferries and OSV
- 8.1.5. Others
- 8.1. Market Analysis, Insights and Forecast - by End-User
- 9. Middle East & Africa US LNG Bunkering Industry Analysis, Insights and Forecast, 2019-2031
- 9.1. Market Analysis, Insights and Forecast - by End-User
- 9.1.1. Tanker Fleet
- 9.1.2. Container Fleet
- 9.1.3. Bulk and General Cargo Fleet
- 9.1.4. Ferries and OSV
- 9.1.5. Others
- 9.1. Market Analysis, Insights and Forecast - by End-User
- 10. Asia Pacific US LNG Bunkering Industry Analysis, Insights and Forecast, 2019-2031
- 10.1. Market Analysis, Insights and Forecast - by End-User
- 10.1.1. Tanker Fleet
- 10.1.2. Container Fleet
- 10.1.3. Bulk and General Cargo Fleet
- 10.1.4. Ferries and OSV
- 10.1.5. Others
- 10.1. Market Analysis, Insights and Forecast - by End-User
- 11. Northeast US LNG Bunkering Industry Analysis, Insights and Forecast, 2019-2031
- 12. Southeast US LNG Bunkering Industry Analysis, Insights and Forecast, 2019-2031
- 13. Midwest US LNG Bunkering Industry Analysis, Insights and Forecast, 2019-2031
- 14. Southwest US LNG Bunkering Industry Analysis, Insights and Forecast, 2019-2031
- 15. West US LNG Bunkering Industry Analysis, Insights and Forecast, 2019-2031
- 16. Competitive Analysis
- 16.1. Global Market Share Analysis 2024
- 16.2. Company Profiles
- 16.2.1 NorthStar Holdco Energy LLC
- 16.2.1.1. Overview
- 16.2.1.2. Products
- 16.2.1.3. SWOT Analysis
- 16.2.1.4. Recent Developments
- 16.2.1.5. Financials (Based on Availability)
- 16.2.2 Harvey Gulf International Marine LLC
- 16.2.2.1. Overview
- 16.2.2.2. Products
- 16.2.2.3. SWOT Analysis
- 16.2.2.4. Recent Developments
- 16.2.2.5. Financials (Based on Availability)
- 16.2.3 Eagle LNG Partners LLC
- 16.2.3.1. Overview
- 16.2.3.2. Products
- 16.2.3.3. SWOT Analysis
- 16.2.3.4. Recent Developments
- 16.2.3.5. Financials (Based on Availability)
- 16.2.4 Crowley Maritime Corporation
- 16.2.4.1. Overview
- 16.2.4.2. Products
- 16.2.4.3. SWOT Analysis
- 16.2.4.4. Recent Developments
- 16.2.4.5. Financials (Based on Availability)
- 16.2.5 Royal Dutch Shell PLC
- 16.2.5.1. Overview
- 16.2.5.2. Products
- 16.2.5.3. SWOT Analysis
- 16.2.5.4. Recent Developments
- 16.2.5.5. Financials (Based on Availability)
- 16.2.6 Conrad Shipyards LLC
- 16.2.6.1. Overview
- 16.2.6.2. Products
- 16.2.6.3. SWOT Analysis
- 16.2.6.4. Recent Developments
- 16.2.6.5. Financials (Based on Availability)
- 16.2.7 JAX LNG LLC
- 16.2.7.1. Overview
- 16.2.7.2. Products
- 16.2.7.3. SWOT Analysis
- 16.2.7.4. Recent Developments
- 16.2.7.5. Financials (Based on Availability)
- 16.2.1 NorthStar Holdco Energy LLC
List of Figures
- Figure 1: Global US LNG Bunkering Industry Revenue Breakdown (Million, %) by Region 2024 & 2032
- Figure 2: United states US LNG Bunkering Industry Revenue (Million), by Country 2024 & 2032
- Figure 3: United states US LNG Bunkering Industry Revenue Share (%), by Country 2024 & 2032
- Figure 4: North America US LNG Bunkering Industry Revenue (Million), by End-User 2024 & 2032
- Figure 5: North America US LNG Bunkering Industry Revenue Share (%), by End-User 2024 & 2032
- Figure 6: North America US LNG Bunkering Industry Revenue (Million), by Country 2024 & 2032
- Figure 7: North America US LNG Bunkering Industry Revenue Share (%), by Country 2024 & 2032
- Figure 8: South America US LNG Bunkering Industry Revenue (Million), by End-User 2024 & 2032
- Figure 9: South America US LNG Bunkering Industry Revenue Share (%), by End-User 2024 & 2032
- Figure 10: South America US LNG Bunkering Industry Revenue (Million), by Country 2024 & 2032
- Figure 11: South America US LNG Bunkering Industry Revenue Share (%), by Country 2024 & 2032
- Figure 12: Europe US LNG Bunkering Industry Revenue (Million), by End-User 2024 & 2032
- Figure 13: Europe US LNG Bunkering Industry Revenue Share (%), by End-User 2024 & 2032
- Figure 14: Europe US LNG Bunkering Industry Revenue (Million), by Country 2024 & 2032
- Figure 15: Europe US LNG Bunkering Industry Revenue Share (%), by Country 2024 & 2032
- Figure 16: Middle East & Africa US LNG Bunkering Industry Revenue (Million), by End-User 2024 & 2032
- Figure 17: Middle East & Africa US LNG Bunkering Industry Revenue Share (%), by End-User 2024 & 2032
- Figure 18: Middle East & Africa US LNG Bunkering Industry Revenue (Million), by Country 2024 & 2032
- Figure 19: Middle East & Africa US LNG Bunkering Industry Revenue Share (%), by Country 2024 & 2032
- Figure 20: Asia Pacific US LNG Bunkering Industry Revenue (Million), by End-User 2024 & 2032
- Figure 21: Asia Pacific US LNG Bunkering Industry Revenue Share (%), by End-User 2024 & 2032
- Figure 22: Asia Pacific US LNG Bunkering Industry Revenue (Million), by Country 2024 & 2032
- Figure 23: Asia Pacific US LNG Bunkering Industry Revenue Share (%), by Country 2024 & 2032
List of Tables
- Table 1: Global US LNG Bunkering Industry Revenue Million Forecast, by Region 2019 & 2032
- Table 2: Global US LNG Bunkering Industry Revenue Million Forecast, by End-User 2019 & 2032
- Table 3: Global US LNG Bunkering Industry Revenue Million Forecast, by Region 2019 & 2032
- Table 4: Global US LNG Bunkering Industry Revenue Million Forecast, by Country 2019 & 2032
- Table 5: Northeast US LNG Bunkering Industry Revenue (Million) Forecast, by Application 2019 & 2032
- Table 6: Southeast US LNG Bunkering Industry Revenue (Million) Forecast, by Application 2019 & 2032
- Table 7: Midwest US LNG Bunkering Industry Revenue (Million) Forecast, by Application 2019 & 2032
- Table 8: Southwest US LNG Bunkering Industry Revenue (Million) Forecast, by Application 2019 & 2032
- Table 9: West US LNG Bunkering Industry Revenue (Million) Forecast, by Application 2019 & 2032
- Table 10: Global US LNG Bunkering Industry Revenue Million Forecast, by End-User 2019 & 2032
- Table 11: Global US LNG Bunkering Industry Revenue Million Forecast, by Country 2019 & 2032
- Table 12: United States US LNG Bunkering Industry Revenue (Million) Forecast, by Application 2019 & 2032
- Table 13: Canada US LNG Bunkering Industry Revenue (Million) Forecast, by Application 2019 & 2032
- Table 14: Mexico US LNG Bunkering Industry Revenue (Million) Forecast, by Application 2019 & 2032
- Table 15: Global US LNG Bunkering Industry Revenue Million Forecast, by End-User 2019 & 2032
- Table 16: Global US LNG Bunkering Industry Revenue Million Forecast, by Country 2019 & 2032
- Table 17: Brazil US LNG Bunkering Industry Revenue (Million) Forecast, by Application 2019 & 2032
- Table 18: Argentina US LNG Bunkering Industry Revenue (Million) Forecast, by Application 2019 & 2032
- Table 19: Rest of South America US LNG Bunkering Industry Revenue (Million) Forecast, by Application 2019 & 2032
- Table 20: Global US LNG Bunkering Industry Revenue Million Forecast, by End-User 2019 & 2032
- Table 21: Global US LNG Bunkering Industry Revenue Million Forecast, by Country 2019 & 2032
- Table 22: United Kingdom US LNG Bunkering Industry Revenue (Million) Forecast, by Application 2019 & 2032
- Table 23: Germany US LNG Bunkering Industry Revenue (Million) Forecast, by Application 2019 & 2032
- Table 24: France US LNG Bunkering Industry Revenue (Million) Forecast, by Application 2019 & 2032
- Table 25: Italy US LNG Bunkering Industry Revenue (Million) Forecast, by Application 2019 & 2032
- Table 26: Spain US LNG Bunkering Industry Revenue (Million) Forecast, by Application 2019 & 2032
- Table 27: Russia US LNG Bunkering Industry Revenue (Million) Forecast, by Application 2019 & 2032
- Table 28: Benelux US LNG Bunkering Industry Revenue (Million) Forecast, by Application 2019 & 2032
- Table 29: Nordics US LNG Bunkering Industry Revenue (Million) Forecast, by Application 2019 & 2032
- Table 30: Rest of Europe US LNG Bunkering Industry Revenue (Million) Forecast, by Application 2019 & 2032
- Table 31: Global US LNG Bunkering Industry Revenue Million Forecast, by End-User 2019 & 2032
- Table 32: Global US LNG Bunkering Industry Revenue Million Forecast, by Country 2019 & 2032
- Table 33: Turkey US LNG Bunkering Industry Revenue (Million) Forecast, by Application 2019 & 2032
- Table 34: Israel US LNG Bunkering Industry Revenue (Million) Forecast, by Application 2019 & 2032
- Table 35: GCC US LNG Bunkering Industry Revenue (Million) Forecast, by Application 2019 & 2032
- Table 36: North Africa US LNG Bunkering Industry Revenue (Million) Forecast, by Application 2019 & 2032
- Table 37: South Africa US LNG Bunkering Industry Revenue (Million) Forecast, by Application 2019 & 2032
- Table 38: Rest of Middle East & Africa US LNG Bunkering Industry Revenue (Million) Forecast, by Application 2019 & 2032
- Table 39: Global US LNG Bunkering Industry Revenue Million Forecast, by End-User 2019 & 2032
- Table 40: Global US LNG Bunkering Industry Revenue Million Forecast, by Country 2019 & 2032
- Table 41: China US LNG Bunkering Industry Revenue (Million) Forecast, by Application 2019 & 2032
- Table 42: India US LNG Bunkering Industry Revenue (Million) Forecast, by Application 2019 & 2032
- Table 43: Japan US LNG Bunkering Industry Revenue (Million) Forecast, by Application 2019 & 2032
- Table 44: South Korea US LNG Bunkering Industry Revenue (Million) Forecast, by Application 2019 & 2032
- Table 45: ASEAN US LNG Bunkering Industry Revenue (Million) Forecast, by Application 2019 & 2032
- Table 46: Oceania US LNG Bunkering Industry Revenue (Million) Forecast, by Application 2019 & 2032
- Table 47: Rest of Asia Pacific US LNG Bunkering Industry Revenue (Million) Forecast, by Application 2019 & 2032
Frequently Asked Questions
1. What is the projected Compound Annual Growth Rate (CAGR) of the US LNG Bunkering Industry?
The projected CAGR is approximately > 5.20%.
2. Which companies are prominent players in the US LNG Bunkering Industry?
Key companies in the market include NorthStar Holdco Energy LLC, Harvey Gulf International Marine LLC, Eagle LNG Partners LLC, Crowley Maritime Corporation, Royal Dutch Shell PLC, Conrad Shipyards LLC, JAX LNG LLC.
3. What are the main segments of the US LNG Bunkering Industry?
The market segments include End-User.
4. Can you provide details about the market size?
The market size is estimated to be USD XX Million as of 2022.
5. What are some drivers contributing to market growth?
4.; Increasing Production from Unconventional Sources4.; Growing Energy Demand in the Region.
6. What are the notable trends driving market growth?
Container Fleet is Expected to Dominate in the Market.
7. Are there any restraints impacting market growth?
4.; Environmental Concerns.
8. Can you provide examples of recent developments in the market?
N/A
9. What pricing options are available for accessing the report?
Pricing options include single-user, multi-user, and enterprise licenses priced at USD 3800, USD 4500, and USD 5800 respectively.
10. Is the market size provided in terms of value or volume?
The market size is provided in terms of value, measured in Million.
11. Are there any specific market keywords associated with the report?
Yes, the market keyword associated with the report is "US LNG Bunkering Industry," which aids in identifying and referencing the specific market segment covered.
12. How do I determine which pricing option suits my needs best?
The pricing options vary based on user requirements and access needs. Individual users may opt for single-user licenses, while businesses requiring broader access may choose multi-user or enterprise licenses for cost-effective access to the report.
13. Are there any additional resources or data provided in the US LNG Bunkering Industry report?
While the report offers comprehensive insights, it's advisable to review the specific contents or supplementary materials provided to ascertain if additional resources or data are available.
14. How can I stay updated on further developments or reports in the US LNG Bunkering Industry?
To stay informed about further developments, trends, and reports in the US LNG Bunkering Industry, consider subscribing to industry newsletters, following relevant companies and organizations, or regularly checking reputable industry news sources and publications.
Methodology
Step 1 - Identification of Relevant Samples Size from Population Database


Step 2 - Approaches for Defining Global Market Size (Value, Volume* & Price*)

Note*: In applicable scenarios
Step 3 - Data Sources
Primary Research
- Web Analytics
- Survey Reports
- Research Institute
- Latest Research Reports
- Opinion Leaders
Secondary Research
- Annual Reports
- White Paper
- Latest Press Release
- Industry Association
- Paid Database
- Investor Presentations

Step 4 - Data Triangulation
Involves using different sources of information in order to increase the validity of a study
These sources are likely to be stakeholders in a program - participants, other researchers, program staff, other community members, and so on.
Then we put all data in single framework & apply various statistical tools to find out the dynamic on the market.
During the analysis stage, feedback from the stakeholder groups would be compared to determine areas of agreement as well as areas of divergence


