US Oil and Gas Midstream Market: Competitive Landscape and Growth Trends 2025-2033

US Oil and Gas Midstream Market by Transportation, by Storage, by LNG Terminals, by North America (United States, Canada, Mexico), by South America (Brazil, Argentina, Rest of South America), by Europe (United Kingdom, Germany, France, Italy, Spain, Russia, Benelux, Nordics, Rest of Europe), by Middle East & Africa (Turkey, Israel, GCC, North Africa, South Africa, Rest of Middle East & Africa), by Asia Pacific (China, India, Japan, South Korea, ASEAN, Oceania, Rest of Asia Pacific) Forecast 2025-2033

Jul 3 2025
Base Year: 2024

197 Pages
Main Logo

US Oil and Gas Midstream Market: Competitive Landscape and Growth Trends 2025-2033


Home
Industries
Energy & Power
sponsor image
sponsor image
sponsor image
sponsor image
sponsor image

Tailored for you

  • In-depth Analysis Tailored to Specified Regions or Segments
  • Company Profiles Customized to User Preferences
  • Comprehensive Insights Focused on Specific Segments or Regions
  • Customized Evaluation of Competitive Landscape to Meet Your Needs
  • Tailored Customization to Address Other Specific Requirements
Ask for customization


Key Insights

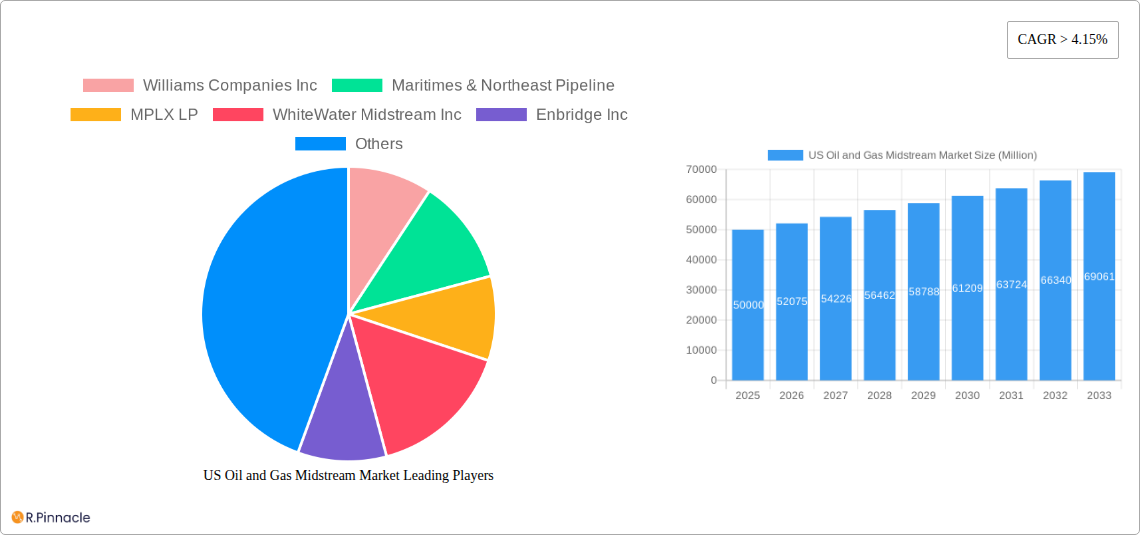
The US oil and gas midstream market, encompassing transportation, storage, and processing of oil, natural gas, and natural gas liquids (NGLs), is experiencing robust growth. Driven by increasing domestic energy production, particularly in shale formations, and rising demand for energy across various sectors, the market is projected to maintain a Compound Annual Growth Rate (CAGR) exceeding 4.15% from 2025 to 2033. Significant investments in pipeline infrastructure upgrades and expansions are further fueling this growth. The transportation segment, particularly pipelines, dominates the market, reflecting the reliance on efficient and cost-effective means to move large volumes of hydrocarbons across vast distances. However, regulatory hurdles related to environmental concerns and permitting processes pose a significant challenge, potentially slowing down project development in some regions. The market is segmented geographically, with regions like the Permian Basin and the Gulf Coast experiencing particularly high activity, attracting substantial investment and presenting significant opportunities for midstream companies. Furthermore, increasing focus on NGL processing and the expansion of export capabilities are contributing to market diversification and expansion.

The competitive landscape is characterized by a mix of large, integrated players and smaller, specialized companies. Major players leverage their scale and existing infrastructure to secure market share, while smaller companies focus on niche segments and emerging opportunities. The ongoing consolidation within the industry, driven by mergers and acquisitions, contributes to the market's dynamic nature. Technological advancements, such as automation and digitalization, are increasingly influencing operations, enhancing efficiency, and driving cost optimization. The ongoing shift towards a cleaner energy future, while representing a potential long-term challenge, is also creating opportunities for companies involved in carbon capture and storage, and the transportation of renewable natural gas. The forecast period of 2025-2033 holds promising prospects for the US oil and gas midstream market, contingent on sustained energy demand and continued investments in infrastructure.

US Oil and Gas Midstream Market Research Report - Market Size, Growth & Forecast

US Oil & Gas Midstream Market Report: 2019-2033

This comprehensive report provides an in-depth analysis of the US Oil & Gas Midstream market, offering actionable insights for industry professionals. Covering the period 2019-2033, with a base year of 2025, this report meticulously examines market structure, dynamics, leading players, and future growth potential. Leveraging extensive data and analysis, this report is crucial for strategic decision-making within the US Oil & Gas Midstream sector.

US Oil and Gas Midstream Market Market Structure & Innovation Trends

This section analyzes the competitive landscape, highlighting market concentration, innovation drivers, regulatory influences, and M&A activity within the US Oil & Gas Midstream market. The report details the market share of key players, exploring the impact of mergers and acquisitions on market dynamics. Deal values are analyzed to understand the financial implications of consolidation. The evolving regulatory framework, the emergence of product substitutes, and shifting end-user demographics are also thoroughly examined. The analysis includes a detailed examination of market concentration, identifying dominant players and assessing their strategies. Innovation drivers, including technological advancements and evolving consumer preferences, are highlighted, providing a comprehensive understanding of the forces shaping the market's future.

US Oil and Gas Midstream Market Growth

US Oil and Gas Midstream Market Market Dynamics & Trends

This section dives deep into the market's dynamic forces, providing a comprehensive understanding of market growth drivers, technological disruptions, consumer preferences, and the competitive dynamics influencing the US Oil and Gas Midstream market. We analyze the Compound Annual Growth Rate (CAGR) and market penetration rates to provide concrete insights into past performance and future expectations. The impact of technological advancements, such as automation and data analytics, on market efficiency and cost optimization is thoroughly examined. The influence of evolving consumer preferences and energy policies on market demand is also analyzed. Furthermore, the report explores the competitive landscape, highlighting key strategies adopted by major players and anticipating future competitive dynamics. The report also incorporates an analysis of market size projections and estimations (in Millions) for the forecast period. Estimated Market Size in 2025: $xx Million.

US Oil and Gas Midstream Market Growth

Dominant Regions & Segments in US Oil and Gas Midstream Market

This section identifies the leading regions and segments within the US Oil & Gas Midstream market, categorized by product (Oil, Gas, Natural Gas Liquids) and application (Transportation, Storage, Processing). The analysis delves into the factors driving dominance in these regions and segments, with detailed explanations supported by data.

  • Leading Regions: The report identifies the dominant region(s) based on factors such as infrastructure development, economic policies, and energy demand. Detailed analysis explains the reasons behind this dominance.
  • Leading Segments: The report will identify the leading product and application segments, explaining their contribution to the overall market size and future growth potential. Key drivers like infrastructure investment and technological advancements will be highlighted for each leading segment.

The analysis will consider factors such as government regulations, economic growth rates, and the availability of resources in shaping the dominance of certain regions and segments.

US Oil and Gas Midstream Market Product Innovations

This section highlights recent product innovations within the US Oil and Gas Midstream market. The discussion will focus on technological trends and the market fit of new products, emphasizing competitive advantages and the impact of these innovations on market dynamics. This will include discussions on efficiency improvements, cost reductions and advancements in safety features.

Report Scope & Segmentation Analysis

This report offers a comprehensive segmentation of the US Oil & Gas Midstream market across product types (Oil, Gas, Natural Gas Liquids) and applications (Transportation, Storage, Processing). Each segment's growth projection, market size, and competitive dynamics are provided.

  • Oil: Market size, growth projections, competitive landscape and key drivers of growth.
  • Gas: Market size, growth projections, competitive landscape and key drivers of growth.
  • Natural Gas Liquids: Market size, growth projections, competitive landscape and key drivers of growth.
  • Transportation: Market size, growth projections, competitive landscape and key drivers of growth.
  • Storage: Market size, growth projections, competitive landscape and key drivers of growth.
  • Processing: Market size, growth projections, competitive landscape and key drivers of growth.

Key Drivers of US Oil and Gas Midstream Market Growth

This section identifies the key factors driving the growth of the US Oil & Gas Midstream market, analyzing both technological advancements and economic and regulatory factors. Specific examples will illustrate the impact of these drivers on market expansion. Examples include increased demand for energy, government incentives for infrastructure development, technological advancements for energy efficiency and pipeline modernization initiatives.

Challenges in the US Oil and Gas Midstream Market Sector

This section highlights the challenges and restraints facing the US Oil & Gas Midstream market. The report will address regulatory hurdles, supply chain complexities, and competitive pressures, quantifying their impact on market growth. This could include environmental regulations, permitting delays, material cost increases and increasing competition from renewable energy sources.

Emerging Opportunities in US Oil and Gas Midstream Market

This section will explore emerging opportunities in the US Oil and Gas Midstream market, highlighting new markets, innovative technologies, and shifting consumer preferences. This may include exploration of new energy sources, the development of carbon capture technologies, and the implementation of smart technologies for improved infrastructure management.

Leading Players in the US Oil and Gas Midstream Market Market

This section lists the leading players in the US Oil & Gas Midstream market:

  • Williams Companies Inc
  • Maritimes & Northeast Pipeline
  • MPLX LP
  • WhiteWater Midstream Inc
  • Enbridge Inc
  • Atlantic Coast Pipeline
  • Enterprise Products Partners LP
  • Energy Transfer Operating LP
  • ONEOK Gas Transportation LLC
  • Plains All American Pipeline LP
  • Kinder Morgan Inc

Key Developments in US Oil and Gas Midstream Market Industry

This section details key developments impacting the US Oil & Gas Midstream market:

  • March 2022: New Fortress Energy Inc. announced two 20-year sale and purchase agreements (SPA) with Venture Global LNG, securing 2 million tonnes per annum (MTPA) of LNG. This significantly increases LNG supply and strengthens the market position of both companies.
  • November 2020: The Saginaw Trail Pipeline entered service, adding 200 MMcf/d (5.66 MMcm/d) of capacity. This expansion enhances natural gas transportation capabilities in central Michigan.

Future Outlook for US Oil and Gas Midstream Market Market

This section summarizes the growth accelerators and future potential of the US Oil & Gas Midstream market. The analysis will include discussion of the long-term growth prospects, considering factors such as technological advancements, government policies, and evolving energy demands. The report concludes by highlighting strategic opportunities for market players to capitalize on these factors. The potential for market expansion in specific geographical areas will also be discussed.

US Oil and Gas Midstream Market Segmentation

  • 1. Transportation
  • 2. Storage
  • 3. LNG Terminals

US Oil and Gas Midstream Market Segmentation By Geography

  • 1. North America
    • 1.1. United States
    • 1.2. Canada
    • 1.3. Mexico
  • 2. South America
    • 2.1. Brazil
    • 2.2. Argentina
    • 2.3. Rest of South America
  • 3. Europe
    • 3.1. United Kingdom
    • 3.2. Germany
    • 3.3. France
    • 3.4. Italy
    • 3.5. Spain
    • 3.6. Russia
    • 3.7. Benelux
    • 3.8. Nordics
    • 3.9. Rest of Europe
  • 4. Middle East & Africa
    • 4.1. Turkey
    • 4.2. Israel
    • 4.3. GCC
    • 4.4. North Africa
    • 4.5. South Africa
    • 4.6. Rest of Middle East & Africa
  • 5. Asia Pacific
    • 5.1. China
    • 5.2. India
    • 5.3. Japan
    • 5.4. South Korea
    • 5.5. ASEAN
    • 5.6. Oceania
    • 5.7. Rest of Asia Pacific
US Oil and Gas Midstream Market Regional Share


US Oil and Gas Midstream Market REPORT HIGHLIGHTS

AspectsDetails
Study Period 2019-2033
Base Year 2024
Estimated Year 2025
Forecast Period2025-2033
Historical Period2019-2024
Growth RateCAGR of > 4.15% from 2019-2033
Segmentation
    • By Transportation
    • By Storage
    • By LNG Terminals
  • By Geography
    • North America
      • United States
      • Canada
      • Mexico
    • South America
      • Brazil
      • Argentina
      • Rest of South America
    • Europe
      • United Kingdom
      • Germany
      • France
      • Italy
      • Spain
      • Russia
      • Benelux
      • Nordics
      • Rest of Europe
    • Middle East & Africa
      • Turkey
      • Israel
      • GCC
      • North Africa
      • South Africa
      • Rest of Middle East & Africa
    • Asia Pacific
      • China
      • India
      • Japan
      • South Korea
      • ASEAN
      • Oceania
      • Rest of Asia Pacific


Table of Contents

  1. 1. Introduction
    • 1.1. Research Scope
    • 1.2. Market Segmentation
    • 1.3. Research Methodology
    • 1.4. Definitions and Assumptions
  2. 2. Executive Summary
    • 2.1. Introduction
  3. 3. Market Dynamics
    • 3.1. Introduction
      • 3.2. Market Drivers
        • 3.2.1. An Increase in the Use of LNG as an Energy Source
      • 3.3. Market Restrains
        • 3.3.1. Increasing Adoption of Solar and Wind Energy
      • 3.4. Market Trends
        • 3.4.1. The Transportation Segment Expected to Dominate the Market
  4. 4. Market Factor Analysis
    • 4.1. Porters Five Forces
    • 4.2. Supply/Value Chain
    • 4.3. PESTEL analysis
    • 4.4. Market Entropy
    • 4.5. Patent/Trademark Analysis
  5. 5. Global US Oil and Gas Midstream Market Analysis, Insights and Forecast, 2019-2031
    • 5.1. Market Analysis, Insights and Forecast - by Transportation
      • 5.2. Market Analysis, Insights and Forecast - by Storage
        • 5.3. Market Analysis, Insights and Forecast - by LNG Terminals
          • 5.4. Market Analysis, Insights and Forecast - by Region
            • 5.4.1. North America
            • 5.4.2. South America
            • 5.4.3. Europe
            • 5.4.4. Middle East & Africa
            • 5.4.5. Asia Pacific
        • 6. North America US Oil and Gas Midstream Market Analysis, Insights and Forecast, 2019-2031
          • 6.1. Market Analysis, Insights and Forecast - by Transportation
            • 6.2. Market Analysis, Insights and Forecast - by Storage
              • 6.3. Market Analysis, Insights and Forecast - by LNG Terminals
              • 7. South America US Oil and Gas Midstream Market Analysis, Insights and Forecast, 2019-2031
                • 7.1. Market Analysis, Insights and Forecast - by Transportation
                  • 7.2. Market Analysis, Insights and Forecast - by Storage
                    • 7.3. Market Analysis, Insights and Forecast - by LNG Terminals
                    • 8. Europe US Oil and Gas Midstream Market Analysis, Insights and Forecast, 2019-2031
                      • 8.1. Market Analysis, Insights and Forecast - by Transportation
                        • 8.2. Market Analysis, Insights and Forecast - by Storage
                          • 8.3. Market Analysis, Insights and Forecast - by LNG Terminals
                          • 9. Middle East & Africa US Oil and Gas Midstream Market Analysis, Insights and Forecast, 2019-2031
                            • 9.1. Market Analysis, Insights and Forecast - by Transportation
                              • 9.2. Market Analysis, Insights and Forecast - by Storage
                                • 9.3. Market Analysis, Insights and Forecast - by LNG Terminals
                                • 10. Asia Pacific US Oil and Gas Midstream Market Analysis, Insights and Forecast, 2019-2031
                                  • 10.1. Market Analysis, Insights and Forecast - by Transportation
                                    • 10.2. Market Analysis, Insights and Forecast - by Storage
                                      • 10.3. Market Analysis, Insights and Forecast - by LNG Terminals
                                      • 11. Northeast US Oil and Gas Midstream Market Analysis, Insights and Forecast, 2019-2031
                                        • 12. Southeast US Oil and Gas Midstream Market Analysis, Insights and Forecast, 2019-2031
                                          • 13. Midwest US Oil and Gas Midstream Market Analysis, Insights and Forecast, 2019-2031
                                            • 14. Southwest US Oil and Gas Midstream Market Analysis, Insights and Forecast, 2019-2031
                                              • 15. West US Oil and Gas Midstream Market Analysis, Insights and Forecast, 2019-2031
                                                • 16. Competitive Analysis
                                                  • 16.1. Global Market Share Analysis 2024
                                                    • 16.2. Company Profiles
                                                      • 16.2.1 Williams Companies Inc
                                                        • 16.2.1.1. Overview
                                                        • 16.2.1.2. Products
                                                        • 16.2.1.3. SWOT Analysis
                                                        • 16.2.1.4. Recent Developments
                                                        • 16.2.1.5. Financials (Based on Availability)
                                                      • 16.2.2 Maritimes & Northeast Pipeline
                                                        • 16.2.2.1. Overview
                                                        • 16.2.2.2. Products
                                                        • 16.2.2.3. SWOT Analysis
                                                        • 16.2.2.4. Recent Developments
                                                        • 16.2.2.5. Financials (Based on Availability)
                                                      • 16.2.3 MPLX LP
                                                        • 16.2.3.1. Overview
                                                        • 16.2.3.2. Products
                                                        • 16.2.3.3. SWOT Analysis
                                                        • 16.2.3.4. Recent Developments
                                                        • 16.2.3.5. Financials (Based on Availability)
                                                      • 16.2.4 WhiteWater Midstream Inc
                                                        • 16.2.4.1. Overview
                                                        • 16.2.4.2. Products
                                                        • 16.2.4.3. SWOT Analysis
                                                        • 16.2.4.4. Recent Developments
                                                        • 16.2.4.5. Financials (Based on Availability)
                                                      • 16.2.5 Enbridge Inc
                                                        • 16.2.5.1. Overview
                                                        • 16.2.5.2. Products
                                                        • 16.2.5.3. SWOT Analysis
                                                        • 16.2.5.4. Recent Developments
                                                        • 16.2.5.5. Financials (Based on Availability)
                                                      • 16.2.6 Atlantic Coast Pipeline
                                                        • 16.2.6.1. Overview
                                                        • 16.2.6.2. Products
                                                        • 16.2.6.3. SWOT Analysis
                                                        • 16.2.6.4. Recent Developments
                                                        • 16.2.6.5. Financials (Based on Availability)
                                                      • 16.2.7 Enterprise Products Partners LP
                                                        • 16.2.7.1. Overview
                                                        • 16.2.7.2. Products
                                                        • 16.2.7.3. SWOT Analysis
                                                        • 16.2.7.4. Recent Developments
                                                        • 16.2.7.5. Financials (Based on Availability)
                                                      • 16.2.8 Energy Transfer Operating LP
                                                        • 16.2.8.1. Overview
                                                        • 16.2.8.2. Products
                                                        • 16.2.8.3. SWOT Analysis
                                                        • 16.2.8.4. Recent Developments
                                                        • 16.2.8.5. Financials (Based on Availability)
                                                      • 16.2.9 ONEOK Gas Transportation LLC
                                                        • 16.2.9.1. Overview
                                                        • 16.2.9.2. Products
                                                        • 16.2.9.3. SWOT Analysis
                                                        • 16.2.9.4. Recent Developments
                                                        • 16.2.9.5. Financials (Based on Availability)
                                                      • 16.2.10 Plains All American Pipeline LP
                                                        • 16.2.10.1. Overview
                                                        • 16.2.10.2. Products
                                                        • 16.2.10.3. SWOT Analysis
                                                        • 16.2.10.4. Recent Developments
                                                        • 16.2.10.5. Financials (Based on Availability)
                                                      • 16.2.11 Kinder Morgan Inc
                                                        • 16.2.11.1. Overview
                                                        • 16.2.11.2. Products
                                                        • 16.2.11.3. SWOT Analysis
                                                        • 16.2.11.4. Recent Developments
                                                        • 16.2.11.5. Financials (Based on Availability)

                                                List of Figures

                                                1. Figure 1: Global US Oil and Gas Midstream Market Revenue Breakdown (Million, %) by Region 2024 & 2032
                                                2. Figure 2: United states US Oil and Gas Midstream Market Revenue (Million), by Country 2024 & 2032
                                                3. Figure 3: United states US Oil and Gas Midstream Market Revenue Share (%), by Country 2024 & 2032
                                                4. Figure 4: North America US Oil and Gas Midstream Market Revenue (Million), by Transportation 2024 & 2032
                                                5. Figure 5: North America US Oil and Gas Midstream Market Revenue Share (%), by Transportation 2024 & 2032
                                                6. Figure 6: North America US Oil and Gas Midstream Market Revenue (Million), by Storage 2024 & 2032
                                                7. Figure 7: North America US Oil and Gas Midstream Market Revenue Share (%), by Storage 2024 & 2032
                                                8. Figure 8: North America US Oil and Gas Midstream Market Revenue (Million), by LNG Terminals 2024 & 2032
                                                9. Figure 9: North America US Oil and Gas Midstream Market Revenue Share (%), by LNG Terminals 2024 & 2032
                                                10. Figure 10: North America US Oil and Gas Midstream Market Revenue (Million), by Country 2024 & 2032
                                                11. Figure 11: North America US Oil and Gas Midstream Market Revenue Share (%), by Country 2024 & 2032
                                                12. Figure 12: South America US Oil and Gas Midstream Market Revenue (Million), by Transportation 2024 & 2032
                                                13. Figure 13: South America US Oil and Gas Midstream Market Revenue Share (%), by Transportation 2024 & 2032
                                                14. Figure 14: South America US Oil and Gas Midstream Market Revenue (Million), by Storage 2024 & 2032
                                                15. Figure 15: South America US Oil and Gas Midstream Market Revenue Share (%), by Storage 2024 & 2032
                                                16. Figure 16: South America US Oil and Gas Midstream Market Revenue (Million), by LNG Terminals 2024 & 2032
                                                17. Figure 17: South America US Oil and Gas Midstream Market Revenue Share (%), by LNG Terminals 2024 & 2032
                                                18. Figure 18: South America US Oil and Gas Midstream Market Revenue (Million), by Country 2024 & 2032
                                                19. Figure 19: South America US Oil and Gas Midstream Market Revenue Share (%), by Country 2024 & 2032
                                                20. Figure 20: Europe US Oil and Gas Midstream Market Revenue (Million), by Transportation 2024 & 2032
                                                21. Figure 21: Europe US Oil and Gas Midstream Market Revenue Share (%), by Transportation 2024 & 2032
                                                22. Figure 22: Europe US Oil and Gas Midstream Market Revenue (Million), by Storage 2024 & 2032
                                                23. Figure 23: Europe US Oil and Gas Midstream Market Revenue Share (%), by Storage 2024 & 2032
                                                24. Figure 24: Europe US Oil and Gas Midstream Market Revenue (Million), by LNG Terminals 2024 & 2032
                                                25. Figure 25: Europe US Oil and Gas Midstream Market Revenue Share (%), by LNG Terminals 2024 & 2032
                                                26. Figure 26: Europe US Oil and Gas Midstream Market Revenue (Million), by Country 2024 & 2032
                                                27. Figure 27: Europe US Oil and Gas Midstream Market Revenue Share (%), by Country 2024 & 2032
                                                28. Figure 28: Middle East & Africa US Oil and Gas Midstream Market Revenue (Million), by Transportation 2024 & 2032
                                                29. Figure 29: Middle East & Africa US Oil and Gas Midstream Market Revenue Share (%), by Transportation 2024 & 2032
                                                30. Figure 30: Middle East & Africa US Oil and Gas Midstream Market Revenue (Million), by Storage 2024 & 2032
                                                31. Figure 31: Middle East & Africa US Oil and Gas Midstream Market Revenue Share (%), by Storage 2024 & 2032
                                                32. Figure 32: Middle East & Africa US Oil and Gas Midstream Market Revenue (Million), by LNG Terminals 2024 & 2032
                                                33. Figure 33: Middle East & Africa US Oil and Gas Midstream Market Revenue Share (%), by LNG Terminals 2024 & 2032
                                                34. Figure 34: Middle East & Africa US Oil and Gas Midstream Market Revenue (Million), by Country 2024 & 2032
                                                35. Figure 35: Middle East & Africa US Oil and Gas Midstream Market Revenue Share (%), by Country 2024 & 2032
                                                36. Figure 36: Asia Pacific US Oil and Gas Midstream Market Revenue (Million), by Transportation 2024 & 2032
                                                37. Figure 37: Asia Pacific US Oil and Gas Midstream Market Revenue Share (%), by Transportation 2024 & 2032
                                                38. Figure 38: Asia Pacific US Oil and Gas Midstream Market Revenue (Million), by Storage 2024 & 2032
                                                39. Figure 39: Asia Pacific US Oil and Gas Midstream Market Revenue Share (%), by Storage 2024 & 2032
                                                40. Figure 40: Asia Pacific US Oil and Gas Midstream Market Revenue (Million), by LNG Terminals 2024 & 2032
                                                41. Figure 41: Asia Pacific US Oil and Gas Midstream Market Revenue Share (%), by LNG Terminals 2024 & 2032
                                                42. Figure 42: Asia Pacific US Oil and Gas Midstream Market Revenue (Million), by Country 2024 & 2032
                                                43. Figure 43: Asia Pacific US Oil and Gas Midstream Market Revenue Share (%), by Country 2024 & 2032

                                                List of Tables

                                                1. Table 1: Global US Oil and Gas Midstream Market Revenue Million Forecast, by Region 2019 & 2032
                                                2. Table 2: Global US Oil and Gas Midstream Market Revenue Million Forecast, by Transportation 2019 & 2032
                                                3. Table 3: Global US Oil and Gas Midstream Market Revenue Million Forecast, by Storage 2019 & 2032
                                                4. Table 4: Global US Oil and Gas Midstream Market Revenue Million Forecast, by LNG Terminals 2019 & 2032
                                                5. Table 5: Global US Oil and Gas Midstream Market Revenue Million Forecast, by Region 2019 & 2032
                                                6. Table 6: Global US Oil and Gas Midstream Market Revenue Million Forecast, by Country 2019 & 2032
                                                7. Table 7: Northeast US Oil and Gas Midstream Market Revenue (Million) Forecast, by Application 2019 & 2032
                                                8. Table 8: Southeast US Oil and Gas Midstream Market Revenue (Million) Forecast, by Application 2019 & 2032
                                                9. Table 9: Midwest US Oil and Gas Midstream Market Revenue (Million) Forecast, by Application 2019 & 2032
                                                10. Table 10: Southwest US Oil and Gas Midstream Market Revenue (Million) Forecast, by Application 2019 & 2032
                                                11. Table 11: West US Oil and Gas Midstream Market Revenue (Million) Forecast, by Application 2019 & 2032
                                                12. Table 12: Global US Oil and Gas Midstream Market Revenue Million Forecast, by Transportation 2019 & 2032
                                                13. Table 13: Global US Oil and Gas Midstream Market Revenue Million Forecast, by Storage 2019 & 2032
                                                14. Table 14: Global US Oil and Gas Midstream Market Revenue Million Forecast, by LNG Terminals 2019 & 2032
                                                15. Table 15: Global US Oil and Gas Midstream Market Revenue Million Forecast, by Country 2019 & 2032
                                                16. Table 16: United States US Oil and Gas Midstream Market Revenue (Million) Forecast, by Application 2019 & 2032
                                                17. Table 17: Canada US Oil and Gas Midstream Market Revenue (Million) Forecast, by Application 2019 & 2032
                                                18. Table 18: Mexico US Oil and Gas Midstream Market Revenue (Million) Forecast, by Application 2019 & 2032
                                                19. Table 19: Global US Oil and Gas Midstream Market Revenue Million Forecast, by Transportation 2019 & 2032
                                                20. Table 20: Global US Oil and Gas Midstream Market Revenue Million Forecast, by Storage 2019 & 2032
                                                21. Table 21: Global US Oil and Gas Midstream Market Revenue Million Forecast, by LNG Terminals 2019 & 2032
                                                22. Table 22: Global US Oil and Gas Midstream Market Revenue Million Forecast, by Country 2019 & 2032
                                                23. Table 23: Brazil US Oil and Gas Midstream Market Revenue (Million) Forecast, by Application 2019 & 2032
                                                24. Table 24: Argentina US Oil and Gas Midstream Market Revenue (Million) Forecast, by Application 2019 & 2032
                                                25. Table 25: Rest of South America US Oil and Gas Midstream Market Revenue (Million) Forecast, by Application 2019 & 2032
                                                26. Table 26: Global US Oil and Gas Midstream Market Revenue Million Forecast, by Transportation 2019 & 2032
                                                27. Table 27: Global US Oil and Gas Midstream Market Revenue Million Forecast, by Storage 2019 & 2032
                                                28. Table 28: Global US Oil and Gas Midstream Market Revenue Million Forecast, by LNG Terminals 2019 & 2032
                                                29. Table 29: Global US Oil and Gas Midstream Market Revenue Million Forecast, by Country 2019 & 2032
                                                30. Table 30: United Kingdom US Oil and Gas Midstream Market Revenue (Million) Forecast, by Application 2019 & 2032
                                                31. Table 31: Germany US Oil and Gas Midstream Market Revenue (Million) Forecast, by Application 2019 & 2032
                                                32. Table 32: France US Oil and Gas Midstream Market Revenue (Million) Forecast, by Application 2019 & 2032
                                                33. Table 33: Italy US Oil and Gas Midstream Market Revenue (Million) Forecast, by Application 2019 & 2032
                                                34. Table 34: Spain US Oil and Gas Midstream Market Revenue (Million) Forecast, by Application 2019 & 2032
                                                35. Table 35: Russia US Oil and Gas Midstream Market Revenue (Million) Forecast, by Application 2019 & 2032
                                                36. Table 36: Benelux US Oil and Gas Midstream Market Revenue (Million) Forecast, by Application 2019 & 2032
                                                37. Table 37: Nordics US Oil and Gas Midstream Market Revenue (Million) Forecast, by Application 2019 & 2032
                                                38. Table 38: Rest of Europe US Oil and Gas Midstream Market Revenue (Million) Forecast, by Application 2019 & 2032
                                                39. Table 39: Global US Oil and Gas Midstream Market Revenue Million Forecast, by Transportation 2019 & 2032
                                                40. Table 40: Global US Oil and Gas Midstream Market Revenue Million Forecast, by Storage 2019 & 2032
                                                41. Table 41: Global US Oil and Gas Midstream Market Revenue Million Forecast, by LNG Terminals 2019 & 2032
                                                42. Table 42: Global US Oil and Gas Midstream Market Revenue Million Forecast, by Country 2019 & 2032
                                                43. Table 43: Turkey US Oil and Gas Midstream Market Revenue (Million) Forecast, by Application 2019 & 2032
                                                44. Table 44: Israel US Oil and Gas Midstream Market Revenue (Million) Forecast, by Application 2019 & 2032
                                                45. Table 45: GCC US Oil and Gas Midstream Market Revenue (Million) Forecast, by Application 2019 & 2032
                                                46. Table 46: North Africa US Oil and Gas Midstream Market Revenue (Million) Forecast, by Application 2019 & 2032
                                                47. Table 47: South Africa US Oil and Gas Midstream Market Revenue (Million) Forecast, by Application 2019 & 2032
                                                48. Table 48: Rest of Middle East & Africa US Oil and Gas Midstream Market Revenue (Million) Forecast, by Application 2019 & 2032
                                                49. Table 49: Global US Oil and Gas Midstream Market Revenue Million Forecast, by Transportation 2019 & 2032
                                                50. Table 50: Global US Oil and Gas Midstream Market Revenue Million Forecast, by Storage 2019 & 2032
                                                51. Table 51: Global US Oil and Gas Midstream Market Revenue Million Forecast, by LNG Terminals 2019 & 2032
                                                52. Table 52: Global US Oil and Gas Midstream Market Revenue Million Forecast, by Country 2019 & 2032
                                                53. Table 53: China US Oil and Gas Midstream Market Revenue (Million) Forecast, by Application 2019 & 2032
                                                54. Table 54: India US Oil and Gas Midstream Market Revenue (Million) Forecast, by Application 2019 & 2032
                                                55. Table 55: Japan US Oil and Gas Midstream Market Revenue (Million) Forecast, by Application 2019 & 2032
                                                56. Table 56: South Korea US Oil and Gas Midstream Market Revenue (Million) Forecast, by Application 2019 & 2032
                                                57. Table 57: ASEAN US Oil and Gas Midstream Market Revenue (Million) Forecast, by Application 2019 & 2032
                                                58. Table 58: Oceania US Oil and Gas Midstream Market Revenue (Million) Forecast, by Application 2019 & 2032
                                                59. Table 59: Rest of Asia Pacific US Oil and Gas Midstream Market Revenue (Million) Forecast, by Application 2019 & 2032


                                                Frequently Asked Questions

                                                1. What is the projected Compound Annual Growth Rate (CAGR) of the US Oil and Gas Midstream Market?

                                                The projected CAGR is approximately > 4.15%.

                                                2. Which companies are prominent players in the US Oil and Gas Midstream Market?

                                                Key companies in the market include Williams Companies Inc, Maritimes & Northeast Pipeline, MPLX LP, WhiteWater Midstream Inc, Enbridge Inc, Atlantic Coast Pipeline, Enterprise Products Partners LP, Energy Transfer Operating LP, ONEOK Gas Transportation LLC, Plains All American Pipeline LP, Kinder Morgan Inc.

                                                3. What are the main segments of the US Oil and Gas Midstream Market?

                                                The market segments include Transportation, Storage, LNG Terminals.

                                                4. Can you provide details about the market size?

                                                The market size is estimated to be USD XX Million as of 2022.

                                                5. What are some drivers contributing to market growth?

                                                An Increase in the Use of LNG as an Energy Source.

                                                6. What are the notable trends driving market growth?

                                                The Transportation Segment Expected to Dominate the Market.

                                                7. Are there any restraints impacting market growth?

                                                Increasing Adoption of Solar and Wind Energy.

                                                8. Can you provide examples of recent developments in the market?

                                                In March 2022, New Fortress Energy Inc. announced the execution of two 20-year sale and purchase agreements (SPA) with Venture Global LNG. Under the agreement, Venture Global will supply 2 million tonnes per annum (MTPA) of LNG on a free on board (FOB) basis from its LNG facilities in Louisiana.

                                                9. What pricing options are available for accessing the report?

                                                Pricing options include single-user, multi-user, and enterprise licenses priced at USD 3800, USD 4500, and USD 5800 respectively.

                                                10. Is the market size provided in terms of value or volume?

                                                The market size is provided in terms of value, measured in Million.

                                                11. Are there any specific market keywords associated with the report?

                                                Yes, the market keyword associated with the report is "US Oil and Gas Midstream Market," which aids in identifying and referencing the specific market segment covered.

                                                12. How do I determine which pricing option suits my needs best?

                                                The pricing options vary based on user requirements and access needs. Individual users may opt for single-user licenses, while businesses requiring broader access may choose multi-user or enterprise licenses for cost-effective access to the report.

                                                13. Are there any additional resources or data provided in the US Oil and Gas Midstream Market report?

                                                While the report offers comprehensive insights, it's advisable to review the specific contents or supplementary materials provided to ascertain if additional resources or data are available.

                                                14. How can I stay updated on further developments or reports in the US Oil and Gas Midstream Market?

                                                To stay informed about further developments, trends, and reports in the US Oil and Gas Midstream Market, consider subscribing to industry newsletters, following relevant companies and organizations, or regularly checking reputable industry news sources and publications.


                                                Methodology

                                                Step 1 - Identification of Relevant Samples Size from Population Database

                                                Step Chart
                                                Bar Chart
                                                Method Chart

                                                Step 2 - Approaches for Defining Global Market Size (Value, Volume* & Price*)

                                                Approach Chart
                                                Top-down and bottom-up approaches are used to validate the global market size and estimate the market size for manufactures, regional segments, product, and application.

                                                Note*: In applicable scenarios

                                                Step 3 - Data Sources

                                                Primary Research

                                                • Web Analytics
                                                • Survey Reports
                                                • Research Institute
                                                • Latest Research Reports
                                                • Opinion Leaders

                                                Secondary Research

                                                • Annual Reports
                                                • White Paper
                                                • Latest Press Release
                                                • Industry Association
                                                • Paid Database
                                                • Investor Presentations
                                                Analyst Chart

                                                Step 4 - Data Triangulation

                                                Involves using different sources of information in order to increase the validity of a study

                                                These sources are likely to be stakeholders in a program - participants, other researchers, program staff, other community members, and so on.

                                                Then we put all data in single framework & apply various statistical tools to find out the dynamic on the market.

                                                During the analysis stage, feedback from the stakeholder groups would be compared to determine areas of agreement as well as areas of divergence

                                                Additionally, after gathering mixed and scattered data from a wide range of sources, data is triangulated and correlated to come up with estimated figures which are further validated through primary mediums or industry experts, opinion leaders.

                                                About Report Pinnacle

                                                Report Pinnacle provides top-tier market research, industry intelligence, and actionable insights for finance, technology, healthcare, and consumer sectors. Our reports empower you to make informed decisions and achieve business success.

                                                Our expert team combines primary research, data analytics, and industry knowledge to deliver insights you can trust. We offer syndicated reports, custom research, and consulting services tailored to your unique business needs.

                                                At Report Pinnacle, we are committed to quality, transparency, and client satisfaction. Every report is rigorously validated to ensure accuracy and relevance. Our global perspective and local expertise help you understand both broad trends and detailed market shifts.

                                                Stay ahead with Report Pinnacle. Subscribe to our newsletter for the latest insights and research highlights, and follow us on social media for real-time updates.

                                                Report Pinnacle – Your Partner for Reaching the Top in Market Intelligence.

                                                artwork spiralartwork spiralRelated Reports
                                                artwork underline

                                                Exploring Saudi Arabia Liner Hanger Market Growth Trajectories: CAGR Insights 2025-2033

                                                Discover the booming Saudi Arabia liner hanger market, projected to reach $390 million by 2033 with a CAGR exceeding 5.5%. This in-depth analysis explores market drivers, trends, restraints, and key players like Schlumberger and National Oilwell Varco, offering insights into regional distribution and future growth potential.

                                                July 2025
                                                Base Year: 2024
                                                No Of Pages: 197
                                                Price: $3800

                                                Solar Industry in Canada Growth Projections: Trends to Watch

                                                Discover the booming Canadian solar industry! Explore market size projections, growth trends (CAGR >11%), key players, and regional breakdowns for 2025-2033. Learn about the driving forces behind this renewable energy sector's expansion in Canada.

                                                July 2025
                                                Base Year: 2024
                                                No Of Pages: 197
                                                Price: $3800

                                                Unlocking Growth in Asia-Pacific Battery Recycling Market Market 2025-2033

                                                The Asia-Pacific battery recycling market is booming, driven by EV growth and environmental regulations. Learn about market size, CAGR, key players (Exide, GS Yuasa, CATL), and regional trends in our comprehensive analysis. Discover the opportunities and challenges shaping this rapidly expanding sector.

                                                July 2025
                                                Base Year: 2024
                                                No Of Pages: 234
                                                Price: $4750

                                                Comprehensive Review of North America Oil and Gas Electric Submersible Pump Industry Growth Potential

                                                Discover the booming North American oil and gas electric submersible pump (ESP) market. This comprehensive analysis reveals a CAGR exceeding 7%, driven by enhanced oil recovery, shale gas production, and technological advancements. Explore market size, key players (Schlumberger, Halliburton, Baker Hughes), and regional trends through 2033.

                                                July 2025
                                                Base Year: 2024
                                                No Of Pages: 234
                                                Price: $4750

                                                Microgrid Industry Navigating Dynamics Comprehensive Analysis and Forecasts 2025-2033

                                                Discover the booming microgrid market! Our analysis reveals a $15.92B market in 2025, growing at a 19.08% CAGR. Explore key drivers, trends, restraints, and regional insights for this rapidly expanding sector. Learn about leading companies and investment opportunities in renewable energy, remote power systems, and smart grid technologies.

                                                July 2025
                                                Base Year: 2024
                                                No Of Pages: 234
                                                Price: $4750

                                                Strategic Projections for Turkmenistan Oil & Gas Upstream Industry Market Expansion

                                                Discover the growth potential of Turkmenistan's oil & gas upstream industry. This comprehensive analysis reveals market size, CAGR, key players (Dragon Oil, CNPC), and future trends impacting this evolving sector from 2019-2033. Explore challenges and opportunities in onshore & offshore segments.

                                                July 2025
                                                Base Year: 2024
                                                No Of Pages: 197
                                                Price: $3800

                                                Dosing System Industry XX CAGR Growth Analysis 2025-2033

                                                Discover the booming dosing system market! Our analysis reveals a $7.46B market in 2025, projected to grow at a CAGR of 4.92% until 2033, driven by water treatment, oil & gas, and chemical processing. Explore market trends, key players (ProMinent, Nikkiso, IDEX), and regional insights.

                                                July 2025
                                                Base Year: 2024
                                                No Of Pages: 180
                                                Price: $4750

                                                Europe Large Wind Turbine Market XX CAGR Growth Outlook 2025-2033

                                                Discover the booming European large wind turbine market! This in-depth analysis reveals a €4.27B market in 2025, projected to grow at a 10.77% CAGR until 2033, driven by renewable energy targets and technological advancements. Explore key players, regional trends, and future growth opportunities in this dynamic sector.

                                                July 2025
                                                Base Year: 2024
                                                No Of Pages: 234
                                                Price: $4750

                                                Oman Directional Drilling Industry CAGR Growth Drivers and Trends: Forecasts 2025-2033

                                                Discover the booming Oman directional drilling market, projected to reach [estimated 2033 value] by 2033 with a CAGR exceeding 20.48%. This in-depth analysis explores market drivers, trends, restraints, and key players shaping this lucrative sector. Learn about onshore vs. offshore drilling, RSS technology, and investment opportunities in Oman's energy sector.

                                                July 2025
                                                Base Year: 2024
                                                No Of Pages: 197
                                                Price: $3800

                                                Mexico Wireline Services Market: Disruptive Technologies Driving Market Growth 2025-2033

                                                Discover the growth trajectory of the Mexico wireline services market, projected to reach $XX million by 2033 with a 3% CAGR. This in-depth analysis covers market drivers, trends, restraints, key players (SGS S.A., Baker Hughes, Schlumberger), and segmentations (electric line, slick line, onshore, offshore). Learn about the opportunities and challenges in this dynamic sector.

                                                July 2025
                                                Base Year: 2024
                                                No Of Pages: 197
                                                Price: $3800

                                                Unlocking the Future of China Bunker Fuel Market: Growth and Trends 2025-2033

                                                Discover the booming China bunker fuel market projected to surge beyond $XX million by 2033, driven by maritime trade growth and evolving environmental regulations. This in-depth analysis explores market size, CAGR, key players (Sinopec, Cosco, China Merchants), fuel types (VLSFO, HSFO, MGO), and future trends.

                                                July 2025
                                                Base Year: 2024
                                                No Of Pages: 197
                                                Price: $3800

                                                Power Market Market Analysis and Forecasts

                                                Discover the booming global power market, projected to reach $XX million by 2033 with a 4.89% CAGR. This comprehensive analysis explores key drivers, trends (renewable energy surge!), restraints, and regional breakdowns, featuring insights from top players like Engie and State Grid. Learn about the future of power generation.

                                                July 2025
                                                Base Year: 2024
                                                No Of Pages: 234
                                                Price: $4750

                                                Asia-Pacific Rooftop Solar Industry Unlocking Growth Potential: Analysis and Forecasts 2025-2033

                                                The Asia-Pacific rooftop solar market is booming, with a CAGR exceeding 16%! Discover key trends, growth drivers, and leading companies shaping this dynamic industry. Explore market size forecasts until 2033 for China, India, Japan, and more.

                                                July 2025
                                                Base Year: 2024
                                                No Of Pages: 234
                                                Price: $4750

                                                Solar Energy Industry in Middle East Insights: Growth at XX CAGR Through 2033

                                                Discover the booming Middle East solar energy market! This in-depth analysis reveals a CAGR exceeding 11%, driven by government initiatives, falling costs, and technological advancements. Explore market size projections, regional breakdowns, key players, and future trends in solar PV and CSP.

                                                July 2025
                                                Base Year: 2024
                                                No Of Pages: 234
                                                Price: $4750

                                                Czech Republic Solar Energy Market Market Disruption: Competitor Insights and Trends 2025-2033

                                                Discover the booming Czech Republic solar energy market forecast to 2033! This analysis reveals a $1.2 billion USD market in 2025, projected for 5% CAGR growth, driven by government incentives and decreasing PV system costs. Learn about key players, market segments, and future trends in this detailed report.

                                                July 2025
                                                Base Year: 2024
                                                No Of Pages: 197
                                                Price: $3800

                                                Malaysia Power Generation EPC Market Industry’s Growth Dynamics and Insights

                                                Discover the booming Malaysia Power Generation EPC market. This in-depth analysis reveals a CAGR exceeding 4%, driven by renewable energy investments and surging energy demand. Explore market size, segmentation, key players, and future growth projections for 2025-2033.

                                                July 2025
                                                Base Year: 2024
                                                No Of Pages: 197
                                                Price: $3800

                                                Wind Turbine Rotor Blade Market Market’s Evolutionary Trends 2025-2033

                                                The booming wind turbine rotor blade market is projected to exceed [estimated 2033 value] by 2033, driven by renewable energy demand and technological advancements. Explore key trends, leading companies (Vestas, Siemens Gamesa, GE), and regional growth opportunities in our comprehensive market analysis.

                                                July 2025
                                                Base Year: 2024
                                                No Of Pages: 234
                                                Price: $4750

                                                Strategic Vision for China LNG Market Industry Trends

                                                Discover the booming China LNG market analysis, showcasing a CAGR exceeding 7% and projected growth to 2033. Explore market drivers, trends, and key players shaping this dynamic sector, including China Suntien Green Energy, Shell, and Sinopec. Learn about the expanding LNG infrastructure and regional market share.

                                                July 2025
                                                Base Year: 2024
                                                No Of Pages: 197
                                                Price: $3800

                                                Asia-Pacific Industrial Battery Market Unlocking Growth Potential: Analysis and Forecasts 2025-2033

                                                The Asia-Pacific industrial battery market is booming, with a CAGR exceeding 9.21%. This in-depth analysis explores market size, key drivers (like the rise of e-commerce and data centers), trends (lithium-ion adoption), restraints, and leading companies. Discover the future of industrial batteries in the Asia-Pacific region.

                                                July 2025
                                                Base Year: 2024
                                                No Of Pages: 234
                                                Price: $4750

                                                Decoding Market Trends in UK Wind Power Industry: 2025-2033 Analysis

                                                The UK wind power industry is booming, with a projected market size exceeding £27 billion by 2033. Discover key market trends, growth drivers, and leading companies shaping this dynamic sector. Learn about onshore and offshore wind power opportunities and challenges in the UK market.

                                                July 2025
                                                Base Year: 2024
                                                No Of Pages: 197
                                                Price: $3800
                                                • Home
                                                • About Us
                                                • Industries
                                                  • Aerospace & Defense
                                                  • Agriculture
                                                  • Animal Nutrition & Wellness
                                                  • Automotive
                                                  • Chemicals & Materials
                                                  • Consumer Goods and Services
                                                  • Energy & Power
                                                  • Financial Services and Investment Intelligence
                                                  • Food & Beverage
                                                  • Home and Property Improvement
                                                  • Hospitality and Tourism
                                                  • Logistics
                                                  • Manufacturing Products and Services
                                                  • Packaging
                                                  • Professional and Commercial Services
                                                  • Real Estate and Construction
                                                  • Retail
                                                  • Technology, Media and Telecom
                                                  • Healthcare
                                                • Services
                                                • Contact
                                                Main Logo
                                                • Home
                                                • About Us
                                                • Industries
                                                  • Aerospace & Defense
                                                  • Agriculture
                                                  • Animal Nutrition & Wellness
                                                  • Automotive
                                                  • Chemicals & Materials
                                                  • Consumer Goods and Services
                                                  • Energy & Power
                                                  • Financial Services and Investment Intelligence
                                                  • Food & Beverage
                                                  • Home and Property Improvement
                                                  • Hospitality and Tourism
                                                  • Logistics
                                                  • Manufacturing Products and Services
                                                  • Packaging
                                                  • Professional and Commercial Services
                                                  • Real Estate and Construction
                                                  • Retail
                                                  • Technology, Media and Telecom
                                                  • Healthcare
                                                • Services
                                                • Contact
                                                +17162654855
                                                [email protected]

                                                +17162654855

                                                [email protected]

                                                Business Address

                                                Head Office

                                                Office no. A 5010, fifth floor, Solitaire Business Hub, Near Phoenix mall, Pune, Maharashtra 411014

                                                Contact Information

                                                Craig Francis

                                                Business Development Head

                                                +17162654855

                                                [email protected]

                                                Connect With Us

                                                Secure Payment Partners

                                                payment image
                                                RetailLogisticsPackagingAutomotiveHealthcareAgricultureEnergy & PowerFood & BeverageAerospace & DefenseChemicals & MaterialsHospitality and TourismAnimal Nutrition & WellnessConsumer Goods and ServicesReal Estate and ConstructionHome and Property ImprovementTechnology, Media and TelecomManufacturing Products and ServicesFinancial Services and Investment Intelligence

                                                © 2025 All rights reserved


                                                Privacy Policy
                                                Terms and Conditions
                                                FAQ