
Key Insights
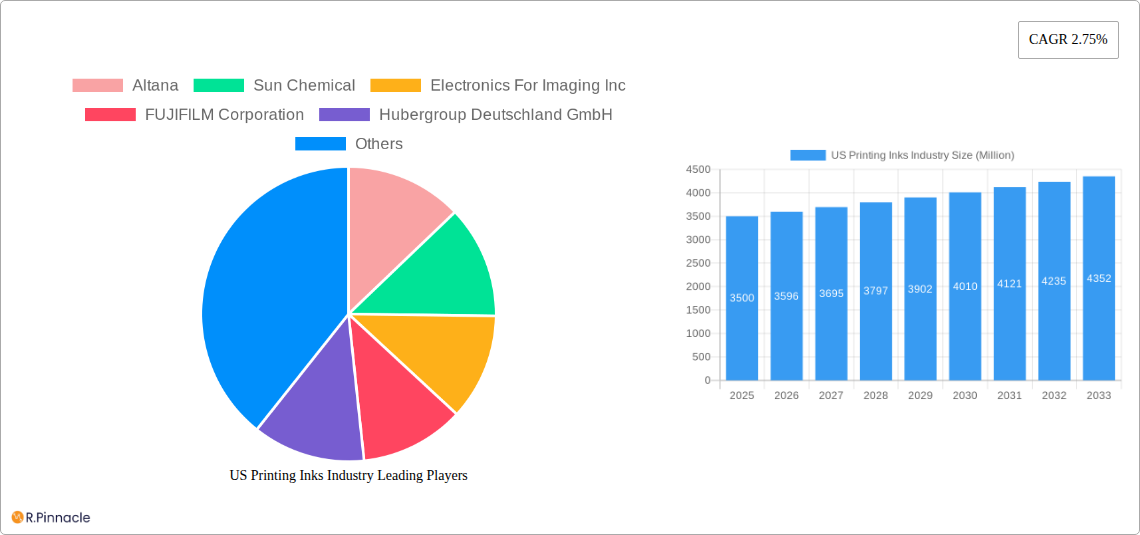
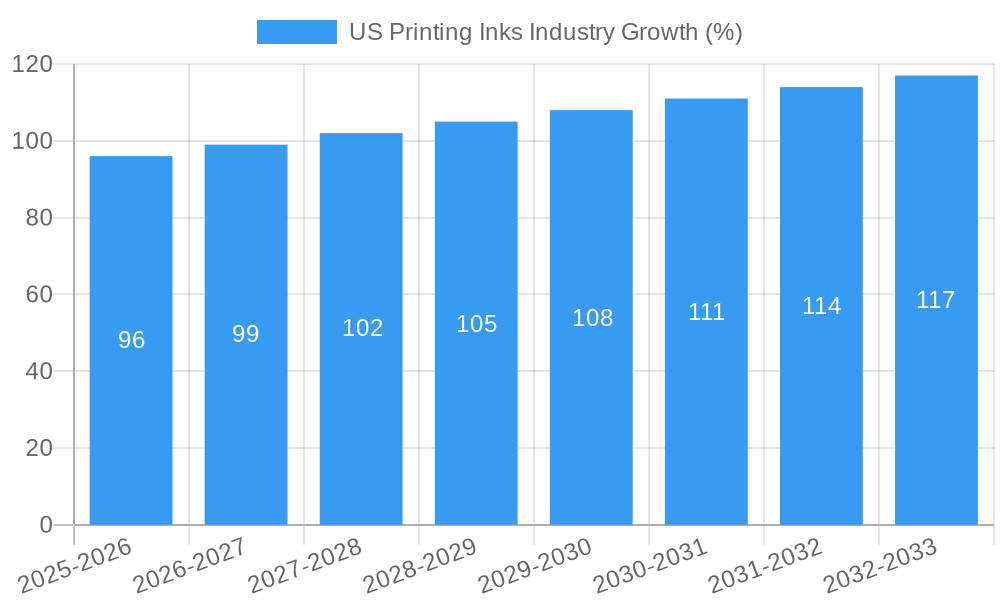
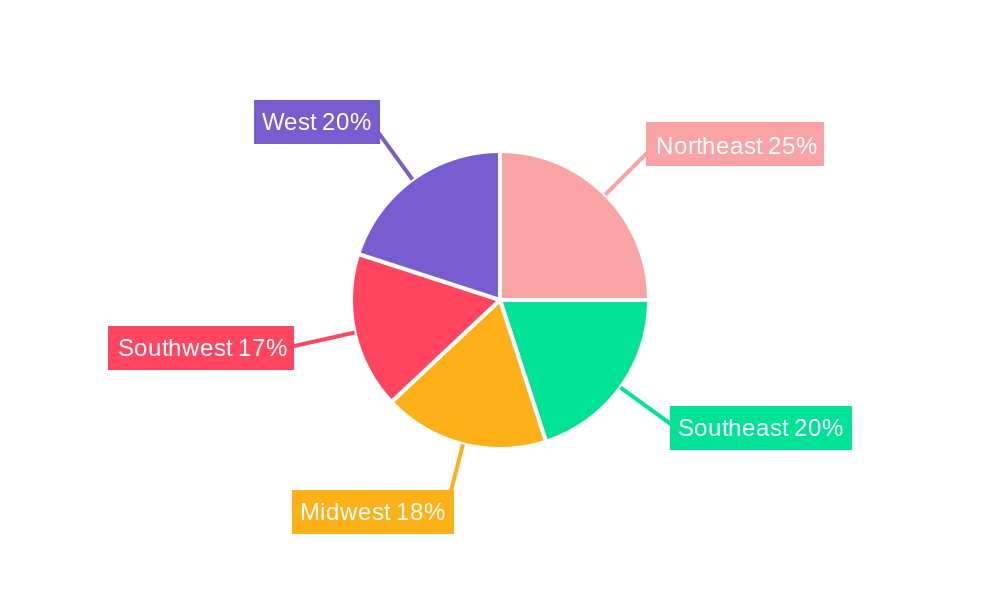
The US printing inks market, valued at approximately $3.5 billion in 2025, is projected to experience steady growth, driven by the expanding packaging industry and the increasing demand for high-quality printing across various applications. A Compound Annual Growth Rate (CAGR) of 2.75% from 2025 to 2033 indicates a consistent market expansion. Key drivers include the growth of e-commerce, leading to a surge in demand for packaging materials, and the increasing preference for vibrant and high-resolution printing in packaging and commercial printing. The shift towards sustainable practices is also influencing market trends, with growing adoption of water-based and UV-LED inks to minimize environmental impact. However, the market faces restraints such as fluctuating raw material prices and stringent environmental regulations. The segment analysis reveals a significant market share for solvent-based inks in traditional printing methods like lithographic and flexographic printing. However, the water-based and UV-LED segments are expected to witness significant growth fueled by eco-consciousness and technological advancements. Growth is particularly strong in the packaging sector, specifically rigid packaging (paperboard containers, corrugated boxes, and plastic containers) and flexible packaging for the food and beverage industry. Major players like Altana, Sun Chemical, and Fujifilm are actively investing in research and development to introduce innovative ink formulations and printing technologies to meet evolving market demands. Regional analysis reveals strong growth in the Western and Northeastern US, driven by the concentration of major printing and packaging companies in these areas.
The competitive landscape is characterized by the presence of both established global players and regional manufacturers. Larger companies leverage their established distribution networks and brand recognition while smaller players focus on niche applications and specialized ink formulations. Future growth hinges on technological innovation, including the development of inks with improved color gamut, durability, and sustainability. The adoption of digital printing technologies continues to reshape the market, presenting both opportunities and challenges for ink manufacturers. Market players are increasingly focusing on developing inks that offer superior performance, reduced environmental impact, and cost-effectiveness to maintain competitiveness in a dynamic and ever-evolving market landscape. The forecast period of 2025-2033 offers significant potential for growth, driven by the anticipated increase in demand from key application segments and technological advancements within the industry.
US Printing Inks Industry Report: 2019-2033
This comprehensive report provides a detailed analysis of the US printing inks market, offering invaluable insights for industry professionals, investors, and strategic decision-makers. Covering the period 2019-2033, with a base year of 2025, this report unveils market dynamics, growth drivers, and future trends, helping you navigate the complexities of this dynamic sector. The report leverages extensive data analysis, encompassing market segmentation by type, process, and application, along with competitive landscapes and key industry developments.
US Printing Inks Industry Market Structure & Innovation Trends
The US printing inks market is characterized by a moderately concentrated structure, with several major players holding significant market share. Key players include Altana, Sun Chemical, Electronics For Imaging Inc, FUJIFILM Corporation, Hubergroup Deutschland GmbH, Sicpa Holding SA, T&K TOKA Corporation, DuPont, Dow, Dainichiseika Color & Chemicals Mfg Co Ltd, Siegwerk Druckfarben AG & Co KGaA, Tokyo Printing Ink Mfg Co Ltd, Sakata Inx Corporation, Zeller+Gmelin, Wikoff Color Corporation, Flint Group, and Toyo Ink SC Holdings Co Ltd. Market share dynamics are influenced by factors such as R&D investments, technological advancements, and strategic mergers and acquisitions (M&A). The overall market value in 2025 is estimated at xx Million.
- Market Concentration: The top 5 players account for approximately xx% of the market share.
- Innovation Drivers: Sustainability concerns, demand for high-quality prints, and advancements in digital printing technologies are driving innovation.
- Regulatory Framework: EPA regulations on VOC emissions significantly impact ink formulation and production.
- Product Substitutes: The rise of digital printing methods is creating competition from alternative technologies.
- M&A Activities: Recent years have witnessed several M&A activities, with deal values exceeding xx Million in total, driving consolidation in the market. These activities aim to expand market reach, enhance product portfolios, and gain technological advantages.
US Printing Inks Industry Market Dynamics & Trends
The US printing inks market is expected to experience a CAGR of xx% during the forecast period (2025-2033). This growth is driven by several factors. The packaging industry, especially flexible packaging and corrugated boxes, is a primary growth engine, fueled by rising e-commerce and consumer demand. Technological disruptions, such as the increasing adoption of digital printing, are transforming the industry. Consumer preferences for sustainable and eco-friendly printing solutions are creating new market opportunities for water-based and UV-LED inks. However, competitive pressures from emerging economies and price fluctuations in raw materials pose challenges. Market penetration of UV-LED inks is projected to reach xx% by 2033.
Dominant Regions & Segments in US Printing Inks Industry
The packaging segment dominates the US printing inks market, holding over xx% of market share in 2025, followed by the commercial and publication segment. Within packaging, rigid packaging (paperboard containers, corrugated boxes, and plastic containers) holds a larger share than flexible packaging.
- Dominant Type: Solvent-based inks currently hold the largest market share but water-based and UV-LED inks are witnessing rapid growth.
- Dominant Process: Flexographic printing dominates due to its high efficiency in packaging applications.
- Dominant Application: Packaging remains the largest segment, driven by growth in food and beverage packaging.
Key Drivers:
- Robust growth in the e-commerce sector.
- Increasing consumer demand for high-quality packaging.
- Favorable government policies promoting domestic manufacturing.
US Printing Inks Industry Product Innovations
Recent innovations focus on developing eco-friendly and high-performance inks. Water-based, UV-LED, and other low-VOC inks are gaining popularity due to stricter environmental regulations and growing consumer awareness. Key innovations include improved color gamut, enhanced durability, and faster drying times. The industry is also witnessing the integration of smart inks and functionalities for added value. These innovations improve printing efficiency and reduce environmental impact, enhancing competitiveness.
Report Scope & Segmentation Analysis
This report segments the US printing inks market by type (Solvent-based, Water-based, Oil-based, UV, UV-LED, Other Types), process (Lithographic Printing, Flexographic Printing, Gravure Printing, Digital Printing, Other Processes), and application (Packaging - Rigid Packaging: Paperboard Containers, Corrugated Boxes, Rigid Plastic Containers, Metal Cans, Other Rigid Packaging; Other Packaging: Commercial and Publication, Textiles, Other Applications). Each segment is analyzed in detail, including growth projections, market sizes, and competitive dynamics. For example, the UV-LED ink segment is projected to exhibit the highest growth rate due to its environmental benefits and high-quality prints.
Key Drivers of US Printing Inks Industry Growth
Growth in the US printing inks market is driven by several factors, including the rising demand for packaging from the food and beverage industry, the expanding e-commerce sector requiring efficient and high-quality packaging, and increasing adoption of advanced printing technologies like digital printing. Technological advancements leading to improved ink formulations for better quality and sustainability also fuel growth. Government regulations promoting sustainable packaging further boost market expansion.
Challenges in the US Printing Inks Industry Sector
The US printing inks industry faces challenges such as fluctuating raw material prices, stringent environmental regulations leading to higher production costs, and intense competition from both domestic and international players. Supply chain disruptions and the increasing adoption of digital printing, potentially reducing the need for traditional inks, present additional hurdles. These factors can impact profitability and growth.
Emerging Opportunities in US Printing Inks Industry
The US printing inks market presents emerging opportunities in sustainable inks, high-performance digital inks, and specialized inks for niche applications like 3D printing and electronics. Growing demand for personalized packaging and eco-conscious printing solutions creates a fertile ground for innovation and expansion. The focus on sustainable practices presents opportunities for companies offering eco-friendly inks.
Leading Players in the US Printing Inks Industry Market
- Altana
- Sun Chemical
- Electronics For Imaging Inc
- FUJIFILM Corporation
- Hubergroup Deutschland GmbH
- Sicpa Holding SA
- T&K TOKA Corporation
- DuPont
- Dow
- Dainichiseika Color & Chemicals Mfg Co Ltd
- Siegwerk Druckfarben AG & Co KGaA
- Tokyo Printing Ink Mfg Co Ltd
- Sakata Inx Corporation
- Zeller+Gmelin
- Wikoff Color Corporation
- Flint Group
- Toyo Ink SC Holdings Co Ltd
Key Developments in US Printing Inks Industry Industry
- May 2021: Epple Druckfarben AG and Zeller+Gmelin GmbH & Co. KG partnered to develop UV-LED ink for sheetfed offset printing, marketed under the LightStar brand. This signifies the industry's focus on sustainable and high-performance UV ink technology.
Future Outlook for US Printing Inks Industry Market
The future of the US printing inks market looks promising, driven by continuous innovation in ink formulations, increasing demand for high-quality packaging solutions, and the growth of digital printing. Companies focusing on sustainability and cost-effective solutions are poised for success. Strategic partnerships and acquisitions are likely to shape the competitive landscape in the coming years. The market is expected to continue its growth trajectory, driven by technological advancements and evolving consumer preferences.
US Printing Inks Industry Segmentation
-
1. Type
- 1.1. Solvent-based
- 1.2. Water-based
- 1.3. Oil-based
- 1.4. UV
- 1.5. UV-LED
- 1.6. Other Types
-
2. Process
- 2.1. Lithographic Printing
- 2.2. Flexographic Printing
- 2.3. Gravure Printing
- 2.4. Digital Printing
- 2.5. Other Processes
-
3. Application
-
3.1. Packaging
-
3.1.1. Rigid Packaging
- 3.1.1.1. Paperboard Containers
- 3.1.1.2. Corrugated Boxes
- 3.1.1.3. Rigid Plastic Containers
- 3.1.1.4. Metal Cans
- 3.1.1.5. Other Rigid Packaging
- 3.1.2. Flexible Packaging
- 3.1.3. Labels
- 3.1.4. Other Packaging
-
3.1.1. Rigid Packaging
- 3.2. Commercial and Publication
- 3.3. Textiles
- 3.4. Other Applications
-
3.1. Packaging
US Printing Inks Industry Segmentation By Geography
-
1. North America
- 1.1. United States
- 1.2. Canada
- 1.3. Mexico
-
2. South America
- 2.1. Brazil
- 2.2. Argentina
- 2.3. Rest of South America
-
3. Europe
- 3.1. United Kingdom
- 3.2. Germany
- 3.3. France
- 3.4. Italy
- 3.5. Spain
- 3.6. Russia
- 3.7. Benelux
- 3.8. Nordics
- 3.9. Rest of Europe
-
4. Middle East & Africa
- 4.1. Turkey
- 4.2. Israel
- 4.3. GCC
- 4.4. North Africa
- 4.5. South Africa
- 4.6. Rest of Middle East & Africa
-
5. Asia Pacific
- 5.1. China
- 5.2. India
- 5.3. Japan
- 5.4. South Korea
- 5.5. ASEAN
- 5.6. Oceania
- 5.7. Rest of Asia Pacific
US Printing Inks Industry REPORT HIGHLIGHTS
| Aspects | Details |
|---|---|
| Study Period | 2019-2033 |
| Base Year | 2024 |
| Estimated Year | 2025 |
| Forecast Period | 2025-2033 |
| Historical Period | 2019-2024 |
| Growth Rate | CAGR of 2.75% from 2019-2033 |
| Segmentation |
|
Table of Contents
- 1. Introduction
- 1.1. Research Scope
- 1.2. Market Segmentation
- 1.3. Research Methodology
- 1.4. Definitions and Assumptions
- 2. Executive Summary
- 2.1. Introduction
- 3. Market Dynamics
- 3.1. Introduction
- 3.2. Market Drivers
- 3.2.1. Growing Demand from the Digital Printing Industry; High Demand from the Packaging Sector
- 3.3. Market Restrains
- 3.3.1. Rising Demand for Digital Advertisements and E-books; Stringent Regulations Regarding Disposal
- 3.4. Market Trends
- 3.4.1. Water-based Inks to Observe the Highest Growth
- 4. Market Factor Analysis
- 4.1. Porters Five Forces
- 4.2. Supply/Value Chain
- 4.3. PESTEL analysis
- 4.4. Market Entropy
- 4.5. Patent/Trademark Analysis
- 5. Global US Printing Inks Industry Analysis, Insights and Forecast, 2019-2031
- 5.1. Market Analysis, Insights and Forecast - by Type
- 5.1.1. Solvent-based
- 5.1.2. Water-based
- 5.1.3. Oil-based
- 5.1.4. UV
- 5.1.5. UV-LED
- 5.1.6. Other Types
- 5.2. Market Analysis, Insights and Forecast - by Process
- 5.2.1. Lithographic Printing
- 5.2.2. Flexographic Printing
- 5.2.3. Gravure Printing
- 5.2.4. Digital Printing
- 5.2.5. Other Processes
- 5.3. Market Analysis, Insights and Forecast - by Application
- 5.3.1. Packaging
- 5.3.1.1. Rigid Packaging
- 5.3.1.1.1. Paperboard Containers
- 5.3.1.1.2. Corrugated Boxes
- 5.3.1.1.3. Rigid Plastic Containers
- 5.3.1.1.4. Metal Cans
- 5.3.1.1.5. Other Rigid Packaging
- 5.3.1.2. Flexible Packaging
- 5.3.1.3. Labels
- 5.3.1.4. Other Packaging
- 5.3.1.1. Rigid Packaging
- 5.3.2. Commercial and Publication
- 5.3.3. Textiles
- 5.3.4. Other Applications
- 5.3.1. Packaging
- 5.4. Market Analysis, Insights and Forecast - by Region
- 5.4.1. North America
- 5.4.2. South America
- 5.4.3. Europe
- 5.4.4. Middle East & Africa
- 5.4.5. Asia Pacific
- 5.1. Market Analysis, Insights and Forecast - by Type
- 6. North America US Printing Inks Industry Analysis, Insights and Forecast, 2019-2031
- 6.1. Market Analysis, Insights and Forecast - by Type
- 6.1.1. Solvent-based
- 6.1.2. Water-based
- 6.1.3. Oil-based
- 6.1.4. UV
- 6.1.5. UV-LED
- 6.1.6. Other Types
- 6.2. Market Analysis, Insights and Forecast - by Process
- 6.2.1. Lithographic Printing
- 6.2.2. Flexographic Printing
- 6.2.3. Gravure Printing
- 6.2.4. Digital Printing
- 6.2.5. Other Processes
- 6.3. Market Analysis, Insights and Forecast - by Application
- 6.3.1. Packaging
- 6.3.1.1. Rigid Packaging
- 6.3.1.1.1. Paperboard Containers
- 6.3.1.1.2. Corrugated Boxes
- 6.3.1.1.3. Rigid Plastic Containers
- 6.3.1.1.4. Metal Cans
- 6.3.1.1.5. Other Rigid Packaging
- 6.3.1.2. Flexible Packaging
- 6.3.1.3. Labels
- 6.3.1.4. Other Packaging
- 6.3.1.1. Rigid Packaging
- 6.3.2. Commercial and Publication
- 6.3.3. Textiles
- 6.3.4. Other Applications
- 6.3.1. Packaging
- 6.1. Market Analysis, Insights and Forecast - by Type
- 7. South America US Printing Inks Industry Analysis, Insights and Forecast, 2019-2031
- 7.1. Market Analysis, Insights and Forecast - by Type
- 7.1.1. Solvent-based
- 7.1.2. Water-based
- 7.1.3. Oil-based
- 7.1.4. UV
- 7.1.5. UV-LED
- 7.1.6. Other Types
- 7.2. Market Analysis, Insights and Forecast - by Process
- 7.2.1. Lithographic Printing
- 7.2.2. Flexographic Printing
- 7.2.3. Gravure Printing
- 7.2.4. Digital Printing
- 7.2.5. Other Processes
- 7.3. Market Analysis, Insights and Forecast - by Application
- 7.3.1. Packaging
- 7.3.1.1. Rigid Packaging
- 7.3.1.1.1. Paperboard Containers
- 7.3.1.1.2. Corrugated Boxes
- 7.3.1.1.3. Rigid Plastic Containers
- 7.3.1.1.4. Metal Cans
- 7.3.1.1.5. Other Rigid Packaging
- 7.3.1.2. Flexible Packaging
- 7.3.1.3. Labels
- 7.3.1.4. Other Packaging
- 7.3.1.1. Rigid Packaging
- 7.3.2. Commercial and Publication
- 7.3.3. Textiles
- 7.3.4. Other Applications
- 7.3.1. Packaging
- 7.1. Market Analysis, Insights and Forecast - by Type
- 8. Europe US Printing Inks Industry Analysis, Insights and Forecast, 2019-2031
- 8.1. Market Analysis, Insights and Forecast - by Type
- 8.1.1. Solvent-based
- 8.1.2. Water-based
- 8.1.3. Oil-based
- 8.1.4. UV
- 8.1.5. UV-LED
- 8.1.6. Other Types
- 8.2. Market Analysis, Insights and Forecast - by Process
- 8.2.1. Lithographic Printing
- 8.2.2. Flexographic Printing
- 8.2.3. Gravure Printing
- 8.2.4. Digital Printing
- 8.2.5. Other Processes
- 8.3. Market Analysis, Insights and Forecast - by Application
- 8.3.1. Packaging
- 8.3.1.1. Rigid Packaging
- 8.3.1.1.1. Paperboard Containers
- 8.3.1.1.2. Corrugated Boxes
- 8.3.1.1.3. Rigid Plastic Containers
- 8.3.1.1.4. Metal Cans
- 8.3.1.1.5. Other Rigid Packaging
- 8.3.1.2. Flexible Packaging
- 8.3.1.3. Labels
- 8.3.1.4. Other Packaging
- 8.3.1.1. Rigid Packaging
- 8.3.2. Commercial and Publication
- 8.3.3. Textiles
- 8.3.4. Other Applications
- 8.3.1. Packaging
- 8.1. Market Analysis, Insights and Forecast - by Type
- 9. Middle East & Africa US Printing Inks Industry Analysis, Insights and Forecast, 2019-2031
- 9.1. Market Analysis, Insights and Forecast - by Type
- 9.1.1. Solvent-based
- 9.1.2. Water-based
- 9.1.3. Oil-based
- 9.1.4. UV
- 9.1.5. UV-LED
- 9.1.6. Other Types
- 9.2. Market Analysis, Insights and Forecast - by Process
- 9.2.1. Lithographic Printing
- 9.2.2. Flexographic Printing
- 9.2.3. Gravure Printing
- 9.2.4. Digital Printing
- 9.2.5. Other Processes
- 9.3. Market Analysis, Insights and Forecast - by Application
- 9.3.1. Packaging
- 9.3.1.1. Rigid Packaging
- 9.3.1.1.1. Paperboard Containers
- 9.3.1.1.2. Corrugated Boxes
- 9.3.1.1.3. Rigid Plastic Containers
- 9.3.1.1.4. Metal Cans
- 9.3.1.1.5. Other Rigid Packaging
- 9.3.1.2. Flexible Packaging
- 9.3.1.3. Labels
- 9.3.1.4. Other Packaging
- 9.3.1.1. Rigid Packaging
- 9.3.2. Commercial and Publication
- 9.3.3. Textiles
- 9.3.4. Other Applications
- 9.3.1. Packaging
- 9.1. Market Analysis, Insights and Forecast - by Type
- 10. Asia Pacific US Printing Inks Industry Analysis, Insights and Forecast, 2019-2031
- 10.1. Market Analysis, Insights and Forecast - by Type
- 10.1.1. Solvent-based
- 10.1.2. Water-based
- 10.1.3. Oil-based
- 10.1.4. UV
- 10.1.5. UV-LED
- 10.1.6. Other Types
- 10.2. Market Analysis, Insights and Forecast - by Process
- 10.2.1. Lithographic Printing
- 10.2.2. Flexographic Printing
- 10.2.3. Gravure Printing
- 10.2.4. Digital Printing
- 10.2.5. Other Processes
- 10.3. Market Analysis, Insights and Forecast - by Application
- 10.3.1. Packaging
- 10.3.1.1. Rigid Packaging
- 10.3.1.1.1. Paperboard Containers
- 10.3.1.1.2. Corrugated Boxes
- 10.3.1.1.3. Rigid Plastic Containers
- 10.3.1.1.4. Metal Cans
- 10.3.1.1.5. Other Rigid Packaging
- 10.3.1.2. Flexible Packaging
- 10.3.1.3. Labels
- 10.3.1.4. Other Packaging
- 10.3.1.1. Rigid Packaging
- 10.3.2. Commercial and Publication
- 10.3.3. Textiles
- 10.3.4. Other Applications
- 10.3.1. Packaging
- 10.1. Market Analysis, Insights and Forecast - by Type
- 11. Northeast US Printing Inks Industry Analysis, Insights and Forecast, 2019-2031
- 12. Southeast US Printing Inks Industry Analysis, Insights and Forecast, 2019-2031
- 13. Midwest US Printing Inks Industry Analysis, Insights and Forecast, 2019-2031
- 14. Southwest US Printing Inks Industry Analysis, Insights and Forecast, 2019-2031
- 15. West US Printing Inks Industry Analysis, Insights and Forecast, 2019-2031
- 16. Competitive Analysis
- 16.1. Global Market Share Analysis 2024
- 16.2. Company Profiles
- 16.2.1 Altana
- 16.2.1.1. Overview
- 16.2.1.2. Products
- 16.2.1.3. SWOT Analysis
- 16.2.1.4. Recent Developments
- 16.2.1.5. Financials (Based on Availability)
- 16.2.2 Sun Chemical
- 16.2.2.1. Overview
- 16.2.2.2. Products
- 16.2.2.3. SWOT Analysis
- 16.2.2.4. Recent Developments
- 16.2.2.5. Financials (Based on Availability)
- 16.2.3 Electronics For Imaging Inc
- 16.2.3.1. Overview
- 16.2.3.2. Products
- 16.2.3.3. SWOT Analysis
- 16.2.3.4. Recent Developments
- 16.2.3.5. Financials (Based on Availability)
- 16.2.4 FUJIFILM Corporation
- 16.2.4.1. Overview
- 16.2.4.2. Products
- 16.2.4.3. SWOT Analysis
- 16.2.4.4. Recent Developments
- 16.2.4.5. Financials (Based on Availability)
- 16.2.5 Hubergroup Deutschland GmbH
- 16.2.5.1. Overview
- 16.2.5.2. Products
- 16.2.5.3. SWOT Analysis
- 16.2.5.4. Recent Developments
- 16.2.5.5. Financials (Based on Availability)
- 16.2.6 Sicpa Holding SA
- 16.2.6.1. Overview
- 16.2.6.2. Products
- 16.2.6.3. SWOT Analysis
- 16.2.6.4. Recent Developments
- 16.2.6.5. Financials (Based on Availability)
- 16.2.7 T&K TOKA Corporation
- 16.2.7.1. Overview
- 16.2.7.2. Products
- 16.2.7.3. SWOT Analysis
- 16.2.7.4. Recent Developments
- 16.2.7.5. Financials (Based on Availability)
- 16.2.8 DuPont
- 16.2.8.1. Overview
- 16.2.8.2. Products
- 16.2.8.3. SWOT Analysis
- 16.2.8.4. Recent Developments
- 16.2.8.5. Financials (Based on Availability)
- 16.2.9 Dow
- 16.2.9.1. Overview
- 16.2.9.2. Products
- 16.2.9.3. SWOT Analysis
- 16.2.9.4. Recent Developments
- 16.2.9.5. Financials (Based on Availability)
- 16.2.10 Dainichiseika Color & Chemicals Mfg Co Ltd
- 16.2.10.1. Overview
- 16.2.10.2. Products
- 16.2.10.3. SWOT Analysis
- 16.2.10.4. Recent Developments
- 16.2.10.5. Financials (Based on Availability)
- 16.2.11 Siegwerk Druckfarben AG & Co KGaA
- 16.2.11.1. Overview
- 16.2.11.2. Products
- 16.2.11.3. SWOT Analysis
- 16.2.11.4. Recent Developments
- 16.2.11.5. Financials (Based on Availability)
- 16.2.12 Tokyo Printing Ink Mfg Co Ltd
- 16.2.12.1. Overview
- 16.2.12.2. Products
- 16.2.12.3. SWOT Analysis
- 16.2.12.4. Recent Developments
- 16.2.12.5. Financials (Based on Availability)
- 16.2.13 Sakata Inx Corporation
- 16.2.13.1. Overview
- 16.2.13.2. Products
- 16.2.13.3. SWOT Analysis
- 16.2.13.4. Recent Developments
- 16.2.13.5. Financials (Based on Availability)
- 16.2.14 Zeller+Gmelin
- 16.2.14.1. Overview
- 16.2.14.2. Products
- 16.2.14.3. SWOT Analysis
- 16.2.14.4. Recent Developments
- 16.2.14.5. Financials (Based on Availability)
- 16.2.15 Wikoff Color Corporation
- 16.2.15.1. Overview
- 16.2.15.2. Products
- 16.2.15.3. SWOT Analysis
- 16.2.15.4. Recent Developments
- 16.2.15.5. Financials (Based on Availability)
- 16.2.16 Flint Group
- 16.2.16.1. Overview
- 16.2.16.2. Products
- 16.2.16.3. SWOT Analysis
- 16.2.16.4. Recent Developments
- 16.2.16.5. Financials (Based on Availability)
- 16.2.17 Toyo Ink SC Holdings Co Ltd
- 16.2.17.1. Overview
- 16.2.17.2. Products
- 16.2.17.3. SWOT Analysis
- 16.2.17.4. Recent Developments
- 16.2.17.5. Financials (Based on Availability)
- 16.2.1 Altana
List of Figures
- Figure 1: Global US Printing Inks Industry Revenue Breakdown (Million, %) by Region 2024 & 2032
- Figure 2: Global US Printing Inks Industry Volume Breakdown (K Tons, %) by Region 2024 & 2032
- Figure 3: United states US Printing Inks Industry Revenue (Million), by Country 2024 & 2032
- Figure 4: United states US Printing Inks Industry Volume (K Tons), by Country 2024 & 2032
- Figure 5: United states US Printing Inks Industry Revenue Share (%), by Country 2024 & 2032
- Figure 6: United states US Printing Inks Industry Volume Share (%), by Country 2024 & 2032
- Figure 7: North America US Printing Inks Industry Revenue (Million), by Type 2024 & 2032
- Figure 8: North America US Printing Inks Industry Volume (K Tons), by Type 2024 & 2032
- Figure 9: North America US Printing Inks Industry Revenue Share (%), by Type 2024 & 2032
- Figure 10: North America US Printing Inks Industry Volume Share (%), by Type 2024 & 2032
- Figure 11: North America US Printing Inks Industry Revenue (Million), by Process 2024 & 2032
- Figure 12: North America US Printing Inks Industry Volume (K Tons), by Process 2024 & 2032
- Figure 13: North America US Printing Inks Industry Revenue Share (%), by Process 2024 & 2032
- Figure 14: North America US Printing Inks Industry Volume Share (%), by Process 2024 & 2032
- Figure 15: North America US Printing Inks Industry Revenue (Million), by Application 2024 & 2032
- Figure 16: North America US Printing Inks Industry Volume (K Tons), by Application 2024 & 2032
- Figure 17: North America US Printing Inks Industry Revenue Share (%), by Application 2024 & 2032
- Figure 18: North America US Printing Inks Industry Volume Share (%), by Application 2024 & 2032
- Figure 19: North America US Printing Inks Industry Revenue (Million), by Country 2024 & 2032
- Figure 20: North America US Printing Inks Industry Volume (K Tons), by Country 2024 & 2032
- Figure 21: North America US Printing Inks Industry Revenue Share (%), by Country 2024 & 2032
- Figure 22: North America US Printing Inks Industry Volume Share (%), by Country 2024 & 2032
- Figure 23: South America US Printing Inks Industry Revenue (Million), by Type 2024 & 2032
- Figure 24: South America US Printing Inks Industry Volume (K Tons), by Type 2024 & 2032
- Figure 25: South America US Printing Inks Industry Revenue Share (%), by Type 2024 & 2032
- Figure 26: South America US Printing Inks Industry Volume Share (%), by Type 2024 & 2032
- Figure 27: South America US Printing Inks Industry Revenue (Million), by Process 2024 & 2032
- Figure 28: South America US Printing Inks Industry Volume (K Tons), by Process 2024 & 2032
- Figure 29: South America US Printing Inks Industry Revenue Share (%), by Process 2024 & 2032
- Figure 30: South America US Printing Inks Industry Volume Share (%), by Process 2024 & 2032
- Figure 31: South America US Printing Inks Industry Revenue (Million), by Application 2024 & 2032
- Figure 32: South America US Printing Inks Industry Volume (K Tons), by Application 2024 & 2032
- Figure 33: South America US Printing Inks Industry Revenue Share (%), by Application 2024 & 2032
- Figure 34: South America US Printing Inks Industry Volume Share (%), by Application 2024 & 2032
- Figure 35: South America US Printing Inks Industry Revenue (Million), by Country 2024 & 2032
- Figure 36: South America US Printing Inks Industry Volume (K Tons), by Country 2024 & 2032
- Figure 37: South America US Printing Inks Industry Revenue Share (%), by Country 2024 & 2032
- Figure 38: South America US Printing Inks Industry Volume Share (%), by Country 2024 & 2032
- Figure 39: Europe US Printing Inks Industry Revenue (Million), by Type 2024 & 2032
- Figure 40: Europe US Printing Inks Industry Volume (K Tons), by Type 2024 & 2032
- Figure 41: Europe US Printing Inks Industry Revenue Share (%), by Type 2024 & 2032
- Figure 42: Europe US Printing Inks Industry Volume Share (%), by Type 2024 & 2032
- Figure 43: Europe US Printing Inks Industry Revenue (Million), by Process 2024 & 2032
- Figure 44: Europe US Printing Inks Industry Volume (K Tons), by Process 2024 & 2032
- Figure 45: Europe US Printing Inks Industry Revenue Share (%), by Process 2024 & 2032
- Figure 46: Europe US Printing Inks Industry Volume Share (%), by Process 2024 & 2032
- Figure 47: Europe US Printing Inks Industry Revenue (Million), by Application 2024 & 2032
- Figure 48: Europe US Printing Inks Industry Volume (K Tons), by Application 2024 & 2032
- Figure 49: Europe US Printing Inks Industry Revenue Share (%), by Application 2024 & 2032
- Figure 50: Europe US Printing Inks Industry Volume Share (%), by Application 2024 & 2032
- Figure 51: Europe US Printing Inks Industry Revenue (Million), by Country 2024 & 2032
- Figure 52: Europe US Printing Inks Industry Volume (K Tons), by Country 2024 & 2032
- Figure 53: Europe US Printing Inks Industry Revenue Share (%), by Country 2024 & 2032
- Figure 54: Europe US Printing Inks Industry Volume Share (%), by Country 2024 & 2032
- Figure 55: Middle East & Africa US Printing Inks Industry Revenue (Million), by Type 2024 & 2032
- Figure 56: Middle East & Africa US Printing Inks Industry Volume (K Tons), by Type 2024 & 2032
- Figure 57: Middle East & Africa US Printing Inks Industry Revenue Share (%), by Type 2024 & 2032
- Figure 58: Middle East & Africa US Printing Inks Industry Volume Share (%), by Type 2024 & 2032
- Figure 59: Middle East & Africa US Printing Inks Industry Revenue (Million), by Process 2024 & 2032
- Figure 60: Middle East & Africa US Printing Inks Industry Volume (K Tons), by Process 2024 & 2032
- Figure 61: Middle East & Africa US Printing Inks Industry Revenue Share (%), by Process 2024 & 2032
- Figure 62: Middle East & Africa US Printing Inks Industry Volume Share (%), by Process 2024 & 2032
- Figure 63: Middle East & Africa US Printing Inks Industry Revenue (Million), by Application 2024 & 2032
- Figure 64: Middle East & Africa US Printing Inks Industry Volume (K Tons), by Application 2024 & 2032
- Figure 65: Middle East & Africa US Printing Inks Industry Revenue Share (%), by Application 2024 & 2032
- Figure 66: Middle East & Africa US Printing Inks Industry Volume Share (%), by Application 2024 & 2032
- Figure 67: Middle East & Africa US Printing Inks Industry Revenue (Million), by Country 2024 & 2032
- Figure 68: Middle East & Africa US Printing Inks Industry Volume (K Tons), by Country 2024 & 2032
- Figure 69: Middle East & Africa US Printing Inks Industry Revenue Share (%), by Country 2024 & 2032
- Figure 70: Middle East & Africa US Printing Inks Industry Volume Share (%), by Country 2024 & 2032
- Figure 71: Asia Pacific US Printing Inks Industry Revenue (Million), by Type 2024 & 2032
- Figure 72: Asia Pacific US Printing Inks Industry Volume (K Tons), by Type 2024 & 2032
- Figure 73: Asia Pacific US Printing Inks Industry Revenue Share (%), by Type 2024 & 2032
- Figure 74: Asia Pacific US Printing Inks Industry Volume Share (%), by Type 2024 & 2032
- Figure 75: Asia Pacific US Printing Inks Industry Revenue (Million), by Process 2024 & 2032
- Figure 76: Asia Pacific US Printing Inks Industry Volume (K Tons), by Process 2024 & 2032
- Figure 77: Asia Pacific US Printing Inks Industry Revenue Share (%), by Process 2024 & 2032
- Figure 78: Asia Pacific US Printing Inks Industry Volume Share (%), by Process 2024 & 2032
- Figure 79: Asia Pacific US Printing Inks Industry Revenue (Million), by Application 2024 & 2032
- Figure 80: Asia Pacific US Printing Inks Industry Volume (K Tons), by Application 2024 & 2032
- Figure 81: Asia Pacific US Printing Inks Industry Revenue Share (%), by Application 2024 & 2032
- Figure 82: Asia Pacific US Printing Inks Industry Volume Share (%), by Application 2024 & 2032
- Figure 83: Asia Pacific US Printing Inks Industry Revenue (Million), by Country 2024 & 2032
- Figure 84: Asia Pacific US Printing Inks Industry Volume (K Tons), by Country 2024 & 2032
- Figure 85: Asia Pacific US Printing Inks Industry Revenue Share (%), by Country 2024 & 2032
- Figure 86: Asia Pacific US Printing Inks Industry Volume Share (%), by Country 2024 & 2032
List of Tables
- Table 1: Global US Printing Inks Industry Revenue Million Forecast, by Region 2019 & 2032
- Table 2: Global US Printing Inks Industry Volume K Tons Forecast, by Region 2019 & 2032
- Table 3: Global US Printing Inks Industry Revenue Million Forecast, by Type 2019 & 2032
- Table 4: Global US Printing Inks Industry Volume K Tons Forecast, by Type 2019 & 2032
- Table 5: Global US Printing Inks Industry Revenue Million Forecast, by Process 2019 & 2032
- Table 6: Global US Printing Inks Industry Volume K Tons Forecast, by Process 2019 & 2032
- Table 7: Global US Printing Inks Industry Revenue Million Forecast, by Application 2019 & 2032
- Table 8: Global US Printing Inks Industry Volume K Tons Forecast, by Application 2019 & 2032
- Table 9: Global US Printing Inks Industry Revenue Million Forecast, by Region 2019 & 2032
- Table 10: Global US Printing Inks Industry Volume K Tons Forecast, by Region 2019 & 2032
- Table 11: Global US Printing Inks Industry Revenue Million Forecast, by Country 2019 & 2032
- Table 12: Global US Printing Inks Industry Volume K Tons Forecast, by Country 2019 & 2032
- Table 13: Northeast US Printing Inks Industry Revenue (Million) Forecast, by Application 2019 & 2032
- Table 14: Northeast US Printing Inks Industry Volume (K Tons) Forecast, by Application 2019 & 2032
- Table 15: Southeast US Printing Inks Industry Revenue (Million) Forecast, by Application 2019 & 2032
- Table 16: Southeast US Printing Inks Industry Volume (K Tons) Forecast, by Application 2019 & 2032
- Table 17: Midwest US Printing Inks Industry Revenue (Million) Forecast, by Application 2019 & 2032
- Table 18: Midwest US Printing Inks Industry Volume (K Tons) Forecast, by Application 2019 & 2032
- Table 19: Southwest US Printing Inks Industry Revenue (Million) Forecast, by Application 2019 & 2032
- Table 20: Southwest US Printing Inks Industry Volume (K Tons) Forecast, by Application 2019 & 2032
- Table 21: West US Printing Inks Industry Revenue (Million) Forecast, by Application 2019 & 2032
- Table 22: West US Printing Inks Industry Volume (K Tons) Forecast, by Application 2019 & 2032
- Table 23: Global US Printing Inks Industry Revenue Million Forecast, by Type 2019 & 2032
- Table 24: Global US Printing Inks Industry Volume K Tons Forecast, by Type 2019 & 2032
- Table 25: Global US Printing Inks Industry Revenue Million Forecast, by Process 2019 & 2032
- Table 26: Global US Printing Inks Industry Volume K Tons Forecast, by Process 2019 & 2032
- Table 27: Global US Printing Inks Industry Revenue Million Forecast, by Application 2019 & 2032
- Table 28: Global US Printing Inks Industry Volume K Tons Forecast, by Application 2019 & 2032
- Table 29: Global US Printing Inks Industry Revenue Million Forecast, by Country 2019 & 2032
- Table 30: Global US Printing Inks Industry Volume K Tons Forecast, by Country 2019 & 2032
- Table 31: United States US Printing Inks Industry Revenue (Million) Forecast, by Application 2019 & 2032
- Table 32: United States US Printing Inks Industry Volume (K Tons) Forecast, by Application 2019 & 2032
- Table 33: Canada US Printing Inks Industry Revenue (Million) Forecast, by Application 2019 & 2032
- Table 34: Canada US Printing Inks Industry Volume (K Tons) Forecast, by Application 2019 & 2032
- Table 35: Mexico US Printing Inks Industry Revenue (Million) Forecast, by Application 2019 & 2032
- Table 36: Mexico US Printing Inks Industry Volume (K Tons) Forecast, by Application 2019 & 2032
- Table 37: Global US Printing Inks Industry Revenue Million Forecast, by Type 2019 & 2032
- Table 38: Global US Printing Inks Industry Volume K Tons Forecast, by Type 2019 & 2032
- Table 39: Global US Printing Inks Industry Revenue Million Forecast, by Process 2019 & 2032
- Table 40: Global US Printing Inks Industry Volume K Tons Forecast, by Process 2019 & 2032
- Table 41: Global US Printing Inks Industry Revenue Million Forecast, by Application 2019 & 2032
- Table 42: Global US Printing Inks Industry Volume K Tons Forecast, by Application 2019 & 2032
- Table 43: Global US Printing Inks Industry Revenue Million Forecast, by Country 2019 & 2032
- Table 44: Global US Printing Inks Industry Volume K Tons Forecast, by Country 2019 & 2032
- Table 45: Brazil US Printing Inks Industry Revenue (Million) Forecast, by Application 2019 & 2032
- Table 46: Brazil US Printing Inks Industry Volume (K Tons) Forecast, by Application 2019 & 2032
- Table 47: Argentina US Printing Inks Industry Revenue (Million) Forecast, by Application 2019 & 2032
- Table 48: Argentina US Printing Inks Industry Volume (K Tons) Forecast, by Application 2019 & 2032
- Table 49: Rest of South America US Printing Inks Industry Revenue (Million) Forecast, by Application 2019 & 2032
- Table 50: Rest of South America US Printing Inks Industry Volume (K Tons) Forecast, by Application 2019 & 2032
- Table 51: Global US Printing Inks Industry Revenue Million Forecast, by Type 2019 & 2032
- Table 52: Global US Printing Inks Industry Volume K Tons Forecast, by Type 2019 & 2032
- Table 53: Global US Printing Inks Industry Revenue Million Forecast, by Process 2019 & 2032
- Table 54: Global US Printing Inks Industry Volume K Tons Forecast, by Process 2019 & 2032
- Table 55: Global US Printing Inks Industry Revenue Million Forecast, by Application 2019 & 2032
- Table 56: Global US Printing Inks Industry Volume K Tons Forecast, by Application 2019 & 2032
- Table 57: Global US Printing Inks Industry Revenue Million Forecast, by Country 2019 & 2032
- Table 58: Global US Printing Inks Industry Volume K Tons Forecast, by Country 2019 & 2032
- Table 59: United Kingdom US Printing Inks Industry Revenue (Million) Forecast, by Application 2019 & 2032
- Table 60: United Kingdom US Printing Inks Industry Volume (K Tons) Forecast, by Application 2019 & 2032
- Table 61: Germany US Printing Inks Industry Revenue (Million) Forecast, by Application 2019 & 2032
- Table 62: Germany US Printing Inks Industry Volume (K Tons) Forecast, by Application 2019 & 2032
- Table 63: France US Printing Inks Industry Revenue (Million) Forecast, by Application 2019 & 2032
- Table 64: France US Printing Inks Industry Volume (K Tons) Forecast, by Application 2019 & 2032
- Table 65: Italy US Printing Inks Industry Revenue (Million) Forecast, by Application 2019 & 2032
- Table 66: Italy US Printing Inks Industry Volume (K Tons) Forecast, by Application 2019 & 2032
- Table 67: Spain US Printing Inks Industry Revenue (Million) Forecast, by Application 2019 & 2032
- Table 68: Spain US Printing Inks Industry Volume (K Tons) Forecast, by Application 2019 & 2032
- Table 69: Russia US Printing Inks Industry Revenue (Million) Forecast, by Application 2019 & 2032
- Table 70: Russia US Printing Inks Industry Volume (K Tons) Forecast, by Application 2019 & 2032
- Table 71: Benelux US Printing Inks Industry Revenue (Million) Forecast, by Application 2019 & 2032
- Table 72: Benelux US Printing Inks Industry Volume (K Tons) Forecast, by Application 2019 & 2032
- Table 73: Nordics US Printing Inks Industry Revenue (Million) Forecast, by Application 2019 & 2032
- Table 74: Nordics US Printing Inks Industry Volume (K Tons) Forecast, by Application 2019 & 2032
- Table 75: Rest of Europe US Printing Inks Industry Revenue (Million) Forecast, by Application 2019 & 2032
- Table 76: Rest of Europe US Printing Inks Industry Volume (K Tons) Forecast, by Application 2019 & 2032
- Table 77: Global US Printing Inks Industry Revenue Million Forecast, by Type 2019 & 2032
- Table 78: Global US Printing Inks Industry Volume K Tons Forecast, by Type 2019 & 2032
- Table 79: Global US Printing Inks Industry Revenue Million Forecast, by Process 2019 & 2032
- Table 80: Global US Printing Inks Industry Volume K Tons Forecast, by Process 2019 & 2032
- Table 81: Global US Printing Inks Industry Revenue Million Forecast, by Application 2019 & 2032
- Table 82: Global US Printing Inks Industry Volume K Tons Forecast, by Application 2019 & 2032
- Table 83: Global US Printing Inks Industry Revenue Million Forecast, by Country 2019 & 2032
- Table 84: Global US Printing Inks Industry Volume K Tons Forecast, by Country 2019 & 2032
- Table 85: Turkey US Printing Inks Industry Revenue (Million) Forecast, by Application 2019 & 2032
- Table 86: Turkey US Printing Inks Industry Volume (K Tons) Forecast, by Application 2019 & 2032
- Table 87: Israel US Printing Inks Industry Revenue (Million) Forecast, by Application 2019 & 2032
- Table 88: Israel US Printing Inks Industry Volume (K Tons) Forecast, by Application 2019 & 2032
- Table 89: GCC US Printing Inks Industry Revenue (Million) Forecast, by Application 2019 & 2032
- Table 90: GCC US Printing Inks Industry Volume (K Tons) Forecast, by Application 2019 & 2032
- Table 91: North Africa US Printing Inks Industry Revenue (Million) Forecast, by Application 2019 & 2032
- Table 92: North Africa US Printing Inks Industry Volume (K Tons) Forecast, by Application 2019 & 2032
- Table 93: South Africa US Printing Inks Industry Revenue (Million) Forecast, by Application 2019 & 2032
- Table 94: South Africa US Printing Inks Industry Volume (K Tons) Forecast, by Application 2019 & 2032
- Table 95: Rest of Middle East & Africa US Printing Inks Industry Revenue (Million) Forecast, by Application 2019 & 2032
- Table 96: Rest of Middle East & Africa US Printing Inks Industry Volume (K Tons) Forecast, by Application 2019 & 2032
- Table 97: Global US Printing Inks Industry Revenue Million Forecast, by Type 2019 & 2032
- Table 98: Global US Printing Inks Industry Volume K Tons Forecast, by Type 2019 & 2032
- Table 99: Global US Printing Inks Industry Revenue Million Forecast, by Process 2019 & 2032
- Table 100: Global US Printing Inks Industry Volume K Tons Forecast, by Process 2019 & 2032
- Table 101: Global US Printing Inks Industry Revenue Million Forecast, by Application 2019 & 2032
- Table 102: Global US Printing Inks Industry Volume K Tons Forecast, by Application 2019 & 2032
- Table 103: Global US Printing Inks Industry Revenue Million Forecast, by Country 2019 & 2032
- Table 104: Global US Printing Inks Industry Volume K Tons Forecast, by Country 2019 & 2032
- Table 105: China US Printing Inks Industry Revenue (Million) Forecast, by Application 2019 & 2032
- Table 106: China US Printing Inks Industry Volume (K Tons) Forecast, by Application 2019 & 2032
- Table 107: India US Printing Inks Industry Revenue (Million) Forecast, by Application 2019 & 2032
- Table 108: India US Printing Inks Industry Volume (K Tons) Forecast, by Application 2019 & 2032
- Table 109: Japan US Printing Inks Industry Revenue (Million) Forecast, by Application 2019 & 2032
- Table 110: Japan US Printing Inks Industry Volume (K Tons) Forecast, by Application 2019 & 2032
- Table 111: South Korea US Printing Inks Industry Revenue (Million) Forecast, by Application 2019 & 2032
- Table 112: South Korea US Printing Inks Industry Volume (K Tons) Forecast, by Application 2019 & 2032
- Table 113: ASEAN US Printing Inks Industry Revenue (Million) Forecast, by Application 2019 & 2032
- Table 114: ASEAN US Printing Inks Industry Volume (K Tons) Forecast, by Application 2019 & 2032
- Table 115: Oceania US Printing Inks Industry Revenue (Million) Forecast, by Application 2019 & 2032
- Table 116: Oceania US Printing Inks Industry Volume (K Tons) Forecast, by Application 2019 & 2032
- Table 117: Rest of Asia Pacific US Printing Inks Industry Revenue (Million) Forecast, by Application 2019 & 2032
- Table 118: Rest of Asia Pacific US Printing Inks Industry Volume (K Tons) Forecast, by Application 2019 & 2032
Frequently Asked Questions
1. What is the projected Compound Annual Growth Rate (CAGR) of the US Printing Inks Industry?
The projected CAGR is approximately 2.75%.
2. Which companies are prominent players in the US Printing Inks Industry?
Key companies in the market include Altana, Sun Chemical, Electronics For Imaging Inc, FUJIFILM Corporation, Hubergroup Deutschland GmbH, Sicpa Holding SA, T&K TOKA Corporation, DuPont, Dow, Dainichiseika Color & Chemicals Mfg Co Ltd, Siegwerk Druckfarben AG & Co KGaA, Tokyo Printing Ink Mfg Co Ltd, Sakata Inx Corporation, Zeller+Gmelin, Wikoff Color Corporation, Flint Group, Toyo Ink SC Holdings Co Ltd.
3. What are the main segments of the US Printing Inks Industry?
The market segments include Type, Process, Application.
4. Can you provide details about the market size?
The market size is estimated to be USD XX Million as of 2022.
5. What are some drivers contributing to market growth?
Growing Demand from the Digital Printing Industry; High Demand from the Packaging Sector.
6. What are the notable trends driving market growth?
Water-based Inks to Observe the Highest Growth.
7. Are there any restraints impacting market growth?
Rising Demand for Digital Advertisements and E-books; Stringent Regulations Regarding Disposal.
8. Can you provide examples of recent developments in the market?
In May 2021, Epple Druckfarben AG and Zeller+Gmelin GmbH & Co. KG were working together in the field of UV ink technology. The first result of this partnership is a jointly developed UV-LED ink for sheetfed offset. The products are developed for different areas of application, which Epple will market worldwide under the LightStar brand.
9. What pricing options are available for accessing the report?
Pricing options include single-user, multi-user, and enterprise licenses priced at USD 3800, USD 4500, and USD 5800 respectively.
10. Is the market size provided in terms of value or volume?
The market size is provided in terms of value, measured in Million and volume, measured in K Tons.
11. Are there any specific market keywords associated with the report?
Yes, the market keyword associated with the report is "US Printing Inks Industry," which aids in identifying and referencing the specific market segment covered.
12. How do I determine which pricing option suits my needs best?
The pricing options vary based on user requirements and access needs. Individual users may opt for single-user licenses, while businesses requiring broader access may choose multi-user or enterprise licenses for cost-effective access to the report.
13. Are there any additional resources or data provided in the US Printing Inks Industry report?
While the report offers comprehensive insights, it's advisable to review the specific contents or supplementary materials provided to ascertain if additional resources or data are available.
14. How can I stay updated on further developments or reports in the US Printing Inks Industry?
To stay informed about further developments, trends, and reports in the US Printing Inks Industry, consider subscribing to industry newsletters, following relevant companies and organizations, or regularly checking reputable industry news sources and publications.
Methodology
Step 1 - Identification of Relevant Samples Size from Population Database


Step 2 - Approaches for Defining Global Market Size (Value, Volume* & Price*)

Note*: In applicable scenarios
Step 3 - Data Sources
Primary Research
- Web Analytics
- Survey Reports
- Research Institute
- Latest Research Reports
- Opinion Leaders
Secondary Research
- Annual Reports
- White Paper
- Latest Press Release
- Industry Association
- Paid Database
- Investor Presentations

Step 4 - Data Triangulation
Involves using different sources of information in order to increase the validity of a study
These sources are likely to be stakeholders in a program - participants, other researchers, program staff, other community members, and so on.
Then we put all data in single framework & apply various statistical tools to find out the dynamic on the market.
During the analysis stage, feedback from the stakeholder groups would be compared to determine areas of agreement as well as areas of divergence


