
Key Insights
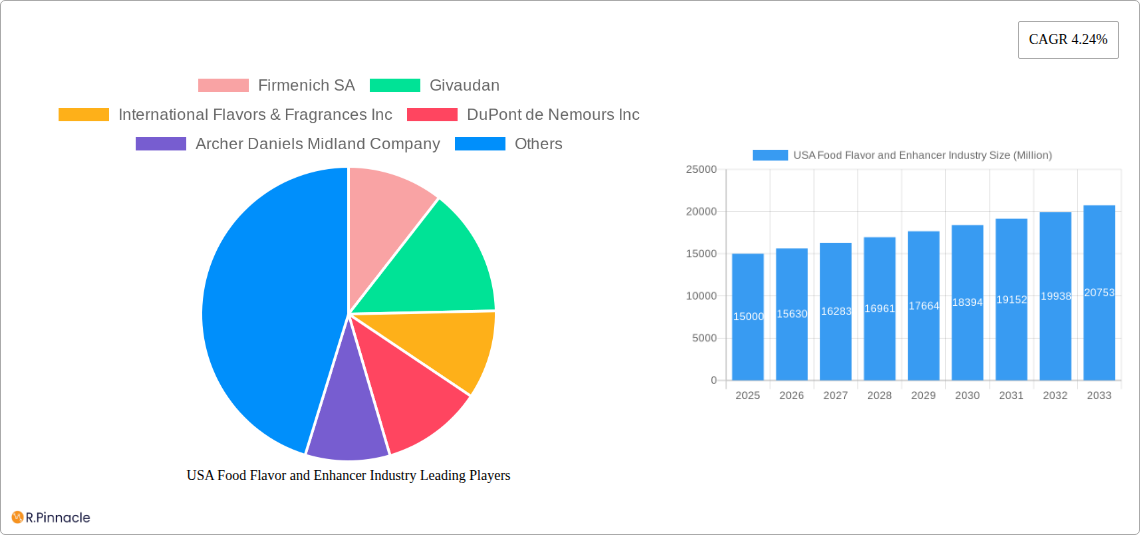
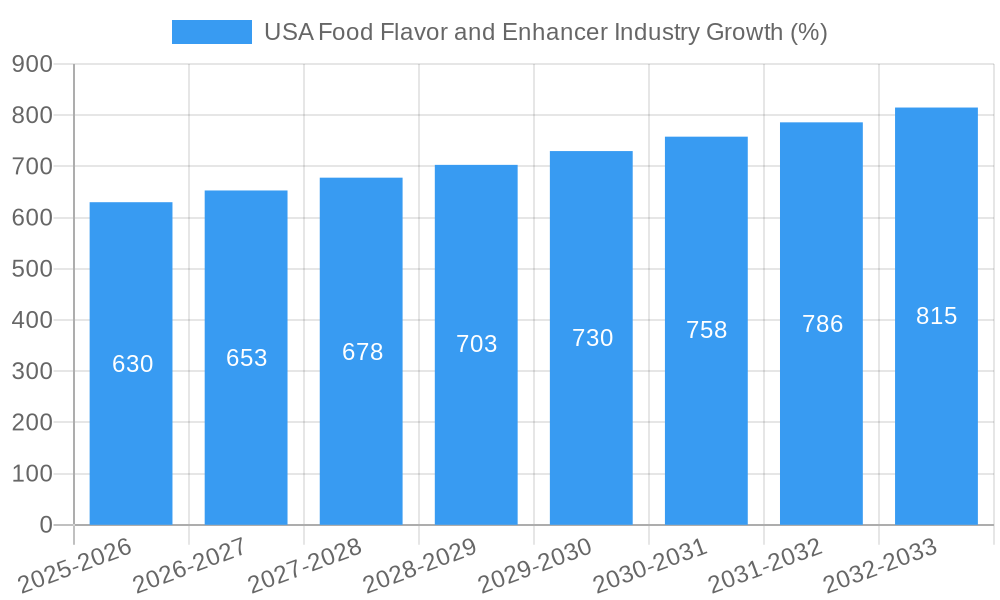
The U.S. food flavor and enhancer market, valued at approximately $XX million in 2025, is projected to experience robust growth, driven by increasing consumer demand for diverse and appealing food and beverage products. A compound annual growth rate (CAGR) of 4.24% from 2025 to 2033 indicates a significant expansion of this market. Key drivers include the rising popularity of processed foods, convenience foods, and ready-to-eat meals, all of which heavily rely on flavors and enhancers to enhance taste and appeal. Furthermore, health and wellness trends are influencing the market, with consumers increasingly seeking natural and clean-label options. This is leading to increased demand for natural and nature-identical flavorings, as well as flavor enhancers that contribute to reduced sodium or sugar content. Segment-wise, the dairy products, bakery and confectionery, and beverage applications are expected to be major contributors to overall market growth, followed by the savory and soups, pasta, and noodles categories. Major players like Firmenich SA, Givaudan, and International Flavors & Fragrances Inc. are actively engaged in research and development to cater to evolving consumer preferences and regulatory changes, further fueling market expansion.
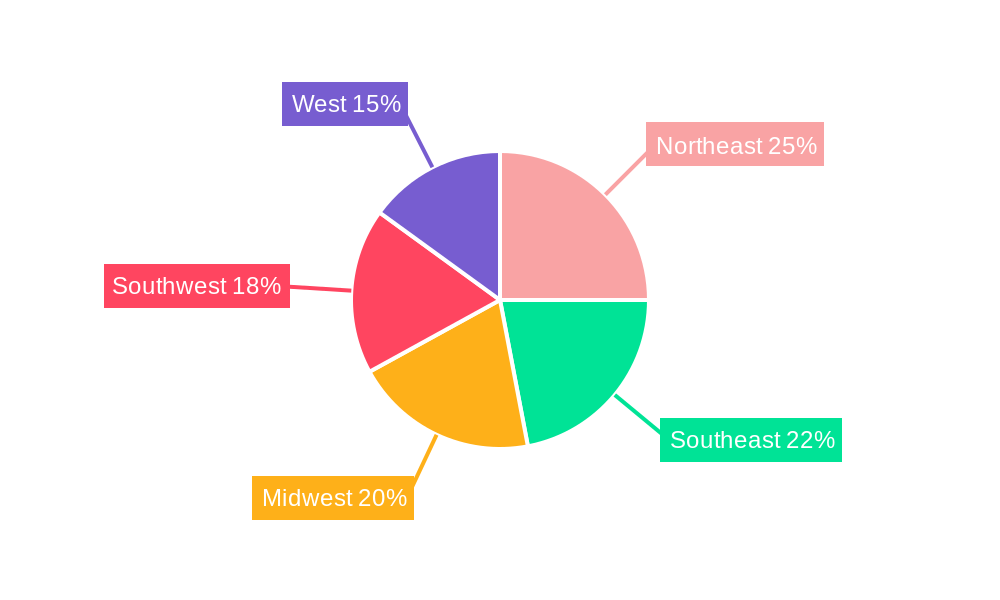
The market segmentation within the U.S. reveals distinct growth trajectories. While the nature-identical flavoring segment benefits from consumer preference for natural ingredients, flavor enhancers are experiencing growth due to their role in cost reduction and improved product quality. Regional variations exist, with the Northeast, West, and Southeast likely leading in market share due to higher population density and consumption patterns. However, consistent growth is expected across all regions due to the widespread adoption of flavor and enhancer products in the food industry. Potential restraints include fluctuating raw material costs and stringent regulatory requirements for food additives. Nevertheless, the overall market outlook remains positive, driven by innovation in flavor technology and the increasing demand for enhanced culinary experiences. Continuous adaptation to consumer preferences and technological advancements will be crucial for market players to maintain a competitive edge and capitalize on emerging opportunities.
USA Food Flavor and Enhancer Industry Report: 2019-2033
This comprehensive report provides a detailed analysis of the USA food flavor and enhancer industry, offering invaluable insights for industry professionals, investors, and strategic decision-makers. The study covers the period from 2019 to 2033, with a focus on the estimated year 2025 and a forecast period extending to 2033. The report utilizes a robust methodology incorporating extensive primary and secondary research to deliver accurate and actionable market intelligence. Expect detailed analysis on market size (in Millions), CAGR, segment-specific growth projections, and competitive dynamics, contributing significantly to informed strategic planning.
USA Food Flavor and Enhancer Industry Market Structure & Innovation Trends
This section analyzes the competitive landscape of the US food flavor and enhancer market, examining market concentration, innovation drivers, regulatory frameworks, and market dynamics. Key players like Firmenich SA, Givaudan, International Flavors & Fragrances Inc, DuPont de Nemours Inc, Archer Daniels Midland Company, Koninklijke DSM N V, and FMC Corporation (list not exhaustive) are evaluated for their market share and strategic initiatives. The report delves into the impact of mergers and acquisitions (M&A) activities, quantifying deal values where possible, and assessing their influence on market structure. Innovation drivers such as consumer demand for natural and clean-label products and the emergence of novel flavor profiles are analyzed, alongside the regulatory landscape shaping product development and market access. The report also explores the impact of substitute products and evolving end-user demographics on market trends. Market concentration is assessed, possibly revealing a highly concentrated or fragmented market structure. Expected M&A deal values are estimated at xx Million for the period under review.
USA Food Flavor and Enhancer Industry Market Dynamics & Trends
This section provides a thorough examination of market growth drivers, technological advancements, consumer preferences, and competitive dynamics within the USA food flavor and enhancer industry. The analysis covers the period from 2019 to 2033, providing a historical perspective and detailed future projections. We will explore the impact of key factors on market growth, including the increasing demand for convenient and ready-to-eat foods, the growing popularity of ethnic cuisines, and evolving consumer preferences towards healthier and natural food options. Technological disruptions such as the application of biotechnology and precision fermentation are examined for their potential to revolutionize flavor creation and delivery. Competitive dynamics are detailed, focusing on pricing strategies, product differentiation, and brand building activities. The report will include a comprehensive analysis of the Compound Annual Growth Rate (CAGR) and market penetration rates for different segments throughout the forecast period. We project a xx% CAGR for the overall market between 2025 and 2033.
Dominant Regions & Segments in USA Food Flavor and Enhancer Industry
This section identifies the leading regions and segments within the USA food flavor and enhancer market. The analysis considers both "By Type" (Flavors, Nature Identical Flavoring, Flavor Enhancers) and "By Application" (Dairy Products, Bakery and Confectionery, Savory, Soups, Pasta and Noodles, Beverage, Others). The dominance of specific regions or segments will be meticulously analyzed based on factors such as market size, growth rate, and consumer demand.
- Key Drivers (Examples):
- Robust economic growth in specific regions.
- Well-established food processing and manufacturing infrastructure.
- Favorable government policies supporting the food industry.
- High per capita consumption of processed foods.
The report will delve into the specific reasons for the dominance of leading regions and segments, providing a detailed understanding of the underlying market dynamics. For example, the Bakery and Confectionery segment is expected to dominate due to xx reasons.
USA Food Flavor and Enhancer Industry Product Innovations
This section summarizes recent product developments and innovations within the USA food flavor and enhancer industry. The report will highlight technological advancements, such as the use of advanced analytical techniques to develop customized flavor profiles, and the application of bio-based ingredients to create sustainable and natural flavor solutions. Specific examples of innovative products and their competitive advantages will be discussed, emphasizing their market fit and potential for future growth. The increasing demand for clean-label products drives innovation in natural and organic flavoring solutions.
Report Scope & Segmentation Analysis
This report provides a comprehensive segmentation analysis of the USA food flavor and enhancer market, based on "By Type" and "By Application". The study covers:
- By Type: Flavors, Nature Identical Flavoring, Flavor Enhancers. Each segment’s growth projections, market sizes (in Millions), and competitive dynamics will be analyzed. For example, the Nature Identical Flavoring segment is expected to show xx Million growth in the forecast period.
- By Application: Dairy Products, Bakery and Confectionery, Savory, Soups, Pasta and Noodles, Beverage, Others. Similar analysis as above will be applied to each application segment. The Bakery and Confectionery segment is estimated to represent xx Million of the market.
This comprehensive segmentation will provide insights into the various market niches and their respective growth opportunities.
Key Drivers of USA Food Flavor and Enhancer Industry Growth
The growth of the USA food flavor and enhancer industry is driven by several key factors. Technological advancements in flavor creation and delivery systems are leading to more sophisticated and customized flavor profiles. The expanding food processing and manufacturing sector is fueling demand for high-quality flavors and enhancers. Changing consumer preferences, such as a growing preference for convenient and ready-to-eat foods, are driving the industry's growth. Government regulations, however, can either stimulate or constrain market expansion, depending on their specific nature.
Challenges in the USA Food Flavor and Enhancer Industry Sector
The USA food flavor and enhancer industry faces several challenges, including stringent regulatory requirements related to food safety and labeling. Supply chain disruptions and volatility in raw material prices can impact production costs and profitability. Intense competition from both domestic and international players can exert pressure on pricing and market share. The estimated impact of these challenges on market growth is projected at xx%.
Emerging Opportunities in USA Food Flavor and Enhancer Industry
Despite challenges, significant opportunities exist for growth in the USA food flavor and enhancer industry. The increasing demand for clean-label and natural products presents an opportunity for companies to develop and market innovative flavor solutions using natural ingredients. The rising popularity of personalized nutrition and functional foods offers prospects for developing tailored flavor profiles for specific health needs and consumer preferences. Emerging markets, such as plant-based alternatives, further expand the potential market for flavor and enhancer solutions.
Leading Players in the USA Food Flavor and Enhancer Industry Market
- Firmenich SA
- Givaudan
- International Flavors & Fragrances Inc
- DuPont de Nemours Inc
- Archer Daniels Midland Company
- Koninklijke DSM N V
- FMC Corporation
- List Not Exhaustive
Key Developments in USA Food Flavor and Enhancer Industry Industry
- 2022-Q4: Company X launched a new line of natural flavor enhancers.
- 2023-Q1: A major merger between two flavor companies reshaped the market landscape.
- 2023-Q3: New regulations on labeling impacted the market.
- Further developments will be detailed in the full report.
Future Outlook for USA Food Flavor and Enhancer Industry Market
The future outlook for the USA food flavor and enhancer industry is positive, driven by continued growth in the food and beverage sector, evolving consumer preferences, and ongoing innovation in flavor technology. Strategic opportunities exist for companies that can adapt to changing market trends and consumer demands, developing sustainable and natural flavor solutions. The market's expansion is expected to accelerate in the coming years, presenting significant opportunities for growth and investment.
USA Food Flavor and Enhancer Industry Segmentation
-
1. Type
-
1.1. Flavors
- 1.1.1. Natural Flavor
- 1.1.2. Synthetic Flavor
- 1.1.3. Nature Identical Flavoring
- 1.2. Flavor Enhancers
-
1.1. Flavors
-
2. Application
- 2.1. Dairy Products
- 2.2. Bakery and Confectionery
- 2.3. Savory
- 2.4. Soups, Pasta and Noodles
- 2.5. Beverage
- 2.6. Others
USA Food Flavor and Enhancer Industry Segmentation By Geography
-
1. North America
- 1.1. United States
- 1.2. Canada
- 1.3. Mexico
-
2. South America
- 2.1. Brazil
- 2.2. Argentina
- 2.3. Rest of South America
-
3. Europe
- 3.1. United Kingdom
- 3.2. Germany
- 3.3. France
- 3.4. Italy
- 3.5. Spain
- 3.6. Russia
- 3.7. Benelux
- 3.8. Nordics
- 3.9. Rest of Europe
-
4. Middle East & Africa
- 4.1. Turkey
- 4.2. Israel
- 4.3. GCC
- 4.4. North Africa
- 4.5. South Africa
- 4.6. Rest of Middle East & Africa
-
5. Asia Pacific
- 5.1. China
- 5.2. India
- 5.3. Japan
- 5.4. South Korea
- 5.5. ASEAN
- 5.6. Oceania
- 5.7. Rest of Asia Pacific
USA Food Flavor and Enhancer Industry REPORT HIGHLIGHTS
| Aspects | Details |
|---|---|
| Study Period | 2019-2033 |
| Base Year | 2024 |
| Estimated Year | 2025 |
| Forecast Period | 2025-2033 |
| Historical Period | 2019-2024 |
| Growth Rate | CAGR of 4.24% from 2019-2033 |
| Segmentation |
|
Table of Contents
- 1. Introduction
- 1.1. Research Scope
- 1.2. Market Segmentation
- 1.3. Research Methodology
- 1.4. Definitions and Assumptions
- 2. Executive Summary
- 2.1. Introduction
- 3. Market Dynamics
- 3.1. Introduction
- 3.2. Market Drivers
- 3.2.1. The Rising Awareness of the Health Benefits Associated with Collagen Consumption; Rising Sport and Fitness Trends Drives the Market Growth
- 3.3. Market Restrains
- 3.3.1. Concerns over the Source and Animal Welfare in Collagen Extraction Limit the Market Growth
- 3.4. Market Trends
- 3.4.1. Increasing Demand For Natural Food Flavors and Enhancers
- 4. Market Factor Analysis
- 4.1. Porters Five Forces
- 4.2. Supply/Value Chain
- 4.3. PESTEL analysis
- 4.4. Market Entropy
- 4.5. Patent/Trademark Analysis
- 5. Global USA Food Flavor and Enhancer Industry Analysis, Insights and Forecast, 2019-2031
- 5.1. Market Analysis, Insights and Forecast - by Type
- 5.1.1. Flavors
- 5.1.1.1. Natural Flavor
- 5.1.1.2. Synthetic Flavor
- 5.1.1.3. Nature Identical Flavoring
- 5.1.2. Flavor Enhancers
- 5.1.1. Flavors
- 5.2. Market Analysis, Insights and Forecast - by Application
- 5.2.1. Dairy Products
- 5.2.2. Bakery and Confectionery
- 5.2.3. Savory
- 5.2.4. Soups, Pasta and Noodles
- 5.2.5. Beverage
- 5.2.6. Others
- 5.3. Market Analysis, Insights and Forecast - by Region
- 5.3.1. North America
- 5.3.2. South America
- 5.3.3. Europe
- 5.3.4. Middle East & Africa
- 5.3.5. Asia Pacific
- 5.1. Market Analysis, Insights and Forecast - by Type
- 6. North America USA Food Flavor and Enhancer Industry Analysis, Insights and Forecast, 2019-2031
- 6.1. Market Analysis, Insights and Forecast - by Type
- 6.1.1. Flavors
- 6.1.1.1. Natural Flavor
- 6.1.1.2. Synthetic Flavor
- 6.1.1.3. Nature Identical Flavoring
- 6.1.2. Flavor Enhancers
- 6.1.1. Flavors
- 6.2. Market Analysis, Insights and Forecast - by Application
- 6.2.1. Dairy Products
- 6.2.2. Bakery and Confectionery
- 6.2.3. Savory
- 6.2.4. Soups, Pasta and Noodles
- 6.2.5. Beverage
- 6.2.6. Others
- 6.1. Market Analysis, Insights and Forecast - by Type
- 7. South America USA Food Flavor and Enhancer Industry Analysis, Insights and Forecast, 2019-2031
- 7.1. Market Analysis, Insights and Forecast - by Type
- 7.1.1. Flavors
- 7.1.1.1. Natural Flavor
- 7.1.1.2. Synthetic Flavor
- 7.1.1.3. Nature Identical Flavoring
- 7.1.2. Flavor Enhancers
- 7.1.1. Flavors
- 7.2. Market Analysis, Insights and Forecast - by Application
- 7.2.1. Dairy Products
- 7.2.2. Bakery and Confectionery
- 7.2.3. Savory
- 7.2.4. Soups, Pasta and Noodles
- 7.2.5. Beverage
- 7.2.6. Others
- 7.1. Market Analysis, Insights and Forecast - by Type
- 8. Europe USA Food Flavor and Enhancer Industry Analysis, Insights and Forecast, 2019-2031
- 8.1. Market Analysis, Insights and Forecast - by Type
- 8.1.1. Flavors
- 8.1.1.1. Natural Flavor
- 8.1.1.2. Synthetic Flavor
- 8.1.1.3. Nature Identical Flavoring
- 8.1.2. Flavor Enhancers
- 8.1.1. Flavors
- 8.2. Market Analysis, Insights and Forecast - by Application
- 8.2.1. Dairy Products
- 8.2.2. Bakery and Confectionery
- 8.2.3. Savory
- 8.2.4. Soups, Pasta and Noodles
- 8.2.5. Beverage
- 8.2.6. Others
- 8.1. Market Analysis, Insights and Forecast - by Type
- 9. Middle East & Africa USA Food Flavor and Enhancer Industry Analysis, Insights and Forecast, 2019-2031
- 9.1. Market Analysis, Insights and Forecast - by Type
- 9.1.1. Flavors
- 9.1.1.1. Natural Flavor
- 9.1.1.2. Synthetic Flavor
- 9.1.1.3. Nature Identical Flavoring
- 9.1.2. Flavor Enhancers
- 9.1.1. Flavors
- 9.2. Market Analysis, Insights and Forecast - by Application
- 9.2.1. Dairy Products
- 9.2.2. Bakery and Confectionery
- 9.2.3. Savory
- 9.2.4. Soups, Pasta and Noodles
- 9.2.5. Beverage
- 9.2.6. Others
- 9.1. Market Analysis, Insights and Forecast - by Type
- 10. Asia Pacific USA Food Flavor and Enhancer Industry Analysis, Insights and Forecast, 2019-2031
- 10.1. Market Analysis, Insights and Forecast - by Type
- 10.1.1. Flavors
- 10.1.1.1. Natural Flavor
- 10.1.1.2. Synthetic Flavor
- 10.1.1.3. Nature Identical Flavoring
- 10.1.2. Flavor Enhancers
- 10.1.1. Flavors
- 10.2. Market Analysis, Insights and Forecast - by Application
- 10.2.1. Dairy Products
- 10.2.2. Bakery and Confectionery
- 10.2.3. Savory
- 10.2.4. Soups, Pasta and Noodles
- 10.2.5. Beverage
- 10.2.6. Others
- 10.1. Market Analysis, Insights and Forecast - by Type
- 11. Northeast USA Food Flavor and Enhancer Industry Analysis, Insights and Forecast, 2019-2031
- 12. Southeast USA Food Flavor and Enhancer Industry Analysis, Insights and Forecast, 2019-2031
- 13. Midwest USA Food Flavor and Enhancer Industry Analysis, Insights and Forecast, 2019-2031
- 14. Southwest USA Food Flavor and Enhancer Industry Analysis, Insights and Forecast, 2019-2031
- 15. West USA Food Flavor and Enhancer Industry Analysis, Insights and Forecast, 2019-2031
- 16. Competitive Analysis
- 16.1. Global Market Share Analysis 2024
- 16.2. Company Profiles
- 16.2.1 Firmenich SA
- 16.2.1.1. Overview
- 16.2.1.2. Products
- 16.2.1.3. SWOT Analysis
- 16.2.1.4. Recent Developments
- 16.2.1.5. Financials (Based on Availability)
- 16.2.2 Givaudan
- 16.2.2.1. Overview
- 16.2.2.2. Products
- 16.2.2.3. SWOT Analysis
- 16.2.2.4. Recent Developments
- 16.2.2.5. Financials (Based on Availability)
- 16.2.3 International Flavors & Fragrances Inc
- 16.2.3.1. Overview
- 16.2.3.2. Products
- 16.2.3.3. SWOT Analysis
- 16.2.3.4. Recent Developments
- 16.2.3.5. Financials (Based on Availability)
- 16.2.4 DuPont de Nemours Inc
- 16.2.4.1. Overview
- 16.2.4.2. Products
- 16.2.4.3. SWOT Analysis
- 16.2.4.4. Recent Developments
- 16.2.4.5. Financials (Based on Availability)
- 16.2.5 Archer Daniels Midland Company
- 16.2.5.1. Overview
- 16.2.5.2. Products
- 16.2.5.3. SWOT Analysis
- 16.2.5.4. Recent Developments
- 16.2.5.5. Financials (Based on Availability)
- 16.2.6 Koninklijke DSM N V
- 16.2.6.1. Overview
- 16.2.6.2. Products
- 16.2.6.3. SWOT Analysis
- 16.2.6.4. Recent Developments
- 16.2.6.5. Financials (Based on Availability)
- 16.2.7 FMC Corporation*List Not Exhaustive
- 16.2.7.1. Overview
- 16.2.7.2. Products
- 16.2.7.3. SWOT Analysis
- 16.2.7.4. Recent Developments
- 16.2.7.5. Financials (Based on Availability)
- 16.2.1 Firmenich SA
List of Figures
- Figure 1: Global USA Food Flavor and Enhancer Industry Revenue Breakdown (Million, %) by Region 2024 & 2032
- Figure 2: United states USA Food Flavor and Enhancer Industry Revenue (Million), by Country 2024 & 2032
- Figure 3: United states USA Food Flavor and Enhancer Industry Revenue Share (%), by Country 2024 & 2032
- Figure 4: North America USA Food Flavor and Enhancer Industry Revenue (Million), by Type 2024 & 2032
- Figure 5: North America USA Food Flavor and Enhancer Industry Revenue Share (%), by Type 2024 & 2032
- Figure 6: North America USA Food Flavor and Enhancer Industry Revenue (Million), by Application 2024 & 2032
- Figure 7: North America USA Food Flavor and Enhancer Industry Revenue Share (%), by Application 2024 & 2032
- Figure 8: North America USA Food Flavor and Enhancer Industry Revenue (Million), by Country 2024 & 2032
- Figure 9: North America USA Food Flavor and Enhancer Industry Revenue Share (%), by Country 2024 & 2032
- Figure 10: South America USA Food Flavor and Enhancer Industry Revenue (Million), by Type 2024 & 2032
- Figure 11: South America USA Food Flavor and Enhancer Industry Revenue Share (%), by Type 2024 & 2032
- Figure 12: South America USA Food Flavor and Enhancer Industry Revenue (Million), by Application 2024 & 2032
- Figure 13: South America USA Food Flavor and Enhancer Industry Revenue Share (%), by Application 2024 & 2032
- Figure 14: South America USA Food Flavor and Enhancer Industry Revenue (Million), by Country 2024 & 2032
- Figure 15: South America USA Food Flavor and Enhancer Industry Revenue Share (%), by Country 2024 & 2032
- Figure 16: Europe USA Food Flavor and Enhancer Industry Revenue (Million), by Type 2024 & 2032
- Figure 17: Europe USA Food Flavor and Enhancer Industry Revenue Share (%), by Type 2024 & 2032
- Figure 18: Europe USA Food Flavor and Enhancer Industry Revenue (Million), by Application 2024 & 2032
- Figure 19: Europe USA Food Flavor and Enhancer Industry Revenue Share (%), by Application 2024 & 2032
- Figure 20: Europe USA Food Flavor and Enhancer Industry Revenue (Million), by Country 2024 & 2032
- Figure 21: Europe USA Food Flavor and Enhancer Industry Revenue Share (%), by Country 2024 & 2032
- Figure 22: Middle East & Africa USA Food Flavor and Enhancer Industry Revenue (Million), by Type 2024 & 2032
- Figure 23: Middle East & Africa USA Food Flavor and Enhancer Industry Revenue Share (%), by Type 2024 & 2032
- Figure 24: Middle East & Africa USA Food Flavor and Enhancer Industry Revenue (Million), by Application 2024 & 2032
- Figure 25: Middle East & Africa USA Food Flavor and Enhancer Industry Revenue Share (%), by Application 2024 & 2032
- Figure 26: Middle East & Africa USA Food Flavor and Enhancer Industry Revenue (Million), by Country 2024 & 2032
- Figure 27: Middle East & Africa USA Food Flavor and Enhancer Industry Revenue Share (%), by Country 2024 & 2032
- Figure 28: Asia Pacific USA Food Flavor and Enhancer Industry Revenue (Million), by Type 2024 & 2032
- Figure 29: Asia Pacific USA Food Flavor and Enhancer Industry Revenue Share (%), by Type 2024 & 2032
- Figure 30: Asia Pacific USA Food Flavor and Enhancer Industry Revenue (Million), by Application 2024 & 2032
- Figure 31: Asia Pacific USA Food Flavor and Enhancer Industry Revenue Share (%), by Application 2024 & 2032
- Figure 32: Asia Pacific USA Food Flavor and Enhancer Industry Revenue (Million), by Country 2024 & 2032
- Figure 33: Asia Pacific USA Food Flavor and Enhancer Industry Revenue Share (%), by Country 2024 & 2032
List of Tables
- Table 1: Global USA Food Flavor and Enhancer Industry Revenue Million Forecast, by Region 2019 & 2032
- Table 2: Global USA Food Flavor and Enhancer Industry Revenue Million Forecast, by Type 2019 & 2032
- Table 3: Global USA Food Flavor and Enhancer Industry Revenue Million Forecast, by Application 2019 & 2032
- Table 4: Global USA Food Flavor and Enhancer Industry Revenue Million Forecast, by Region 2019 & 2032
- Table 5: Global USA Food Flavor and Enhancer Industry Revenue Million Forecast, by Country 2019 & 2032
- Table 6: Northeast USA Food Flavor and Enhancer Industry Revenue (Million) Forecast, by Application 2019 & 2032
- Table 7: Southeast USA Food Flavor and Enhancer Industry Revenue (Million) Forecast, by Application 2019 & 2032
- Table 8: Midwest USA Food Flavor and Enhancer Industry Revenue (Million) Forecast, by Application 2019 & 2032
- Table 9: Southwest USA Food Flavor and Enhancer Industry Revenue (Million) Forecast, by Application 2019 & 2032
- Table 10: West USA Food Flavor and Enhancer Industry Revenue (Million) Forecast, by Application 2019 & 2032
- Table 11: Global USA Food Flavor and Enhancer Industry Revenue Million Forecast, by Type 2019 & 2032
- Table 12: Global USA Food Flavor and Enhancer Industry Revenue Million Forecast, by Application 2019 & 2032
- Table 13: Global USA Food Flavor and Enhancer Industry Revenue Million Forecast, by Country 2019 & 2032
- Table 14: United States USA Food Flavor and Enhancer Industry Revenue (Million) Forecast, by Application 2019 & 2032
- Table 15: Canada USA Food Flavor and Enhancer Industry Revenue (Million) Forecast, by Application 2019 & 2032
- Table 16: Mexico USA Food Flavor and Enhancer Industry Revenue (Million) Forecast, by Application 2019 & 2032
- Table 17: Global USA Food Flavor and Enhancer Industry Revenue Million Forecast, by Type 2019 & 2032
- Table 18: Global USA Food Flavor and Enhancer Industry Revenue Million Forecast, by Application 2019 & 2032
- Table 19: Global USA Food Flavor and Enhancer Industry Revenue Million Forecast, by Country 2019 & 2032
- Table 20: Brazil USA Food Flavor and Enhancer Industry Revenue (Million) Forecast, by Application 2019 & 2032
- Table 21: Argentina USA Food Flavor and Enhancer Industry Revenue (Million) Forecast, by Application 2019 & 2032
- Table 22: Rest of South America USA Food Flavor and Enhancer Industry Revenue (Million) Forecast, by Application 2019 & 2032
- Table 23: Global USA Food Flavor and Enhancer Industry Revenue Million Forecast, by Type 2019 & 2032
- Table 24: Global USA Food Flavor and Enhancer Industry Revenue Million Forecast, by Application 2019 & 2032
- Table 25: Global USA Food Flavor and Enhancer Industry Revenue Million Forecast, by Country 2019 & 2032
- Table 26: United Kingdom USA Food Flavor and Enhancer Industry Revenue (Million) Forecast, by Application 2019 & 2032
- Table 27: Germany USA Food Flavor and Enhancer Industry Revenue (Million) Forecast, by Application 2019 & 2032
- Table 28: France USA Food Flavor and Enhancer Industry Revenue (Million) Forecast, by Application 2019 & 2032
- Table 29: Italy USA Food Flavor and Enhancer Industry Revenue (Million) Forecast, by Application 2019 & 2032
- Table 30: Spain USA Food Flavor and Enhancer Industry Revenue (Million) Forecast, by Application 2019 & 2032
- Table 31: Russia USA Food Flavor and Enhancer Industry Revenue (Million) Forecast, by Application 2019 & 2032
- Table 32: Benelux USA Food Flavor and Enhancer Industry Revenue (Million) Forecast, by Application 2019 & 2032
- Table 33: Nordics USA Food Flavor and Enhancer Industry Revenue (Million) Forecast, by Application 2019 & 2032
- Table 34: Rest of Europe USA Food Flavor and Enhancer Industry Revenue (Million) Forecast, by Application 2019 & 2032
- Table 35: Global USA Food Flavor and Enhancer Industry Revenue Million Forecast, by Type 2019 & 2032
- Table 36: Global USA Food Flavor and Enhancer Industry Revenue Million Forecast, by Application 2019 & 2032
- Table 37: Global USA Food Flavor and Enhancer Industry Revenue Million Forecast, by Country 2019 & 2032
- Table 38: Turkey USA Food Flavor and Enhancer Industry Revenue (Million) Forecast, by Application 2019 & 2032
- Table 39: Israel USA Food Flavor and Enhancer Industry Revenue (Million) Forecast, by Application 2019 & 2032
- Table 40: GCC USA Food Flavor and Enhancer Industry Revenue (Million) Forecast, by Application 2019 & 2032
- Table 41: North Africa USA Food Flavor and Enhancer Industry Revenue (Million) Forecast, by Application 2019 & 2032
- Table 42: South Africa USA Food Flavor and Enhancer Industry Revenue (Million) Forecast, by Application 2019 & 2032
- Table 43: Rest of Middle East & Africa USA Food Flavor and Enhancer Industry Revenue (Million) Forecast, by Application 2019 & 2032
- Table 44: Global USA Food Flavor and Enhancer Industry Revenue Million Forecast, by Type 2019 & 2032
- Table 45: Global USA Food Flavor and Enhancer Industry Revenue Million Forecast, by Application 2019 & 2032
- Table 46: Global USA Food Flavor and Enhancer Industry Revenue Million Forecast, by Country 2019 & 2032
- Table 47: China USA Food Flavor and Enhancer Industry Revenue (Million) Forecast, by Application 2019 & 2032
- Table 48: India USA Food Flavor and Enhancer Industry Revenue (Million) Forecast, by Application 2019 & 2032
- Table 49: Japan USA Food Flavor and Enhancer Industry Revenue (Million) Forecast, by Application 2019 & 2032
- Table 50: South Korea USA Food Flavor and Enhancer Industry Revenue (Million) Forecast, by Application 2019 & 2032
- Table 51: ASEAN USA Food Flavor and Enhancer Industry Revenue (Million) Forecast, by Application 2019 & 2032
- Table 52: Oceania USA Food Flavor and Enhancer Industry Revenue (Million) Forecast, by Application 2019 & 2032
- Table 53: Rest of Asia Pacific USA Food Flavor and Enhancer Industry Revenue (Million) Forecast, by Application 2019 & 2032
Frequently Asked Questions
1. What is the projected Compound Annual Growth Rate (CAGR) of the USA Food Flavor and Enhancer Industry?
The projected CAGR is approximately 4.24%.
2. Which companies are prominent players in the USA Food Flavor and Enhancer Industry?
Key companies in the market include Firmenich SA, Givaudan, International Flavors & Fragrances Inc, DuPont de Nemours Inc, Archer Daniels Midland Company, Koninklijke DSM N V, FMC Corporation*List Not Exhaustive.
3. What are the main segments of the USA Food Flavor and Enhancer Industry?
The market segments include Type, Application.
4. Can you provide details about the market size?
The market size is estimated to be USD XX Million as of 2022.
5. What are some drivers contributing to market growth?
The Rising Awareness of the Health Benefits Associated with Collagen Consumption; Rising Sport and Fitness Trends Drives the Market Growth.
6. What are the notable trends driving market growth?
Increasing Demand For Natural Food Flavors and Enhancers.
7. Are there any restraints impacting market growth?
Concerns over the Source and Animal Welfare in Collagen Extraction Limit the Market Growth.
8. Can you provide examples of recent developments in the market?
N/A
9. What pricing options are available for accessing the report?
Pricing options include single-user, multi-user, and enterprise licenses priced at USD 3800, USD 4500, and USD 5800 respectively.
10. Is the market size provided in terms of value or volume?
The market size is provided in terms of value, measured in Million.
11. Are there any specific market keywords associated with the report?
Yes, the market keyword associated with the report is "USA Food Flavor and Enhancer Industry," which aids in identifying and referencing the specific market segment covered.
12. How do I determine which pricing option suits my needs best?
The pricing options vary based on user requirements and access needs. Individual users may opt for single-user licenses, while businesses requiring broader access may choose multi-user or enterprise licenses for cost-effective access to the report.
13. Are there any additional resources or data provided in the USA Food Flavor and Enhancer Industry report?
While the report offers comprehensive insights, it's advisable to review the specific contents or supplementary materials provided to ascertain if additional resources or data are available.
14. How can I stay updated on further developments or reports in the USA Food Flavor and Enhancer Industry?
To stay informed about further developments, trends, and reports in the USA Food Flavor and Enhancer Industry, consider subscribing to industry newsletters, following relevant companies and organizations, or regularly checking reputable industry news sources and publications.
Methodology
Step 1 - Identification of Relevant Samples Size from Population Database


Step 2 - Approaches for Defining Global Market Size (Value, Volume* & Price*)

Note*: In applicable scenarios
Step 3 - Data Sources
Primary Research
- Web Analytics
- Survey Reports
- Research Institute
- Latest Research Reports
- Opinion Leaders
Secondary Research
- Annual Reports
- White Paper
- Latest Press Release
- Industry Association
- Paid Database
- Investor Presentations

Step 4 - Data Triangulation
Involves using different sources of information in order to increase the validity of a study
These sources are likely to be stakeholders in a program - participants, other researchers, program staff, other community members, and so on.
Then we put all data in single framework & apply various statistical tools to find out the dynamic on the market.
During the analysis stage, feedback from the stakeholder groups would be compared to determine areas of agreement as well as areas of divergence


