
Key Insights
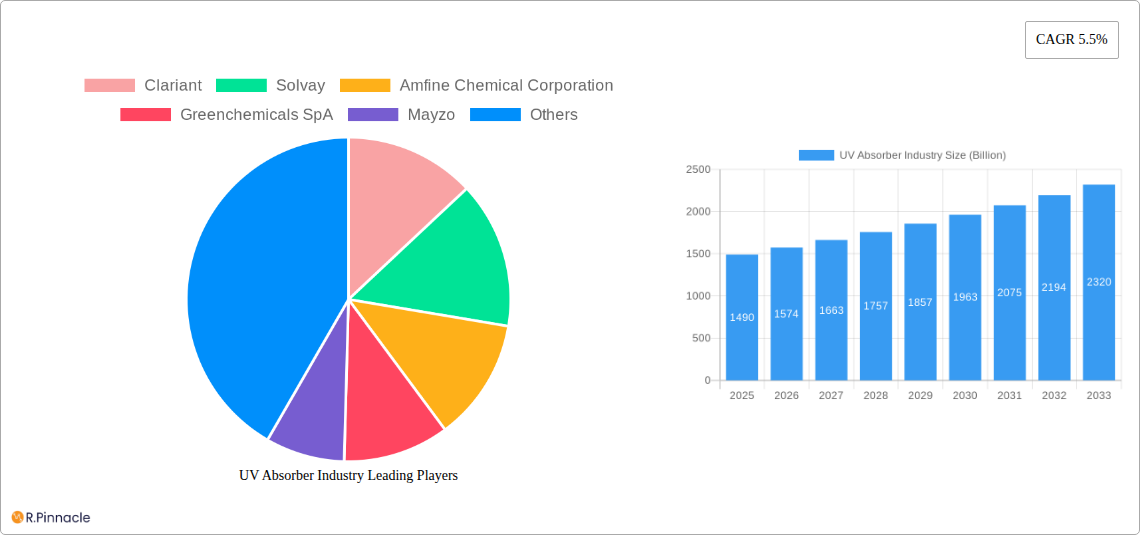
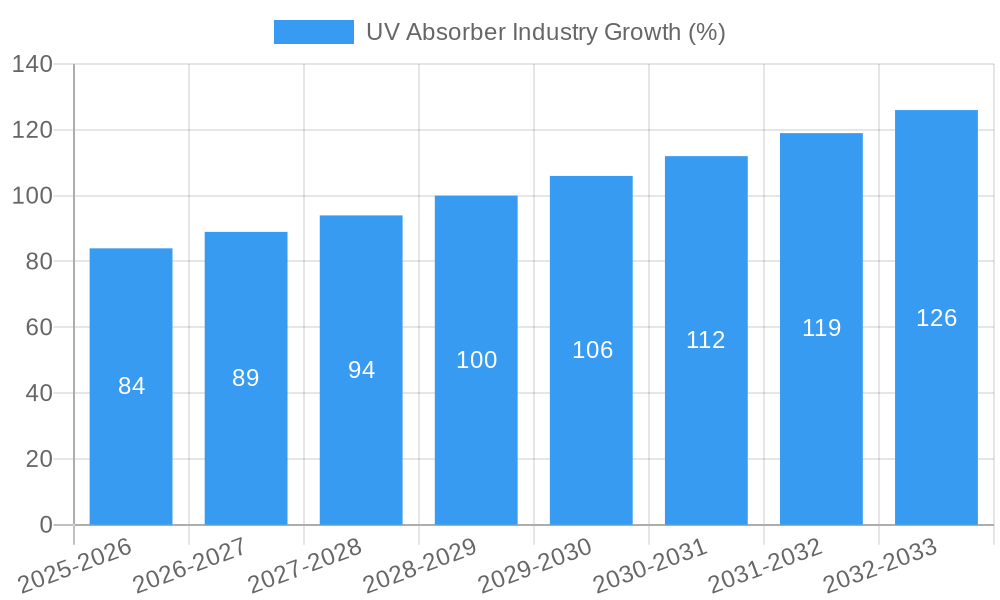
The UV absorber market, valued at $1.49 billion in 2025, is projected to experience robust growth, driven by increasing demand across diverse sectors. A Compound Annual Growth Rate (CAGR) of 5.5% from 2025 to 2033 indicates a significant expansion, fueled by several key factors. The rising adoption of UV absorbers in personal care products to protect against sun damage is a primary driver. Furthermore, the growing plastics industry, with its need for UV stabilization to enhance product durability and longevity, significantly contributes to market expansion. The construction and coatings industries also rely heavily on UV absorbers for protecting materials from degradation caused by sunlight exposure, bolstering market demand. Within the product segments, benzotriazoles and benzophenones are expected to maintain substantial market shares due to their established effectiveness and widespread application. However, the market faces challenges such as stringent regulatory compliance requirements and the potential for the development of alternative UV protection technologies. Regional growth will likely be influenced by economic development and industrialization rates; Asia-Pacific, with its rapidly expanding manufacturing and consumer goods sectors, is projected to be a significant growth region. The competitive landscape is characterized by a mix of large multinational corporations and smaller specialized chemical manufacturers, with ongoing innovation in UV absorber chemistry and application technologies shaping market dynamics.
The forecast period (2025-2033) anticipates continued expansion of the UV absorber market, largely driven by the increasing awareness of UV radiation’s harmful effects and the development of novel applications. Innovation in UV absorber technology, focusing on improved performance, sustainability, and regulatory compliance, will play a crucial role in shaping future market trends. The emergence of biodegradable and eco-friendly UV absorbers will likely influence consumer preferences and drive adoption in environmentally conscious sectors. Geographic expansion into emerging markets will also contribute to overall market growth. While price fluctuations in raw materials and potential economic downturns could pose challenges, the overall outlook for the UV absorber market remains positive, with continued growth anticipated across various segments and regions.
UV Absorber Industry Market Report: 2019-2033
This comprehensive report provides an in-depth analysis of the global UV absorber market, projecting a market value exceeding $XX Billion by 2033. The study period spans from 2019 to 2033, with 2025 serving as the base and estimated year. This report is essential for industry professionals, investors, and researchers seeking to understand the market dynamics, competitive landscape, and future growth potential of this vital sector.
UV Absorber Industry Market Structure & Innovation Trends
The UV absorber market exhibits a moderately concentrated structure, with key players like Clariant, Solvay, and BASF SE holding significant market share. The market share distribution among these leading players is estimated at approximately XX% in 2025. Innovation is driven by the increasing demand for high-performance UV absorbers across various applications, prompting continuous research and development in novel chemical formulations. Stringent regulatory frameworks, particularly concerning environmental and health standards, significantly influence product development and market entry. The market also witnesses increasing M&A activity, with deal values totaling over $XX Billion in the period 2019-2024, signifying consolidation and expansion strategies among industry giants. Substitute products, such as natural UV protectors, pose a growing challenge, while end-user demographics show a shift towards environmentally conscious consumers influencing product choice.
- Market Concentration: Moderately concentrated, with top 3 players holding approximately XX% market share (2025).
- Innovation Drivers: Demand for high-performance absorbers, stringent regulations.
- M&A Activity: Deal values exceeding $XX Billion (2019-2024).
- Product Substitutes: Growing competition from natural UV protectors.
UV Absorber Industry Market Dynamics & Trends
The global UV absorber market is experiencing robust growth, driven primarily by the expanding applications across various industries. The increasing demand for UV protection in personal care products, plastics, and coatings fuels market expansion. Technological advancements are enabling the development of more effective and sustainable UV absorbers, further enhancing market penetration. Consumer preferences are shifting towards eco-friendly and high-performance products, while competitive dynamics are characterized by continuous innovation and strategic partnerships. The Compound Annual Growth Rate (CAGR) for the forecast period (2025-2033) is projected at XX%, indicating significant growth potential. Market penetration in emerging economies is also expected to rise considerably, contributing to the overall market expansion.
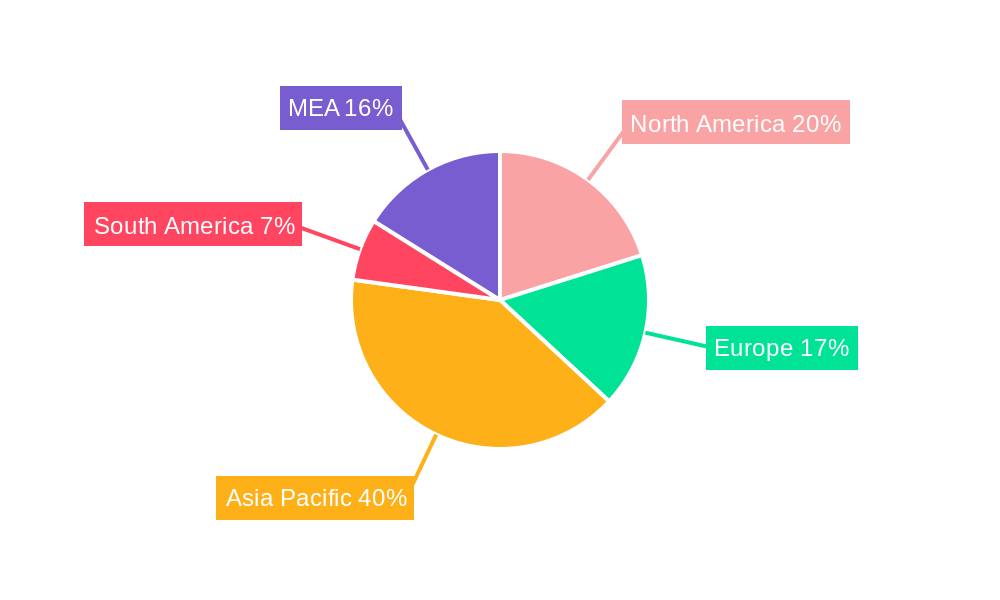
Dominant Regions & Segments in UV Absorber Industry
The Asia-Pacific region is expected to dominate the UV absorber market throughout the forecast period, driven by robust economic growth and increasing industrialization. Within this region, China and India are key growth drivers.
- Leading Region: Asia-Pacific (driven by economic growth and industrialization)
- Leading Type: Benzotriazole (owing to its cost-effectiveness and high performance)
- Leading Application: Plastics (due to its widespread use in various plastic products)
Key drivers for dominance include favorable economic policies supporting industrial development, expanding infrastructure projects, and rising disposable incomes leading to increased consumer spending on UV-protected products. The North American and European markets also contribute significantly, though at a slightly slower pace compared to the Asia-Pacific region.
UV Absorber Industry Product Innovations
Recent innovations focus on developing environmentally friendly UV absorbers with enhanced performance and longer durability. These include biodegradable and bio-based UV absorbers designed to minimize environmental impact. The focus is also on developing specialized UV absorbers tailored for specific applications, such as high-temperature resistance for plastics and enhanced skin compatibility for personal care products. This results in a competitive landscape that prizes sustainability and specialized functionalities.
Report Scope & Segmentation Analysis
The report segments the market based on type (Benzotriazole, Triazine, Benzophenone, Others) and application (Adhesives, Coatings, Personal Care, Plastics, Others). Each segment's growth trajectory, market size, and competitive dynamics are thoroughly examined. For instance, the Benzotriazole segment holds a substantial market share due to its cost-effectiveness, while the personal care application is anticipated to witness significant growth due to rising consumer awareness of sun protection.
Key Drivers of UV Absorber Industry Growth
Several factors contribute to the growth of the UV absorber industry. These include increasing demand from various industries, technological advancements leading to the development of superior UV absorbers, stringent regulations regarding UV radiation exposure, and the growing consumer awareness of the harmful effects of UV radiation. The rising adoption of UV-protective technologies in diverse industries will further propel market growth.
Challenges in the UV Absorber Industry Sector
The industry faces challenges like stringent regulatory requirements concerning chemical composition and environmental impact, supply chain disruptions affecting raw material availability, and intense competition from both established players and new entrants. These factors can impact production costs and market access, thus necessitating strategic adjustments by companies.
Emerging Opportunities in UV Absorber Industry
Emerging opportunities lie in developing sustainable and biodegradable UV absorbers, tapping into untapped markets in developing economies, and innovating new applications, such as in textiles and construction materials. Furthermore, strategic partnerships and collaborations will facilitate the introduction of novel technologies and market expansion.
Leading Players in the UV Absorber Industry Market
- Clariant
- Solvay
- Amfine Chemical Corporation
- Greenchemicals SpA
- Mayzo
- Everlight Chemical Industrial Corp
- Anhui Best Progress Imp & Exp Co Ltd
- BASF SE
- Huntsman International LLC
- Partners in Chemicals
- Hangzhou Disheng Import&Export Co Ltd
- Suqian Liansheng Technology Co Ltd
- Rianlon Corporation
- NYACOL® Nano Technologies Inc
- Suqian Liansheng Technology Co Ltd
- SABO S p A
- Hunan Chemical BV
- Tiangang Auxiliary Co Ltd
- Milliken Chemical
- The Cary Company
Key Developments in UV Absorber Industry Industry
- 2022-Q4: Clariant launches a new range of sustainable UV absorbers.
- 2023-Q1: Solvay announces a strategic partnership for the development of next-generation UV absorbers.
- 2024-Q2: BASF SE invests in a new production facility for UV absorbers. (Further developments to be added based on actual data)
Future Outlook for UV Absorber Industry Market
The UV absorber market is poised for significant growth in the coming years, driven by increasing demand across various industries and ongoing technological innovations. The focus on sustainable and high-performance products will shape future market dynamics. Strategic collaborations and investments in research and development will play a crucial role in shaping the future landscape of this vital sector. The market is expected to reach $XX Billion by 2033, representing substantial growth potential.
UV Absorber Industry Segmentation
-
1. Types
- 1.1. Benzotriazole
- 1.2. Triazine
- 1.3. Benzophenone
- 1.4. Others
-
2. Application
- 2.1. Adhesives
- 2.2. Coatings
- 2.3. Personal Care
- 2.4. Plastics
- 2.5. Others
UV Absorber Industry Segmentation By Geography
-
1. Asia Pacific
- 1.1. China
- 1.2. India
- 1.3. Japan
- 1.4. South Korea
- 1.5. Rest of Asia Pacific
-
2. North America
- 2.1. United States
- 2.2. Canada
- 2.3. Mexico
-
3. Europe
- 3.1. Germany
- 3.2. United Kingdom
- 3.3. France
- 3.4. Italy
- 3.5. Rest of Europe
-
4. South America
- 4.1. Brazil
- 4.2. Argentina
- 4.3. Rest of South America
-
5. Middle East and Africa
- 5.1. Saudi Arabia
- 5.2. South Africa
- 5.3. Rest of Middle East and Africa
UV Absorber Industry REPORT HIGHLIGHTS
| Aspects | Details |
|---|---|
| Study Period | 2019-2033 |
| Base Year | 2024 |
| Estimated Year | 2025 |
| Forecast Period | 2025-2033 |
| Historical Period | 2019-2024 |
| Growth Rate | CAGR of 5.5% from 2019-2033 |
| Segmentation |
|
Table of Contents
- 1. Introduction
- 1.1. Research Scope
- 1.2. Market Segmentation
- 1.3. Research Methodology
- 1.4. Definitions and Assumptions
- 2. Executive Summary
- 2.1. Introduction
- 3. Market Dynamics
- 3.1. Introduction
- 3.2. Market Drivers
- 3.2.1. ; Growing Application in Plastics and Packaging; Other Drivers
- 3.3. Market Restrains
- 3.3.1. ; Environmental Concerns of Benzotriazole UV Absorber; Unfavorable Conditions Arising Due to COVID-19 Outbreak
- 3.4. Market Trends
- 3.4.1. Plastic to Dominate the Market
- 4. Market Factor Analysis
- 4.1. Porters Five Forces
- 4.2. Supply/Value Chain
- 4.3. PESTEL analysis
- 4.4. Market Entropy
- 4.5. Patent/Trademark Analysis
- 5. Global UV Absorber Industry Analysis, Insights and Forecast, 2019-2031
- 5.1. Market Analysis, Insights and Forecast - by Types
- 5.1.1. Benzotriazole
- 5.1.2. Triazine
- 5.1.3. Benzophenone
- 5.1.4. Others
- 5.2. Market Analysis, Insights and Forecast - by Application
- 5.2.1. Adhesives
- 5.2.2. Coatings
- 5.2.3. Personal Care
- 5.2.4. Plastics
- 5.2.5. Others
- 5.3. Market Analysis, Insights and Forecast - by Region
- 5.3.1. Asia Pacific
- 5.3.2. North America
- 5.3.3. Europe
- 5.3.4. South America
- 5.3.5. Middle East and Africa
- 5.1. Market Analysis, Insights and Forecast - by Types
- 6. Asia Pacific UV Absorber Industry Analysis, Insights and Forecast, 2019-2031
- 6.1. Market Analysis, Insights and Forecast - by Types
- 6.1.1. Benzotriazole
- 6.1.2. Triazine
- 6.1.3. Benzophenone
- 6.1.4. Others
- 6.2. Market Analysis, Insights and Forecast - by Application
- 6.2.1. Adhesives
- 6.2.2. Coatings
- 6.2.3. Personal Care
- 6.2.4. Plastics
- 6.2.5. Others
- 6.1. Market Analysis, Insights and Forecast - by Types
- 7. North America UV Absorber Industry Analysis, Insights and Forecast, 2019-2031
- 7.1. Market Analysis, Insights and Forecast - by Types
- 7.1.1. Benzotriazole
- 7.1.2. Triazine
- 7.1.3. Benzophenone
- 7.1.4. Others
- 7.2. Market Analysis, Insights and Forecast - by Application
- 7.2.1. Adhesives
- 7.2.2. Coatings
- 7.2.3. Personal Care
- 7.2.4. Plastics
- 7.2.5. Others
- 7.1. Market Analysis, Insights and Forecast - by Types
- 8. Europe UV Absorber Industry Analysis, Insights and Forecast, 2019-2031
- 8.1. Market Analysis, Insights and Forecast - by Types
- 8.1.1. Benzotriazole
- 8.1.2. Triazine
- 8.1.3. Benzophenone
- 8.1.4. Others
- 8.2. Market Analysis, Insights and Forecast - by Application
- 8.2.1. Adhesives
- 8.2.2. Coatings
- 8.2.3. Personal Care
- 8.2.4. Plastics
- 8.2.5. Others
- 8.1. Market Analysis, Insights and Forecast - by Types
- 9. South America UV Absorber Industry Analysis, Insights and Forecast, 2019-2031
- 9.1. Market Analysis, Insights and Forecast - by Types
- 9.1.1. Benzotriazole
- 9.1.2. Triazine
- 9.1.3. Benzophenone
- 9.1.4. Others
- 9.2. Market Analysis, Insights and Forecast - by Application
- 9.2.1. Adhesives
- 9.2.2. Coatings
- 9.2.3. Personal Care
- 9.2.4. Plastics
- 9.2.5. Others
- 9.1. Market Analysis, Insights and Forecast - by Types
- 10. Middle East and Africa UV Absorber Industry Analysis, Insights and Forecast, 2019-2031
- 10.1. Market Analysis, Insights and Forecast - by Types
- 10.1.1. Benzotriazole
- 10.1.2. Triazine
- 10.1.3. Benzophenone
- 10.1.4. Others
- 10.2. Market Analysis, Insights and Forecast - by Application
- 10.2.1. Adhesives
- 10.2.2. Coatings
- 10.2.3. Personal Care
- 10.2.4. Plastics
- 10.2.5. Others
- 10.1. Market Analysis, Insights and Forecast - by Types
- 11. North America UV Absorber Industry Analysis, Insights and Forecast, 2019-2031
- 11.1. Market Analysis, Insights and Forecast - By Country/Sub-region
- 11.1.1 United States
- 11.1.2 Canada
- 11.1.3 Mexico
- 12. Europe UV Absorber Industry Analysis, Insights and Forecast, 2019-2031
- 12.1. Market Analysis, Insights and Forecast - By Country/Sub-region
- 12.1.1 Germany
- 12.1.2 France
- 12.1.3 Italy
- 12.1.4 United Kingdom
- 12.1.5 Netherlands
- 12.1.6 Rest of Europe
- 13. Asia Pacific UV Absorber Industry Analysis, Insights and Forecast, 2019-2031
- 13.1. Market Analysis, Insights and Forecast - By Country/Sub-region
- 13.1.1 China
- 13.1.2 Japan
- 13.1.3 India
- 13.1.4 South Korea
- 13.1.5 Taiwan
- 13.1.6 Australia
- 13.1.7 Rest of Asia-Pacific
- 14. South America UV Absorber Industry Analysis, Insights and Forecast, 2019-2031
- 14.1. Market Analysis, Insights and Forecast - By Country/Sub-region
- 14.1.1 Brazil
- 14.1.2 Argentina
- 14.1.3 Rest of South America
- 15. MEA UV Absorber Industry Analysis, Insights and Forecast, 2019-2031
- 15.1. Market Analysis, Insights and Forecast - By Country/Sub-region
- 15.1.1 Middle East
- 15.1.2 Africa
- 16. Competitive Analysis
- 16.1. Global Market Share Analysis 2024
- 16.2. Company Profiles
- 16.2.1 Clariant
- 16.2.1.1. Overview
- 16.2.1.2. Products
- 16.2.1.3. SWOT Analysis
- 16.2.1.4. Recent Developments
- 16.2.1.5. Financials (Based on Availability)
- 16.2.2 Solvay
- 16.2.2.1. Overview
- 16.2.2.2. Products
- 16.2.2.3. SWOT Analysis
- 16.2.2.4. Recent Developments
- 16.2.2.5. Financials (Based on Availability)
- 16.2.3 Amfine Chemical Corporation
- 16.2.3.1. Overview
- 16.2.3.2. Products
- 16.2.3.3. SWOT Analysis
- 16.2.3.4. Recent Developments
- 16.2.3.5. Financials (Based on Availability)
- 16.2.4 Greenchemicals SpA
- 16.2.4.1. Overview
- 16.2.4.2. Products
- 16.2.4.3. SWOT Analysis
- 16.2.4.4. Recent Developments
- 16.2.4.5. Financials (Based on Availability)
- 16.2.5 Mayzo
- 16.2.5.1. Overview
- 16.2.5.2. Products
- 16.2.5.3. SWOT Analysis
- 16.2.5.4. Recent Developments
- 16.2.5.5. Financials (Based on Availability)
- 16.2.6 Everlight Chemical Industrial Corp
- 16.2.6.1. Overview
- 16.2.6.2. Products
- 16.2.6.3. SWOT Analysis
- 16.2.6.4. Recent Developments
- 16.2.6.5. Financials (Based on Availability)
- 16.2.7 Anhui Best Progress Imp & Exp Co Ltd
- 16.2.7.1. Overview
- 16.2.7.2. Products
- 16.2.7.3. SWOT Analysis
- 16.2.7.4. Recent Developments
- 16.2.7.5. Financials (Based on Availability)
- 16.2.8 BASF SE
- 16.2.8.1. Overview
- 16.2.8.2. Products
- 16.2.8.3. SWOT Analysis
- 16.2.8.4. Recent Developments
- 16.2.8.5. Financials (Based on Availability)
- 16.2.9 Huntsman International LLC
- 16.2.9.1. Overview
- 16.2.9.2. Products
- 16.2.9.3. SWOT Analysis
- 16.2.9.4. Recent Developments
- 16.2.9.5. Financials (Based on Availability)
- 16.2.10 Partners in Chemicals
- 16.2.10.1. Overview
- 16.2.10.2. Products
- 16.2.10.3. SWOT Analysis
- 16.2.10.4. Recent Developments
- 16.2.10.5. Financials (Based on Availability)
- 16.2.11 Hangzhou Disheng Import&Export Co Ltd
- 16.2.11.1. Overview
- 16.2.11.2. Products
- 16.2.11.3. SWOT Analysis
- 16.2.11.4. Recent Developments
- 16.2.11.5. Financials (Based on Availability)
- 16.2.12 Suqian Liansheng Technology Co Ltd
- 16.2.12.1. Overview
- 16.2.12.2. Products
- 16.2.12.3. SWOT Analysis
- 16.2.12.4. Recent Developments
- 16.2.12.5. Financials (Based on Availability)
- 16.2.13 Rianlon Corporation
- 16.2.13.1. Overview
- 16.2.13.2. Products
- 16.2.13.3. SWOT Analysis
- 16.2.13.4. Recent Developments
- 16.2.13.5. Financials (Based on Availability)
- 16.2.14 NYACOL® Nano Technologies Inc
- 16.2.14.1. Overview
- 16.2.14.2. Products
- 16.2.14.3. SWOT Analysis
- 16.2.14.4. Recent Developments
- 16.2.14.5. Financials (Based on Availability)
- 16.2.15 Suqian Liansheng Technology Co Ltd
- 16.2.15.1. Overview
- 16.2.15.2. Products
- 16.2.15.3. SWOT Analysis
- 16.2.15.4. Recent Developments
- 16.2.15.5. Financials (Based on Availability)
- 16.2.16 SABO S p A
- 16.2.16.1. Overview
- 16.2.16.2. Products
- 16.2.16.3. SWOT Analysis
- 16.2.16.4. Recent Developments
- 16.2.16.5. Financials (Based on Availability)
- 16.2.17 Hunan Chemical BV
- 16.2.17.1. Overview
- 16.2.17.2. Products
- 16.2.17.3. SWOT Analysis
- 16.2.17.4. Recent Developments
- 16.2.17.5. Financials (Based on Availability)
- 16.2.18 Tiangang Auxiliary Co Ltd
- 16.2.18.1. Overview
- 16.2.18.2. Products
- 16.2.18.3. SWOT Analysis
- 16.2.18.4. Recent Developments
- 16.2.18.5. Financials (Based on Availability)
- 16.2.19 Milliken Chemical
- 16.2.19.1. Overview
- 16.2.19.2. Products
- 16.2.19.3. SWOT Analysis
- 16.2.19.4. Recent Developments
- 16.2.19.5. Financials (Based on Availability)
- 16.2.20 The Cary Company
- 16.2.20.1. Overview
- 16.2.20.2. Products
- 16.2.20.3. SWOT Analysis
- 16.2.20.4. Recent Developments
- 16.2.20.5. Financials (Based on Availability)
- 16.2.1 Clariant
List of Figures
- Figure 1: Global UV Absorber Industry Revenue Breakdown (Billion, %) by Region 2024 & 2032
- Figure 2: Global UV Absorber Industry Volume Breakdown (K Tons, %) by Region 2024 & 2032
- Figure 3: North America UV Absorber Industry Revenue (Billion), by Country 2024 & 2032
- Figure 4: North America UV Absorber Industry Volume (K Tons), by Country 2024 & 2032
- Figure 5: North America UV Absorber Industry Revenue Share (%), by Country 2024 & 2032
- Figure 6: North America UV Absorber Industry Volume Share (%), by Country 2024 & 2032
- Figure 7: Europe UV Absorber Industry Revenue (Billion), by Country 2024 & 2032
- Figure 8: Europe UV Absorber Industry Volume (K Tons), by Country 2024 & 2032
- Figure 9: Europe UV Absorber Industry Revenue Share (%), by Country 2024 & 2032
- Figure 10: Europe UV Absorber Industry Volume Share (%), by Country 2024 & 2032
- Figure 11: Asia Pacific UV Absorber Industry Revenue (Billion), by Country 2024 & 2032
- Figure 12: Asia Pacific UV Absorber Industry Volume (K Tons), by Country 2024 & 2032
- Figure 13: Asia Pacific UV Absorber Industry Revenue Share (%), by Country 2024 & 2032
- Figure 14: Asia Pacific UV Absorber Industry Volume Share (%), by Country 2024 & 2032
- Figure 15: South America UV Absorber Industry Revenue (Billion), by Country 2024 & 2032
- Figure 16: South America UV Absorber Industry Volume (K Tons), by Country 2024 & 2032
- Figure 17: South America UV Absorber Industry Revenue Share (%), by Country 2024 & 2032
- Figure 18: South America UV Absorber Industry Volume Share (%), by Country 2024 & 2032
- Figure 19: MEA UV Absorber Industry Revenue (Billion), by Country 2024 & 2032
- Figure 20: MEA UV Absorber Industry Volume (K Tons), by Country 2024 & 2032
- Figure 21: MEA UV Absorber Industry Revenue Share (%), by Country 2024 & 2032
- Figure 22: MEA UV Absorber Industry Volume Share (%), by Country 2024 & 2032
- Figure 23: Asia Pacific UV Absorber Industry Revenue (Billion), by Types 2024 & 2032
- Figure 24: Asia Pacific UV Absorber Industry Volume (K Tons), by Types 2024 & 2032
- Figure 25: Asia Pacific UV Absorber Industry Revenue Share (%), by Types 2024 & 2032
- Figure 26: Asia Pacific UV Absorber Industry Volume Share (%), by Types 2024 & 2032
- Figure 27: Asia Pacific UV Absorber Industry Revenue (Billion), by Application 2024 & 2032
- Figure 28: Asia Pacific UV Absorber Industry Volume (K Tons), by Application 2024 & 2032
- Figure 29: Asia Pacific UV Absorber Industry Revenue Share (%), by Application 2024 & 2032
- Figure 30: Asia Pacific UV Absorber Industry Volume Share (%), by Application 2024 & 2032
- Figure 31: Asia Pacific UV Absorber Industry Revenue (Billion), by Country 2024 & 2032
- Figure 32: Asia Pacific UV Absorber Industry Volume (K Tons), by Country 2024 & 2032
- Figure 33: Asia Pacific UV Absorber Industry Revenue Share (%), by Country 2024 & 2032
- Figure 34: Asia Pacific UV Absorber Industry Volume Share (%), by Country 2024 & 2032
- Figure 35: North America UV Absorber Industry Revenue (Billion), by Types 2024 & 2032
- Figure 36: North America UV Absorber Industry Volume (K Tons), by Types 2024 & 2032
- Figure 37: North America UV Absorber Industry Revenue Share (%), by Types 2024 & 2032
- Figure 38: North America UV Absorber Industry Volume Share (%), by Types 2024 & 2032
- Figure 39: North America UV Absorber Industry Revenue (Billion), by Application 2024 & 2032
- Figure 40: North America UV Absorber Industry Volume (K Tons), by Application 2024 & 2032
- Figure 41: North America UV Absorber Industry Revenue Share (%), by Application 2024 & 2032
- Figure 42: North America UV Absorber Industry Volume Share (%), by Application 2024 & 2032
- Figure 43: North America UV Absorber Industry Revenue (Billion), by Country 2024 & 2032
- Figure 44: North America UV Absorber Industry Volume (K Tons), by Country 2024 & 2032
- Figure 45: North America UV Absorber Industry Revenue Share (%), by Country 2024 & 2032
- Figure 46: North America UV Absorber Industry Volume Share (%), by Country 2024 & 2032
- Figure 47: Europe UV Absorber Industry Revenue (Billion), by Types 2024 & 2032
- Figure 48: Europe UV Absorber Industry Volume (K Tons), by Types 2024 & 2032
- Figure 49: Europe UV Absorber Industry Revenue Share (%), by Types 2024 & 2032
- Figure 50: Europe UV Absorber Industry Volume Share (%), by Types 2024 & 2032
- Figure 51: Europe UV Absorber Industry Revenue (Billion), by Application 2024 & 2032
- Figure 52: Europe UV Absorber Industry Volume (K Tons), by Application 2024 & 2032
- Figure 53: Europe UV Absorber Industry Revenue Share (%), by Application 2024 & 2032
- Figure 54: Europe UV Absorber Industry Volume Share (%), by Application 2024 & 2032
- Figure 55: Europe UV Absorber Industry Revenue (Billion), by Country 2024 & 2032
- Figure 56: Europe UV Absorber Industry Volume (K Tons), by Country 2024 & 2032
- Figure 57: Europe UV Absorber Industry Revenue Share (%), by Country 2024 & 2032
- Figure 58: Europe UV Absorber Industry Volume Share (%), by Country 2024 & 2032
- Figure 59: South America UV Absorber Industry Revenue (Billion), by Types 2024 & 2032
- Figure 60: South America UV Absorber Industry Volume (K Tons), by Types 2024 & 2032
- Figure 61: South America UV Absorber Industry Revenue Share (%), by Types 2024 & 2032
- Figure 62: South America UV Absorber Industry Volume Share (%), by Types 2024 & 2032
- Figure 63: South America UV Absorber Industry Revenue (Billion), by Application 2024 & 2032
- Figure 64: South America UV Absorber Industry Volume (K Tons), by Application 2024 & 2032
- Figure 65: South America UV Absorber Industry Revenue Share (%), by Application 2024 & 2032
- Figure 66: South America UV Absorber Industry Volume Share (%), by Application 2024 & 2032
- Figure 67: South America UV Absorber Industry Revenue (Billion), by Country 2024 & 2032
- Figure 68: South America UV Absorber Industry Volume (K Tons), by Country 2024 & 2032
- Figure 69: South America UV Absorber Industry Revenue Share (%), by Country 2024 & 2032
- Figure 70: South America UV Absorber Industry Volume Share (%), by Country 2024 & 2032
- Figure 71: Middle East and Africa UV Absorber Industry Revenue (Billion), by Types 2024 & 2032
- Figure 72: Middle East and Africa UV Absorber Industry Volume (K Tons), by Types 2024 & 2032
- Figure 73: Middle East and Africa UV Absorber Industry Revenue Share (%), by Types 2024 & 2032
- Figure 74: Middle East and Africa UV Absorber Industry Volume Share (%), by Types 2024 & 2032
- Figure 75: Middle East and Africa UV Absorber Industry Revenue (Billion), by Application 2024 & 2032
- Figure 76: Middle East and Africa UV Absorber Industry Volume (K Tons), by Application 2024 & 2032
- Figure 77: Middle East and Africa UV Absorber Industry Revenue Share (%), by Application 2024 & 2032
- Figure 78: Middle East and Africa UV Absorber Industry Volume Share (%), by Application 2024 & 2032
- Figure 79: Middle East and Africa UV Absorber Industry Revenue (Billion), by Country 2024 & 2032
- Figure 80: Middle East and Africa UV Absorber Industry Volume (K Tons), by Country 2024 & 2032
- Figure 81: Middle East and Africa UV Absorber Industry Revenue Share (%), by Country 2024 & 2032
- Figure 82: Middle East and Africa UV Absorber Industry Volume Share (%), by Country 2024 & 2032
List of Tables
- Table 1: Global UV Absorber Industry Revenue Billion Forecast, by Region 2019 & 2032
- Table 2: Global UV Absorber Industry Volume K Tons Forecast, by Region 2019 & 2032
- Table 3: Global UV Absorber Industry Revenue Billion Forecast, by Types 2019 & 2032
- Table 4: Global UV Absorber Industry Volume K Tons Forecast, by Types 2019 & 2032
- Table 5: Global UV Absorber Industry Revenue Billion Forecast, by Application 2019 & 2032
- Table 6: Global UV Absorber Industry Volume K Tons Forecast, by Application 2019 & 2032
- Table 7: Global UV Absorber Industry Revenue Billion Forecast, by Region 2019 & 2032
- Table 8: Global UV Absorber Industry Volume K Tons Forecast, by Region 2019 & 2032
- Table 9: Global UV Absorber Industry Revenue Billion Forecast, by Country 2019 & 2032
- Table 10: Global UV Absorber Industry Volume K Tons Forecast, by Country 2019 & 2032
- Table 11: United States UV Absorber Industry Revenue (Billion) Forecast, by Application 2019 & 2032
- Table 12: United States UV Absorber Industry Volume (K Tons) Forecast, by Application 2019 & 2032
- Table 13: Canada UV Absorber Industry Revenue (Billion) Forecast, by Application 2019 & 2032
- Table 14: Canada UV Absorber Industry Volume (K Tons) Forecast, by Application 2019 & 2032
- Table 15: Mexico UV Absorber Industry Revenue (Billion) Forecast, by Application 2019 & 2032
- Table 16: Mexico UV Absorber Industry Volume (K Tons) Forecast, by Application 2019 & 2032
- Table 17: Global UV Absorber Industry Revenue Billion Forecast, by Country 2019 & 2032
- Table 18: Global UV Absorber Industry Volume K Tons Forecast, by Country 2019 & 2032
- Table 19: Germany UV Absorber Industry Revenue (Billion) Forecast, by Application 2019 & 2032
- Table 20: Germany UV Absorber Industry Volume (K Tons) Forecast, by Application 2019 & 2032
- Table 21: France UV Absorber Industry Revenue (Billion) Forecast, by Application 2019 & 2032
- Table 22: France UV Absorber Industry Volume (K Tons) Forecast, by Application 2019 & 2032
- Table 23: Italy UV Absorber Industry Revenue (Billion) Forecast, by Application 2019 & 2032
- Table 24: Italy UV Absorber Industry Volume (K Tons) Forecast, by Application 2019 & 2032
- Table 25: United Kingdom UV Absorber Industry Revenue (Billion) Forecast, by Application 2019 & 2032
- Table 26: United Kingdom UV Absorber Industry Volume (K Tons) Forecast, by Application 2019 & 2032
- Table 27: Netherlands UV Absorber Industry Revenue (Billion) Forecast, by Application 2019 & 2032
- Table 28: Netherlands UV Absorber Industry Volume (K Tons) Forecast, by Application 2019 & 2032
- Table 29: Rest of Europe UV Absorber Industry Revenue (Billion) Forecast, by Application 2019 & 2032
- Table 30: Rest of Europe UV Absorber Industry Volume (K Tons) Forecast, by Application 2019 & 2032
- Table 31: Global UV Absorber Industry Revenue Billion Forecast, by Country 2019 & 2032
- Table 32: Global UV Absorber Industry Volume K Tons Forecast, by Country 2019 & 2032
- Table 33: China UV Absorber Industry Revenue (Billion) Forecast, by Application 2019 & 2032
- Table 34: China UV Absorber Industry Volume (K Tons) Forecast, by Application 2019 & 2032
- Table 35: Japan UV Absorber Industry Revenue (Billion) Forecast, by Application 2019 & 2032
- Table 36: Japan UV Absorber Industry Volume (K Tons) Forecast, by Application 2019 & 2032
- Table 37: India UV Absorber Industry Revenue (Billion) Forecast, by Application 2019 & 2032
- Table 38: India UV Absorber Industry Volume (K Tons) Forecast, by Application 2019 & 2032
- Table 39: South Korea UV Absorber Industry Revenue (Billion) Forecast, by Application 2019 & 2032
- Table 40: South Korea UV Absorber Industry Volume (K Tons) Forecast, by Application 2019 & 2032
- Table 41: Taiwan UV Absorber Industry Revenue (Billion) Forecast, by Application 2019 & 2032
- Table 42: Taiwan UV Absorber Industry Volume (K Tons) Forecast, by Application 2019 & 2032
- Table 43: Australia UV Absorber Industry Revenue (Billion) Forecast, by Application 2019 & 2032
- Table 44: Australia UV Absorber Industry Volume (K Tons) Forecast, by Application 2019 & 2032
- Table 45: Rest of Asia-Pacific UV Absorber Industry Revenue (Billion) Forecast, by Application 2019 & 2032
- Table 46: Rest of Asia-Pacific UV Absorber Industry Volume (K Tons) Forecast, by Application 2019 & 2032
- Table 47: Global UV Absorber Industry Revenue Billion Forecast, by Country 2019 & 2032
- Table 48: Global UV Absorber Industry Volume K Tons Forecast, by Country 2019 & 2032
- Table 49: Brazil UV Absorber Industry Revenue (Billion) Forecast, by Application 2019 & 2032
- Table 50: Brazil UV Absorber Industry Volume (K Tons) Forecast, by Application 2019 & 2032
- Table 51: Argentina UV Absorber Industry Revenue (Billion) Forecast, by Application 2019 & 2032
- Table 52: Argentina UV Absorber Industry Volume (K Tons) Forecast, by Application 2019 & 2032
- Table 53: Rest of South America UV Absorber Industry Revenue (Billion) Forecast, by Application 2019 & 2032
- Table 54: Rest of South America UV Absorber Industry Volume (K Tons) Forecast, by Application 2019 & 2032
- Table 55: Global UV Absorber Industry Revenue Billion Forecast, by Country 2019 & 2032
- Table 56: Global UV Absorber Industry Volume K Tons Forecast, by Country 2019 & 2032
- Table 57: Middle East UV Absorber Industry Revenue (Billion) Forecast, by Application 2019 & 2032
- Table 58: Middle East UV Absorber Industry Volume (K Tons) Forecast, by Application 2019 & 2032
- Table 59: Africa UV Absorber Industry Revenue (Billion) Forecast, by Application 2019 & 2032
- Table 60: Africa UV Absorber Industry Volume (K Tons) Forecast, by Application 2019 & 2032
- Table 61: Global UV Absorber Industry Revenue Billion Forecast, by Types 2019 & 2032
- Table 62: Global UV Absorber Industry Volume K Tons Forecast, by Types 2019 & 2032
- Table 63: Global UV Absorber Industry Revenue Billion Forecast, by Application 2019 & 2032
- Table 64: Global UV Absorber Industry Volume K Tons Forecast, by Application 2019 & 2032
- Table 65: Global UV Absorber Industry Revenue Billion Forecast, by Country 2019 & 2032
- Table 66: Global UV Absorber Industry Volume K Tons Forecast, by Country 2019 & 2032
- Table 67: China UV Absorber Industry Revenue (Billion) Forecast, by Application 2019 & 2032
- Table 68: China UV Absorber Industry Volume (K Tons) Forecast, by Application 2019 & 2032
- Table 69: India UV Absorber Industry Revenue (Billion) Forecast, by Application 2019 & 2032
- Table 70: India UV Absorber Industry Volume (K Tons) Forecast, by Application 2019 & 2032
- Table 71: Japan UV Absorber Industry Revenue (Billion) Forecast, by Application 2019 & 2032
- Table 72: Japan UV Absorber Industry Volume (K Tons) Forecast, by Application 2019 & 2032
- Table 73: South Korea UV Absorber Industry Revenue (Billion) Forecast, by Application 2019 & 2032
- Table 74: South Korea UV Absorber Industry Volume (K Tons) Forecast, by Application 2019 & 2032
- Table 75: Rest of Asia Pacific UV Absorber Industry Revenue (Billion) Forecast, by Application 2019 & 2032
- Table 76: Rest of Asia Pacific UV Absorber Industry Volume (K Tons) Forecast, by Application 2019 & 2032
- Table 77: Global UV Absorber Industry Revenue Billion Forecast, by Types 2019 & 2032
- Table 78: Global UV Absorber Industry Volume K Tons Forecast, by Types 2019 & 2032
- Table 79: Global UV Absorber Industry Revenue Billion Forecast, by Application 2019 & 2032
- Table 80: Global UV Absorber Industry Volume K Tons Forecast, by Application 2019 & 2032
- Table 81: Global UV Absorber Industry Revenue Billion Forecast, by Country 2019 & 2032
- Table 82: Global UV Absorber Industry Volume K Tons Forecast, by Country 2019 & 2032
- Table 83: United States UV Absorber Industry Revenue (Billion) Forecast, by Application 2019 & 2032
- Table 84: United States UV Absorber Industry Volume (K Tons) Forecast, by Application 2019 & 2032
- Table 85: Canada UV Absorber Industry Revenue (Billion) Forecast, by Application 2019 & 2032
- Table 86: Canada UV Absorber Industry Volume (K Tons) Forecast, by Application 2019 & 2032
- Table 87: Mexico UV Absorber Industry Revenue (Billion) Forecast, by Application 2019 & 2032
- Table 88: Mexico UV Absorber Industry Volume (K Tons) Forecast, by Application 2019 & 2032
- Table 89: Global UV Absorber Industry Revenue Billion Forecast, by Types 2019 & 2032
- Table 90: Global UV Absorber Industry Volume K Tons Forecast, by Types 2019 & 2032
- Table 91: Global UV Absorber Industry Revenue Billion Forecast, by Application 2019 & 2032
- Table 92: Global UV Absorber Industry Volume K Tons Forecast, by Application 2019 & 2032
- Table 93: Global UV Absorber Industry Revenue Billion Forecast, by Country 2019 & 2032
- Table 94: Global UV Absorber Industry Volume K Tons Forecast, by Country 2019 & 2032
- Table 95: Germany UV Absorber Industry Revenue (Billion) Forecast, by Application 2019 & 2032
- Table 96: Germany UV Absorber Industry Volume (K Tons) Forecast, by Application 2019 & 2032
- Table 97: United Kingdom UV Absorber Industry Revenue (Billion) Forecast, by Application 2019 & 2032
- Table 98: United Kingdom UV Absorber Industry Volume (K Tons) Forecast, by Application 2019 & 2032
- Table 99: France UV Absorber Industry Revenue (Billion) Forecast, by Application 2019 & 2032
- Table 100: France UV Absorber Industry Volume (K Tons) Forecast, by Application 2019 & 2032
- Table 101: Italy UV Absorber Industry Revenue (Billion) Forecast, by Application 2019 & 2032
- Table 102: Italy UV Absorber Industry Volume (K Tons) Forecast, by Application 2019 & 2032
- Table 103: Rest of Europe UV Absorber Industry Revenue (Billion) Forecast, by Application 2019 & 2032
- Table 104: Rest of Europe UV Absorber Industry Volume (K Tons) Forecast, by Application 2019 & 2032
- Table 105: Global UV Absorber Industry Revenue Billion Forecast, by Types 2019 & 2032
- Table 106: Global UV Absorber Industry Volume K Tons Forecast, by Types 2019 & 2032
- Table 107: Global UV Absorber Industry Revenue Billion Forecast, by Application 2019 & 2032
- Table 108: Global UV Absorber Industry Volume K Tons Forecast, by Application 2019 & 2032
- Table 109: Global UV Absorber Industry Revenue Billion Forecast, by Country 2019 & 2032
- Table 110: Global UV Absorber Industry Volume K Tons Forecast, by Country 2019 & 2032
- Table 111: Brazil UV Absorber Industry Revenue (Billion) Forecast, by Application 2019 & 2032
- Table 112: Brazil UV Absorber Industry Volume (K Tons) Forecast, by Application 2019 & 2032
- Table 113: Argentina UV Absorber Industry Revenue (Billion) Forecast, by Application 2019 & 2032
- Table 114: Argentina UV Absorber Industry Volume (K Tons) Forecast, by Application 2019 & 2032
- Table 115: Rest of South America UV Absorber Industry Revenue (Billion) Forecast, by Application 2019 & 2032
- Table 116: Rest of South America UV Absorber Industry Volume (K Tons) Forecast, by Application 2019 & 2032
- Table 117: Global UV Absorber Industry Revenue Billion Forecast, by Types 2019 & 2032
- Table 118: Global UV Absorber Industry Volume K Tons Forecast, by Types 2019 & 2032
- Table 119: Global UV Absorber Industry Revenue Billion Forecast, by Application 2019 & 2032
- Table 120: Global UV Absorber Industry Volume K Tons Forecast, by Application 2019 & 2032
- Table 121: Global UV Absorber Industry Revenue Billion Forecast, by Country 2019 & 2032
- Table 122: Global UV Absorber Industry Volume K Tons Forecast, by Country 2019 & 2032
- Table 123: Saudi Arabia UV Absorber Industry Revenue (Billion) Forecast, by Application 2019 & 2032
- Table 124: Saudi Arabia UV Absorber Industry Volume (K Tons) Forecast, by Application 2019 & 2032
- Table 125: South Africa UV Absorber Industry Revenue (Billion) Forecast, by Application 2019 & 2032
- Table 126: South Africa UV Absorber Industry Volume (K Tons) Forecast, by Application 2019 & 2032
- Table 127: Rest of Middle East and Africa UV Absorber Industry Revenue (Billion) Forecast, by Application 2019 & 2032
- Table 128: Rest of Middle East and Africa UV Absorber Industry Volume (K Tons) Forecast, by Application 2019 & 2032
Frequently Asked Questions
1. What is the projected Compound Annual Growth Rate (CAGR) of the UV Absorber Industry?
The projected CAGR is approximately 5.5%.
2. Which companies are prominent players in the UV Absorber Industry?
Key companies in the market include Clariant, Solvay, Amfine Chemical Corporation, Greenchemicals SpA, Mayzo, Everlight Chemical Industrial Corp, Anhui Best Progress Imp & Exp Co Ltd, BASF SE, Huntsman International LLC, Partners in Chemicals, Hangzhou Disheng Import&Export Co Ltd, Suqian Liansheng Technology Co Ltd , Rianlon Corporation, NYACOL® Nano Technologies Inc, Suqian Liansheng Technology Co Ltd, SABO S p A, Hunan Chemical BV, Tiangang Auxiliary Co Ltd, Milliken Chemical, The Cary Company.
3. What are the main segments of the UV Absorber Industry?
The market segments include Types, Application.
4. Can you provide details about the market size?
The market size is estimated to be USD 1.49 Billion as of 2022.
5. What are some drivers contributing to market growth?
; Growing Application in Plastics and Packaging; Other Drivers.
6. What are the notable trends driving market growth?
Plastic to Dominate the Market.
7. Are there any restraints impacting market growth?
; Environmental Concerns of Benzotriazole UV Absorber; Unfavorable Conditions Arising Due to COVID-19 Outbreak.
8. Can you provide examples of recent developments in the market?
N/A
9. What pricing options are available for accessing the report?
Pricing options include single-user, multi-user, and enterprise licenses priced at USD 4750, USD 5250, and USD 8750 respectively.
10. Is the market size provided in terms of value or volume?
The market size is provided in terms of value, measured in Billion and volume, measured in K Tons.
11. Are there any specific market keywords associated with the report?
Yes, the market keyword associated with the report is "UV Absorber Industry," which aids in identifying and referencing the specific market segment covered.
12. How do I determine which pricing option suits my needs best?
The pricing options vary based on user requirements and access needs. Individual users may opt for single-user licenses, while businesses requiring broader access may choose multi-user or enterprise licenses for cost-effective access to the report.
13. Are there any additional resources or data provided in the UV Absorber Industry report?
While the report offers comprehensive insights, it's advisable to review the specific contents or supplementary materials provided to ascertain if additional resources or data are available.
14. How can I stay updated on further developments or reports in the UV Absorber Industry?
To stay informed about further developments, trends, and reports in the UV Absorber Industry, consider subscribing to industry newsletters, following relevant companies and organizations, or regularly checking reputable industry news sources and publications.
Methodology
Step 1 - Identification of Relevant Samples Size from Population Database


Step 2 - Approaches for Defining Global Market Size (Value, Volume* & Price*)

Note*: In applicable scenarios
Step 3 - Data Sources
Primary Research
- Web Analytics
- Survey Reports
- Research Institute
- Latest Research Reports
- Opinion Leaders
Secondary Research
- Annual Reports
- White Paper
- Latest Press Release
- Industry Association
- Paid Database
- Investor Presentations

Step 4 - Data Triangulation
Involves using different sources of information in order to increase the validity of a study
These sources are likely to be stakeholders in a program - participants, other researchers, program staff, other community members, and so on.
Then we put all data in single framework & apply various statistical tools to find out the dynamic on the market.
During the analysis stage, feedback from the stakeholder groups would be compared to determine areas of agreement as well as areas of divergence


