
Key Insights
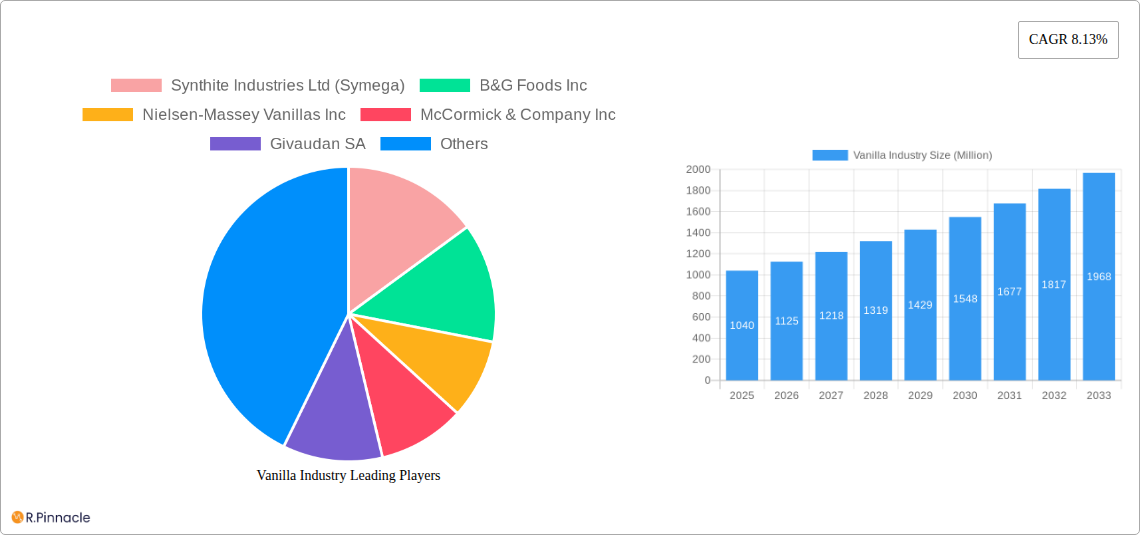
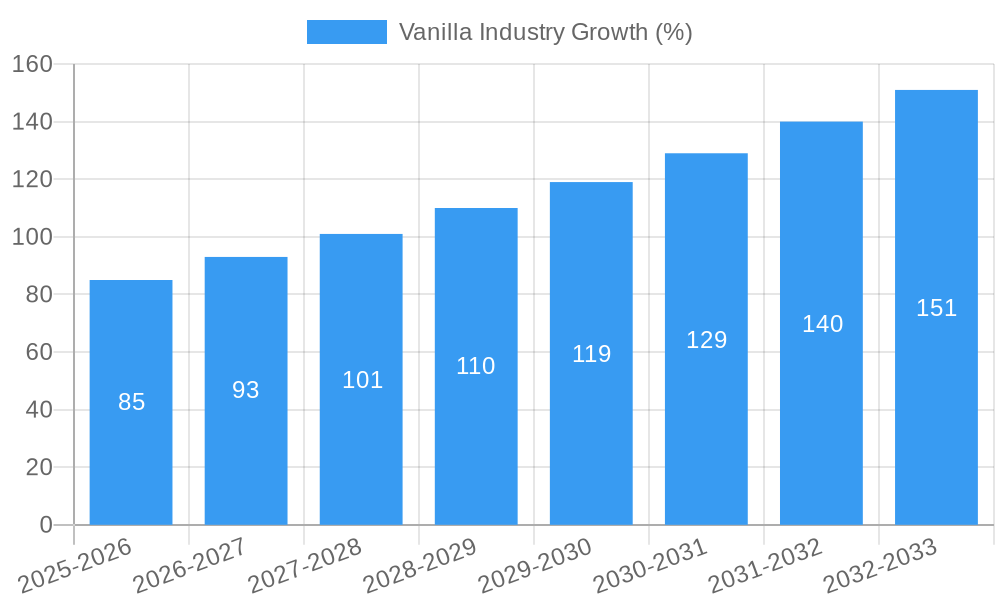
The global vanilla market, valued at $1.04 billion in 2025, is projected to experience robust growth, driven by rising consumer demand for natural flavors and ingredients in food and beverages, personal care, and pharmaceuticals. The Compound Annual Growth Rate (CAGR) of 8.13% from 2019 to 2024 indicates a steadily expanding market, expected to continue through 2033. Key drivers include the increasing popularity of vanilla-flavored products across diverse sectors, a growing preference for natural and organic ingredients, and the expanding middle class in developing economies fueling demand for premium food and beverage items. The market is segmented by type (bean, paste & extracts, powder) and application (food & beverages, personal care & cosmetics, pharmaceuticals, retail). The food and beverage sector currently dominates, but growth in personal care and cosmetics is expected to accelerate due to the increasing use of vanilla in skincare and fragrances. Major players such as Synthite Industries, B&G Foods, and McCormick & Company are actively involved in shaping the market through product innovation and strategic acquisitions. However, challenges remain, including price volatility due to weather patterns impacting vanilla bean production, potential supply chain disruptions, and the rise of artificial vanilla substitutes. Despite these restraints, the inherent appeal of natural vanilla and its versatility across various applications ensure strong growth prospects for the foreseeable future.
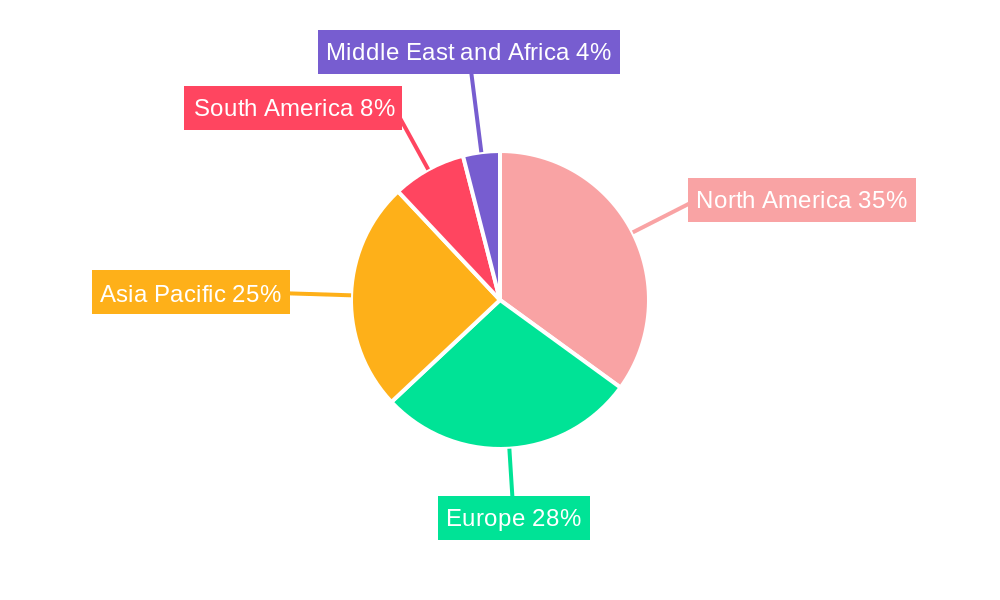
The geographical distribution of the vanilla market shows significant presence across North America, Europe, and Asia-Pacific. North America, particularly the United States, is a major consumer, driven by high disposable incomes and established preferences for vanilla-flavored products. The European market is robust, with strong demand in countries like France and Germany, known for their sophisticated culinary traditions. Asia-Pacific holds significant growth potential due to increasing urbanization and expanding middle classes in countries like China and India. The ongoing exploration of new applications for vanilla extract and powder, coupled with targeted marketing initiatives by industry players, will further contribute to market expansion. Strategic partnerships, mergers and acquisitions, and investments in sustainable vanilla bean cultivation will play a crucial role in maintaining the market's sustainable and profitable growth trajectory.
Vanilla Industry Market Report: 2019-2033
This comprehensive report provides a detailed analysis of the global vanilla industry, projecting a market value of $XX Million by 2033. Leveraging data from 2019-2024 (historical period), with 2025 as the base and estimated year, this report offers invaluable insights for industry professionals, investors, and stakeholders seeking to navigate the complexities of this dynamic market. The forecast period covers 2025-2033. Key players analyzed include Synthite Industries Ltd (Symega), B&G Foods Inc, Nielsen-Massey Vanillas Inc, McCormick & Company Inc, Givaudan SA, PROVA SAS, Symrise AG, Sensient Technologies Corporation, Firmenich SA, Adams Flavors Foods & Ingredients LLC, and others.
Vanilla Industry Market Structure & Innovation Trends
This section analyzes the competitive landscape, highlighting market concentration, key innovation drivers, regulatory influences, and significant M&A activity within the vanilla industry from 2019-2024. The global market is characterized by a mix of large multinational corporations and smaller, specialized players.
- Market Concentration: The top 5 players hold an estimated XX% market share, indicating a moderately concentrated market. Precise figures are dependent on confidential data and are not publicly available.
- Innovation Drivers: Consumer demand for natural, sustainable, and clean-label products is a primary driver. Technological advancements in extraction and bio-production methods are also contributing to innovation.
- Regulatory Frameworks: Varying regulations across different regions regarding labeling, sustainability, and food safety impact market dynamics.
- Product Substitutes: Synthetic vanillin and other flavoring agents pose competitive challenges to natural vanilla extracts.
- End-User Demographics: The food and beverage industry remains the largest end-user segment, followed by personal care and cosmetics.
- M&A Activities: Significant M&A activity has been observed in the past five years, with deal values reaching an estimated $XX Million in total (specific deal sizes are not publicly available). These activities reflect the consolidation and growth ambitions within the sector.
Vanilla Industry Market Dynamics & Trends
This section delves into the key market dynamics, examining growth drivers, technological disruptions, evolving consumer preferences, and competitive dynamics shaping the vanilla industry’s trajectory. The industry is projected to experience a Compound Annual Growth Rate (CAGR) of XX% during the forecast period (2025-2033). This growth is driven by several factors:
- Rising Demand for Natural Flavors: The increasing preference for natural and clean-label products fuels demand for natural vanilla extracts.
- Growing Popularity of Plant-Based Foods: Plant-based diets and food products are rising, significantly influencing the vanilla market.
- Expansion in the Food and Beverage Sector: Increasing consumption of processed foods and beverages drives the growth of the vanilla market.
- Innovation in Vanilla Products: New vanilla product variants and applications are expected to drive the market.
- Market Penetration: The vanilla market is showing significant penetration in emerging economies.
Dominant Regions & Segments in Vanilla Industry
This section identifies the leading regions, countries, and market segments within the vanilla industry, offering a deep dive into the key factors driving dominance.
Leading Region: The [Region Name] region is projected to dominate the global vanilla market due to [reasons for dominance, e.g., high consumption, favorable government policies, established infrastructure].
Leading Countries: [List of top 3 countries and rationale for leadership]
Dominant Segments:
- Type: Bean remains the largest segment due to its authentic flavor profile. Paste and extracts are showing strong growth, driven by convenience and ease of use. Powdered vanilla is expected to grow steadily due to its versatility and cost-effectiveness.
- Application: The food and beverage sector dominates the market. However, personal care and cosmetics are showing significant growth potential. Pharmaceutical applications are niche but demonstrate future opportunities. Retail sales are increasing with the rise of specialized gourmet food stores.
Key Drivers (by segment): Each segment exhibits specific growth drivers including economic growth, infrastructure development, and evolving consumer preferences. Detailed analysis of specific economic policies and infrastructural impacts are available within the full report.
Vanilla Industry Product Innovations
Recent years have witnessed significant innovation in vanilla products, including the development of bio-vanillin and sustainably sourced extracts. These innovations cater to the growing demand for natural, clean-label, and ethically produced ingredients. The industry is embracing technological advancements to enhance production efficiency, improve quality, and develop new applications. This trend contributes to improved market fit and competitive differentiation.
Report Scope & Segmentation Analysis
This report segments the vanilla market based on type (Bean, Paste and Extracts, Powder) and application (Food and Beverages, Personal Care and Cosmetics, Pharmaceuticals, Retail). Each segment presents unique growth projections, market sizes, and competitive dynamics, which are detailed in the full report. Market sizing for each segment is projected to be in the range of $XX Million to $XX Million by 2033.
Key Drivers of Vanilla Industry Growth
Several factors drive the growth of the vanilla industry. Firstly, the rising demand for natural flavors and clean-label products is a major catalyst. Secondly, technological advancements such as bio-vanillin production are enhancing the supply chain. Finally, increasing investments in sustainable and ethical sourcing practices are boosting the industry's growth trajectory.
Challenges in the Vanilla Industry Sector
The vanilla industry faces several challenges, including volatile prices due to supply chain disruptions and the impact of climate change on vanilla bean production. Regulatory hurdles in various regions add to the complexity. Furthermore, intense competition from synthetic vanillin presents a significant obstacle to growth. These challenges collectively impact market stability and profitability for businesses in the sector.
Emerging Opportunities in Vanilla Industry
The vanilla industry presents several opportunities. The increasing demand for natural flavorings in emerging markets offers significant growth potential. Moreover, innovations in extraction methods and product formulation unlock opportunities to expand into new application areas. Finally, focus on sustainability and ethical sourcing creates opportunities to enhance brand value and appeal to environmentally conscious consumers.
Leading Players in the Vanilla Industry Market
- Synthite Industries Ltd (Symega)
- B&G Foods Inc
- Nielsen-Massey Vanillas Inc
- McCormick & Company Inc
- Givaudan SA
- PROVA SAS
- Symrise AG
- Sensient Technologies Corporation
- Firmenich SA
- Adams Flavors Foods & Ingredients LLC
Key Developments in Vanilla Industry Industry
- December 2021: Advanced Biotech launched 'Abtvanforall plus natural,' a bio-vanillin expanding applications in alcoholic beverages, baked goods, frozen dairy, and hard candy.
- August 2021: Vanilla Bean Kings expanded operations, increasing capacity and broadening their market reach in the USA.
- January 2021: Blue Pacific Flavors introduced Kilimanjaro Vanilla, a sustainable extract, meeting growing consumer demand for clean-label products.
Future Outlook for Vanilla Industry Market
The future of the vanilla industry looks promising, driven by strong growth in demand for natural flavors and the continuous innovation in product offerings and sustainable production methods. Expanding into new markets, particularly in emerging economies, and investing in research and development to meet evolving consumer preferences will be key strategic opportunities for businesses in the years to come. The market is poised for continued expansion, with a projected market value exceeding $XX Million by 2033.
Vanilla Industry Segmentation
-
1. Type
- 1.1. Bean
- 1.2. Paste and Extracts
- 1.3. Powder
-
2. Application
- 2.1. Food and Beverages
- 2.2. Personal Care and Cosmetics
- 2.3. Pharmaceuticals
- 2.4. Retail
Vanilla Industry Segmentation By Geography
-
1. North America
- 1.1. United States
- 1.2. Canada
- 1.3. Mexico
- 1.4. Rest of North America
-
2. Europe
- 2.1. United Kingdom
- 2.2. Germany
- 2.3. Spain
- 2.4. France
- 2.5. Italy
- 2.6. Russia
- 2.7. Rest of Europe
-
3. Asia Pacific
- 3.1. China
- 3.2. Japan
- 3.3. India
- 3.4. Australia
- 3.5. Rest of Asia Pacific
-
4. South America
- 4.1. Brazil
- 4.2. Argentina
- 4.3. Rest of South America
-
5. Middle East and Africa
- 5.1. SaudI Arabia
- 5.2. South Africa
- 5.3. Rest of Middle East and Africa
Vanilla Industry REPORT HIGHLIGHTS
| Aspects | Details |
|---|---|
| Study Period | 2019-2033 |
| Base Year | 2024 |
| Estimated Year | 2025 |
| Forecast Period | 2025-2033 |
| Historical Period | 2019-2024 |
| Growth Rate | CAGR of 8.13% from 2019-2033 |
| Segmentation |
|
Table of Contents
- 1. Introduction
- 1.1. Research Scope
- 1.2. Market Segmentation
- 1.3. Research Methodology
- 1.4. Definitions and Assumptions
- 2. Executive Summary
- 2.1. Introduction
- 3. Market Dynamics
- 3.1. Introduction
- 3.2. Market Drivers
- 3.2.1. Increasing Focus On Health and Wellness; Surge in Product Innovation
- 3.3. Market Restrains
- 3.3.1. Presence of Substitutes
- 3.4. Market Trends
- 3.4.1. Expanding Demand for Natural/Clean-label Food
- 4. Market Factor Analysis
- 4.1. Porters Five Forces
- 4.2. Supply/Value Chain
- 4.3. PESTEL analysis
- 4.4. Market Entropy
- 4.5. Patent/Trademark Analysis
- 5. Global Vanilla Industry Analysis, Insights and Forecast, 2019-2031
- 5.1. Market Analysis, Insights and Forecast - by Type
- 5.1.1. Bean
- 5.1.2. Paste and Extracts
- 5.1.3. Powder
- 5.2. Market Analysis, Insights and Forecast - by Application
- 5.2.1. Food and Beverages
- 5.2.2. Personal Care and Cosmetics
- 5.2.3. Pharmaceuticals
- 5.2.4. Retail
- 5.3. Market Analysis, Insights and Forecast - by Region
- 5.3.1. North America
- 5.3.2. Europe
- 5.3.3. Asia Pacific
- 5.3.4. South America
- 5.3.5. Middle East and Africa
- 5.1. Market Analysis, Insights and Forecast - by Type
- 6. North America Vanilla Industry Analysis, Insights and Forecast, 2019-2031
- 6.1. Market Analysis, Insights and Forecast - by Type
- 6.1.1. Bean
- 6.1.2. Paste and Extracts
- 6.1.3. Powder
- 6.2. Market Analysis, Insights and Forecast - by Application
- 6.2.1. Food and Beverages
- 6.2.2. Personal Care and Cosmetics
- 6.2.3. Pharmaceuticals
- 6.2.4. Retail
- 6.1. Market Analysis, Insights and Forecast - by Type
- 7. Europe Vanilla Industry Analysis, Insights and Forecast, 2019-2031
- 7.1. Market Analysis, Insights and Forecast - by Type
- 7.1.1. Bean
- 7.1.2. Paste and Extracts
- 7.1.3. Powder
- 7.2. Market Analysis, Insights and Forecast - by Application
- 7.2.1. Food and Beverages
- 7.2.2. Personal Care and Cosmetics
- 7.2.3. Pharmaceuticals
- 7.2.4. Retail
- 7.1. Market Analysis, Insights and Forecast - by Type
- 8. Asia Pacific Vanilla Industry Analysis, Insights and Forecast, 2019-2031
- 8.1. Market Analysis, Insights and Forecast - by Type
- 8.1.1. Bean
- 8.1.2. Paste and Extracts
- 8.1.3. Powder
- 8.2. Market Analysis, Insights and Forecast - by Application
- 8.2.1. Food and Beverages
- 8.2.2. Personal Care and Cosmetics
- 8.2.3. Pharmaceuticals
- 8.2.4. Retail
- 8.1. Market Analysis, Insights and Forecast - by Type
- 9. South America Vanilla Industry Analysis, Insights and Forecast, 2019-2031
- 9.1. Market Analysis, Insights and Forecast - by Type
- 9.1.1. Bean
- 9.1.2. Paste and Extracts
- 9.1.3. Powder
- 9.2. Market Analysis, Insights and Forecast - by Application
- 9.2.1. Food and Beverages
- 9.2.2. Personal Care and Cosmetics
- 9.2.3. Pharmaceuticals
- 9.2.4. Retail
- 9.1. Market Analysis, Insights and Forecast - by Type
- 10. Middle East and Africa Vanilla Industry Analysis, Insights and Forecast, 2019-2031
- 10.1. Market Analysis, Insights and Forecast - by Type
- 10.1.1. Bean
- 10.1.2. Paste and Extracts
- 10.1.3. Powder
- 10.2. Market Analysis, Insights and Forecast - by Application
- 10.2.1. Food and Beverages
- 10.2.2. Personal Care and Cosmetics
- 10.2.3. Pharmaceuticals
- 10.2.4. Retail
- 10.1. Market Analysis, Insights and Forecast - by Type
- 11. North America Vanilla Industry Analysis, Insights and Forecast, 2019-2031
- 11.1. Market Analysis, Insights and Forecast - By Country/Sub-region
- 11.1.1 United States
- 11.1.2 Canada
- 11.1.3 Mexico
- 11.1.4 Rest of North America
- 12. Europe Vanilla Industry Analysis, Insights and Forecast, 2019-2031
- 12.1. Market Analysis, Insights and Forecast - By Country/Sub-region
- 12.1.1 United Kingdom
- 12.1.2 Germany
- 12.1.3 Spain
- 12.1.4 France
- 12.1.5 Italy
- 12.1.6 Russia
- 12.1.7 Rest of Europe
- 13. Asia Pacific Vanilla Industry Analysis, Insights and Forecast, 2019-2031
- 13.1. Market Analysis, Insights and Forecast - By Country/Sub-region
- 13.1.1 China
- 13.1.2 Japan
- 13.1.3 India
- 13.1.4 Australia
- 13.1.5 Rest of Asia Pacific
- 14. South America Vanilla Industry Analysis, Insights and Forecast, 2019-2031
- 14.1. Market Analysis, Insights and Forecast - By Country/Sub-region
- 14.1.1 Brazil
- 14.1.2 Argentina
- 14.1.3 Rest of South America
- 15. Middle East and Africa Vanilla Industry Analysis, Insights and Forecast, 2019-2031
- 15.1. Market Analysis, Insights and Forecast - By Country/Sub-region
- 15.1.1 SaudI Arabia
- 15.1.2 South Africa
- 15.1.3 Rest of Middle East and Africa
- 16. Competitive Analysis
- 16.1. Global Market Share Analysis 2024
- 16.2. Company Profiles
- 16.2.1 Synthite Industries Ltd (Symega)
- 16.2.1.1. Overview
- 16.2.1.2. Products
- 16.2.1.3. SWOT Analysis
- 16.2.1.4. Recent Developments
- 16.2.1.5. Financials (Based on Availability)
- 16.2.2 B&G Foods Inc
- 16.2.2.1. Overview
- 16.2.2.2. Products
- 16.2.2.3. SWOT Analysis
- 16.2.2.4. Recent Developments
- 16.2.2.5. Financials (Based on Availability)
- 16.2.3 Nielsen-Massey Vanillas Inc
- 16.2.3.1. Overview
- 16.2.3.2. Products
- 16.2.3.3. SWOT Analysis
- 16.2.3.4. Recent Developments
- 16.2.3.5. Financials (Based on Availability)
- 16.2.4 McCormick & Company Inc
- 16.2.4.1. Overview
- 16.2.4.2. Products
- 16.2.4.3. SWOT Analysis
- 16.2.4.4. Recent Developments
- 16.2.4.5. Financials (Based on Availability)
- 16.2.5 Givaudan SA
- 16.2.5.1. Overview
- 16.2.5.2. Products
- 16.2.5.3. SWOT Analysis
- 16.2.5.4. Recent Developments
- 16.2.5.5. Financials (Based on Availability)
- 16.2.6 PROVA SAS
- 16.2.6.1. Overview
- 16.2.6.2. Products
- 16.2.6.3. SWOT Analysis
- 16.2.6.4. Recent Developments
- 16.2.6.5. Financials (Based on Availability)
- 16.2.7 Symrise AG
- 16.2.7.1. Overview
- 16.2.7.2. Products
- 16.2.7.3. SWOT Analysis
- 16.2.7.4. Recent Developments
- 16.2.7.5. Financials (Based on Availability)
- 16.2.8 Sensient Technologies Corporation
- 16.2.8.1. Overview
- 16.2.8.2. Products
- 16.2.8.3. SWOT Analysis
- 16.2.8.4. Recent Developments
- 16.2.8.5. Financials (Based on Availability)
- 16.2.9 Firmenich SA*List Not Exhaustive
- 16.2.9.1. Overview
- 16.2.9.2. Products
- 16.2.9.3. SWOT Analysis
- 16.2.9.4. Recent Developments
- 16.2.9.5. Financials (Based on Availability)
- 16.2.10 Adams Flavors Foods & Ingredients LLC
- 16.2.10.1. Overview
- 16.2.10.2. Products
- 16.2.10.3. SWOT Analysis
- 16.2.10.4. Recent Developments
- 16.2.10.5. Financials (Based on Availability)
- 16.2.1 Synthite Industries Ltd (Symega)
List of Figures
- Figure 1: Global Vanilla Industry Revenue Breakdown (Million, %) by Region 2024 & 2032
- Figure 2: North America Vanilla Industry Revenue (Million), by Country 2024 & 2032
- Figure 3: North America Vanilla Industry Revenue Share (%), by Country 2024 & 2032
- Figure 4: Europe Vanilla Industry Revenue (Million), by Country 2024 & 2032
- Figure 5: Europe Vanilla Industry Revenue Share (%), by Country 2024 & 2032
- Figure 6: Asia Pacific Vanilla Industry Revenue (Million), by Country 2024 & 2032
- Figure 7: Asia Pacific Vanilla Industry Revenue Share (%), by Country 2024 & 2032
- Figure 8: South America Vanilla Industry Revenue (Million), by Country 2024 & 2032
- Figure 9: South America Vanilla Industry Revenue Share (%), by Country 2024 & 2032
- Figure 10: Middle East and Africa Vanilla Industry Revenue (Million), by Country 2024 & 2032
- Figure 11: Middle East and Africa Vanilla Industry Revenue Share (%), by Country 2024 & 2032
- Figure 12: North America Vanilla Industry Revenue (Million), by Type 2024 & 2032
- Figure 13: North America Vanilla Industry Revenue Share (%), by Type 2024 & 2032
- Figure 14: North America Vanilla Industry Revenue (Million), by Application 2024 & 2032
- Figure 15: North America Vanilla Industry Revenue Share (%), by Application 2024 & 2032
- Figure 16: North America Vanilla Industry Revenue (Million), by Country 2024 & 2032
- Figure 17: North America Vanilla Industry Revenue Share (%), by Country 2024 & 2032
- Figure 18: Europe Vanilla Industry Revenue (Million), by Type 2024 & 2032
- Figure 19: Europe Vanilla Industry Revenue Share (%), by Type 2024 & 2032
- Figure 20: Europe Vanilla Industry Revenue (Million), by Application 2024 & 2032
- Figure 21: Europe Vanilla Industry Revenue Share (%), by Application 2024 & 2032
- Figure 22: Europe Vanilla Industry Revenue (Million), by Country 2024 & 2032
- Figure 23: Europe Vanilla Industry Revenue Share (%), by Country 2024 & 2032
- Figure 24: Asia Pacific Vanilla Industry Revenue (Million), by Type 2024 & 2032
- Figure 25: Asia Pacific Vanilla Industry Revenue Share (%), by Type 2024 & 2032
- Figure 26: Asia Pacific Vanilla Industry Revenue (Million), by Application 2024 & 2032
- Figure 27: Asia Pacific Vanilla Industry Revenue Share (%), by Application 2024 & 2032
- Figure 28: Asia Pacific Vanilla Industry Revenue (Million), by Country 2024 & 2032
- Figure 29: Asia Pacific Vanilla Industry Revenue Share (%), by Country 2024 & 2032
- Figure 30: South America Vanilla Industry Revenue (Million), by Type 2024 & 2032
- Figure 31: South America Vanilla Industry Revenue Share (%), by Type 2024 & 2032
- Figure 32: South America Vanilla Industry Revenue (Million), by Application 2024 & 2032
- Figure 33: South America Vanilla Industry Revenue Share (%), by Application 2024 & 2032
- Figure 34: South America Vanilla Industry Revenue (Million), by Country 2024 & 2032
- Figure 35: South America Vanilla Industry Revenue Share (%), by Country 2024 & 2032
- Figure 36: Middle East and Africa Vanilla Industry Revenue (Million), by Type 2024 & 2032
- Figure 37: Middle East and Africa Vanilla Industry Revenue Share (%), by Type 2024 & 2032
- Figure 38: Middle East and Africa Vanilla Industry Revenue (Million), by Application 2024 & 2032
- Figure 39: Middle East and Africa Vanilla Industry Revenue Share (%), by Application 2024 & 2032
- Figure 40: Middle East and Africa Vanilla Industry Revenue (Million), by Country 2024 & 2032
- Figure 41: Middle East and Africa Vanilla Industry Revenue Share (%), by Country 2024 & 2032
List of Tables
- Table 1: Global Vanilla Industry Revenue Million Forecast, by Region 2019 & 2032
- Table 2: Global Vanilla Industry Revenue Million Forecast, by Type 2019 & 2032
- Table 3: Global Vanilla Industry Revenue Million Forecast, by Application 2019 & 2032
- Table 4: Global Vanilla Industry Revenue Million Forecast, by Region 2019 & 2032
- Table 5: Global Vanilla Industry Revenue Million Forecast, by Country 2019 & 2032
- Table 6: United States Vanilla Industry Revenue (Million) Forecast, by Application 2019 & 2032
- Table 7: Canada Vanilla Industry Revenue (Million) Forecast, by Application 2019 & 2032
- Table 8: Mexico Vanilla Industry Revenue (Million) Forecast, by Application 2019 & 2032
- Table 9: Rest of North America Vanilla Industry Revenue (Million) Forecast, by Application 2019 & 2032
- Table 10: Global Vanilla Industry Revenue Million Forecast, by Country 2019 & 2032
- Table 11: United Kingdom Vanilla Industry Revenue (Million) Forecast, by Application 2019 & 2032
- Table 12: Germany Vanilla Industry Revenue (Million) Forecast, by Application 2019 & 2032
- Table 13: Spain Vanilla Industry Revenue (Million) Forecast, by Application 2019 & 2032
- Table 14: France Vanilla Industry Revenue (Million) Forecast, by Application 2019 & 2032
- Table 15: Italy Vanilla Industry Revenue (Million) Forecast, by Application 2019 & 2032
- Table 16: Russia Vanilla Industry Revenue (Million) Forecast, by Application 2019 & 2032
- Table 17: Rest of Europe Vanilla Industry Revenue (Million) Forecast, by Application 2019 & 2032
- Table 18: Global Vanilla Industry Revenue Million Forecast, by Country 2019 & 2032
- Table 19: China Vanilla Industry Revenue (Million) Forecast, by Application 2019 & 2032
- Table 20: Japan Vanilla Industry Revenue (Million) Forecast, by Application 2019 & 2032
- Table 21: India Vanilla Industry Revenue (Million) Forecast, by Application 2019 & 2032
- Table 22: Australia Vanilla Industry Revenue (Million) Forecast, by Application 2019 & 2032
- Table 23: Rest of Asia Pacific Vanilla Industry Revenue (Million) Forecast, by Application 2019 & 2032
- Table 24: Global Vanilla Industry Revenue Million Forecast, by Country 2019 & 2032
- Table 25: Brazil Vanilla Industry Revenue (Million) Forecast, by Application 2019 & 2032
- Table 26: Argentina Vanilla Industry Revenue (Million) Forecast, by Application 2019 & 2032
- Table 27: Rest of South America Vanilla Industry Revenue (Million) Forecast, by Application 2019 & 2032
- Table 28: Global Vanilla Industry Revenue Million Forecast, by Country 2019 & 2032
- Table 29: SaudI Arabia Vanilla Industry Revenue (Million) Forecast, by Application 2019 & 2032
- Table 30: South Africa Vanilla Industry Revenue (Million) Forecast, by Application 2019 & 2032
- Table 31: Rest of Middle East and Africa Vanilla Industry Revenue (Million) Forecast, by Application 2019 & 2032
- Table 32: Global Vanilla Industry Revenue Million Forecast, by Type 2019 & 2032
- Table 33: Global Vanilla Industry Revenue Million Forecast, by Application 2019 & 2032
- Table 34: Global Vanilla Industry Revenue Million Forecast, by Country 2019 & 2032
- Table 35: United States Vanilla Industry Revenue (Million) Forecast, by Application 2019 & 2032
- Table 36: Canada Vanilla Industry Revenue (Million) Forecast, by Application 2019 & 2032
- Table 37: Mexico Vanilla Industry Revenue (Million) Forecast, by Application 2019 & 2032
- Table 38: Rest of North America Vanilla Industry Revenue (Million) Forecast, by Application 2019 & 2032
- Table 39: Global Vanilla Industry Revenue Million Forecast, by Type 2019 & 2032
- Table 40: Global Vanilla Industry Revenue Million Forecast, by Application 2019 & 2032
- Table 41: Global Vanilla Industry Revenue Million Forecast, by Country 2019 & 2032
- Table 42: United Kingdom Vanilla Industry Revenue (Million) Forecast, by Application 2019 & 2032
- Table 43: Germany Vanilla Industry Revenue (Million) Forecast, by Application 2019 & 2032
- Table 44: Spain Vanilla Industry Revenue (Million) Forecast, by Application 2019 & 2032
- Table 45: France Vanilla Industry Revenue (Million) Forecast, by Application 2019 & 2032
- Table 46: Italy Vanilla Industry Revenue (Million) Forecast, by Application 2019 & 2032
- Table 47: Russia Vanilla Industry Revenue (Million) Forecast, by Application 2019 & 2032
- Table 48: Rest of Europe Vanilla Industry Revenue (Million) Forecast, by Application 2019 & 2032
- Table 49: Global Vanilla Industry Revenue Million Forecast, by Type 2019 & 2032
- Table 50: Global Vanilla Industry Revenue Million Forecast, by Application 2019 & 2032
- Table 51: Global Vanilla Industry Revenue Million Forecast, by Country 2019 & 2032
- Table 52: China Vanilla Industry Revenue (Million) Forecast, by Application 2019 & 2032
- Table 53: Japan Vanilla Industry Revenue (Million) Forecast, by Application 2019 & 2032
- Table 54: India Vanilla Industry Revenue (Million) Forecast, by Application 2019 & 2032
- Table 55: Australia Vanilla Industry Revenue (Million) Forecast, by Application 2019 & 2032
- Table 56: Rest of Asia Pacific Vanilla Industry Revenue (Million) Forecast, by Application 2019 & 2032
- Table 57: Global Vanilla Industry Revenue Million Forecast, by Type 2019 & 2032
- Table 58: Global Vanilla Industry Revenue Million Forecast, by Application 2019 & 2032
- Table 59: Global Vanilla Industry Revenue Million Forecast, by Country 2019 & 2032
- Table 60: Brazil Vanilla Industry Revenue (Million) Forecast, by Application 2019 & 2032
- Table 61: Argentina Vanilla Industry Revenue (Million) Forecast, by Application 2019 & 2032
- Table 62: Rest of South America Vanilla Industry Revenue (Million) Forecast, by Application 2019 & 2032
- Table 63: Global Vanilla Industry Revenue Million Forecast, by Type 2019 & 2032
- Table 64: Global Vanilla Industry Revenue Million Forecast, by Application 2019 & 2032
- Table 65: Global Vanilla Industry Revenue Million Forecast, by Country 2019 & 2032
- Table 66: SaudI Arabia Vanilla Industry Revenue (Million) Forecast, by Application 2019 & 2032
- Table 67: South Africa Vanilla Industry Revenue (Million) Forecast, by Application 2019 & 2032
- Table 68: Rest of Middle East and Africa Vanilla Industry Revenue (Million) Forecast, by Application 2019 & 2032
Frequently Asked Questions
1. What is the projected Compound Annual Growth Rate (CAGR) of the Vanilla Industry?
The projected CAGR is approximately 8.13%.
2. Which companies are prominent players in the Vanilla Industry?
Key companies in the market include Synthite Industries Ltd (Symega), B&G Foods Inc, Nielsen-Massey Vanillas Inc, McCormick & Company Inc, Givaudan SA, PROVA SAS, Symrise AG, Sensient Technologies Corporation, Firmenich SA*List Not Exhaustive, Adams Flavors Foods & Ingredients LLC.
3. What are the main segments of the Vanilla Industry?
The market segments include Type, Application.
4. Can you provide details about the market size?
The market size is estimated to be USD 1.04 Million as of 2022.
5. What are some drivers contributing to market growth?
Increasing Focus On Health and Wellness; Surge in Product Innovation.
6. What are the notable trends driving market growth?
Expanding Demand for Natural/Clean-label Food.
7. Are there any restraints impacting market growth?
Presence of Substitutes.
8. Can you provide examples of recent developments in the market?
In December 2021, Advanced Biotech launched 'Abtvanforall plus natural,' a bio-vanillin used in alcoholic beverages, baked goods, frozen dairy, and hard candy manufacturing.
9. What pricing options are available for accessing the report?
Pricing options include single-user, multi-user, and enterprise licenses priced at USD 4750, USD 5250, and USD 8750 respectively.
10. Is the market size provided in terms of value or volume?
The market size is provided in terms of value, measured in Million.
11. Are there any specific market keywords associated with the report?
Yes, the market keyword associated with the report is "Vanilla Industry," which aids in identifying and referencing the specific market segment covered.
12. How do I determine which pricing option suits my needs best?
The pricing options vary based on user requirements and access needs. Individual users may opt for single-user licenses, while businesses requiring broader access may choose multi-user or enterprise licenses for cost-effective access to the report.
13. Are there any additional resources or data provided in the Vanilla Industry report?
While the report offers comprehensive insights, it's advisable to review the specific contents or supplementary materials provided to ascertain if additional resources or data are available.
14. How can I stay updated on further developments or reports in the Vanilla Industry?
To stay informed about further developments, trends, and reports in the Vanilla Industry, consider subscribing to industry newsletters, following relevant companies and organizations, or regularly checking reputable industry news sources and publications.
Methodology
Step 1 - Identification of Relevant Samples Size from Population Database


Step 2 - Approaches for Defining Global Market Size (Value, Volume* & Price*)

Note*: In applicable scenarios
Step 3 - Data Sources
Primary Research
- Web Analytics
- Survey Reports
- Research Institute
- Latest Research Reports
- Opinion Leaders
Secondary Research
- Annual Reports
- White Paper
- Latest Press Release
- Industry Association
- Paid Database
- Investor Presentations

Step 4 - Data Triangulation
Involves using different sources of information in order to increase the validity of a study
These sources are likely to be stakeholders in a program - participants, other researchers, program staff, other community members, and so on.
Then we put all data in single framework & apply various statistical tools to find out the dynamic on the market.
During the analysis stage, feedback from the stakeholder groups would be compared to determine areas of agreement as well as areas of divergence


