

Key Insights
The veterinary chemistry analyzers market is experiencing robust growth, projected to reach a substantial size driven by several key factors. The increasing prevalence of chronic diseases in companion animals, coupled with a rising pet ownership rate globally, fuels the demand for accurate and rapid diagnostic tools. Veterinary clinics and hospitals are increasingly adopting automated chemistry analyzers to improve efficiency, reduce turnaround times, and enhance diagnostic accuracy. Technological advancements, such as the development of portable and point-of-care devices, are contributing significantly to market expansion. Furthermore, the growing emphasis on preventative care and early disease detection is pushing the demand for these analyzers, particularly in developed regions like North America and Europe. The market is segmented by product type (instruments and consumables), application (blood chemistry, blood gas, urinalysis, glucose monitoring), animal type (farm and companion animals), and analyzer type (portable and tabletop). Consumables, including reagents and calibrators, represent a significant revenue stream. While the companion animal segment currently dominates, farm animal testing is showing promising growth due to increasing focus on animal health management in the agricultural sector. Competition in the market is intense, with established players like IDEXX Laboratories and Heska Corporation competing with emerging companies offering innovative and cost-effective solutions. The market's future growth trajectory will depend on factors such as regulatory approvals for new technologies, technological advancements, and the overall economic health of the veterinary sector.
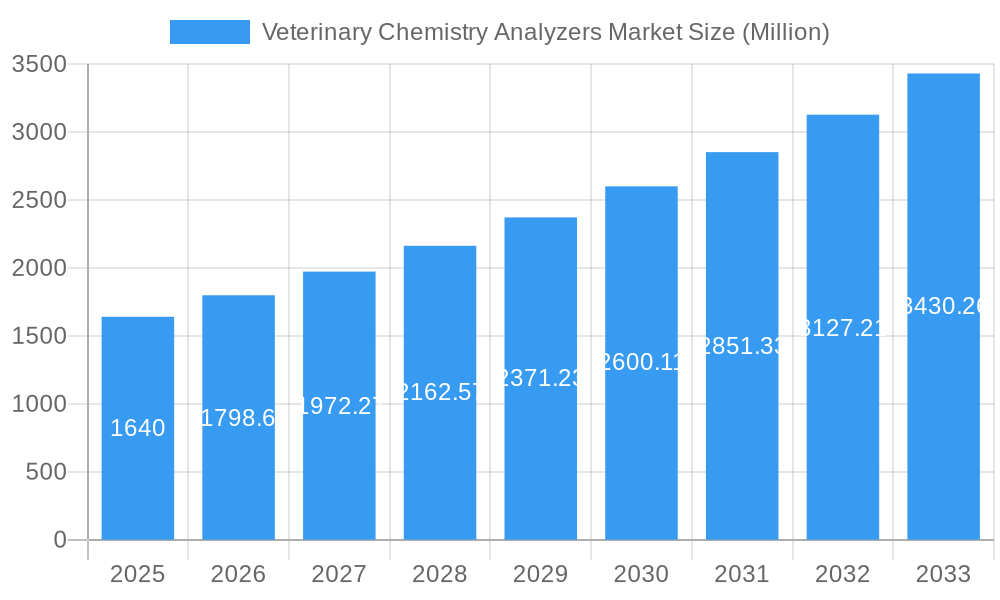
Veterinary Chemistry Analyzers Market Market Size (In Billion)
The market's substantial Compound Annual Growth Rate (CAGR) of 9.50% signifies a consistent upward trend. This growth is anticipated to continue through the forecast period (2025-2033), fueled by factors like increasing investments in veterinary infrastructure in emerging economies, particularly in Asia-Pacific and South America. However, certain restraints may hinder growth, including high initial investment costs for advanced analyzers and the need for skilled personnel to operate them. Nevertheless, the overall market outlook remains positive, driven by the increasing demand for better animal healthcare, continuous technological improvements, and a growing focus on improving the efficiency and accuracy of veterinary diagnostics. The regional distribution of the market is expected to reflect the varying levels of veterinary infrastructure and economic development across the globe, with North America and Europe maintaining a significant market share while Asia-Pacific shows substantial growth potential.
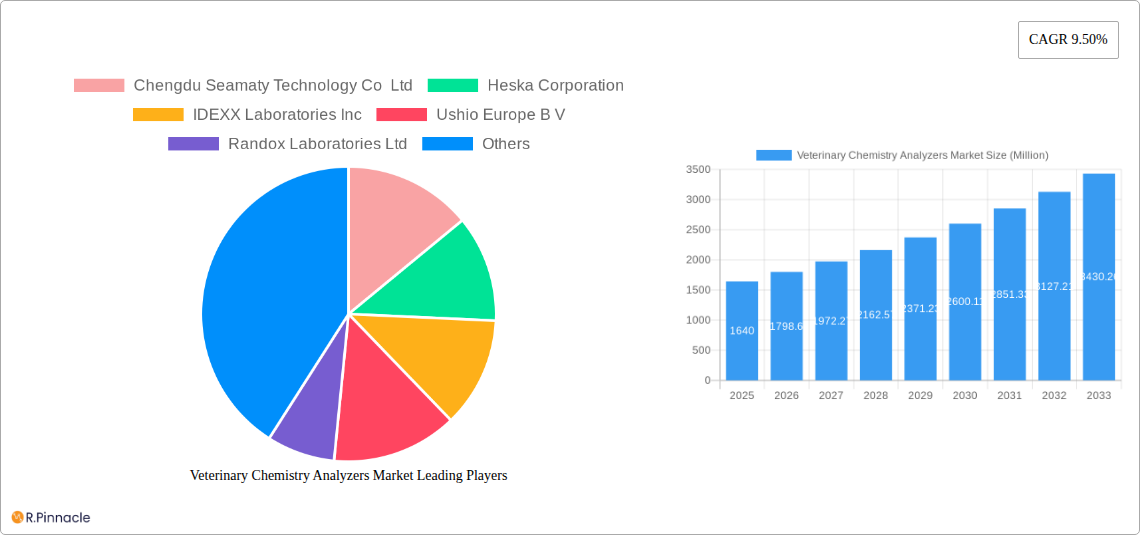
Veterinary Chemistry Analyzers Market Company Market Share
Veterinary Chemistry Analyzers Market Report: 2019-2033
This comprehensive report provides an in-depth analysis of the Veterinary Chemistry Analyzers Market, offering valuable insights for industry professionals, investors, and strategic decision-makers. The study period covers 2019-2033, with 2025 as the base and estimated year, and a forecast period of 2025-2033. The historical period analyzed is 2019-2024. The market is segmented by product (Instruments, Consumables), application (Blood Chemistry Analysis, Blood Gas and Electrolyte Analysis, Urinalysis, Glucose Monitoring), animal type (Farm Animals, Companion Animals), and type (Portable, Table-Top). Key players analyzed include Chengdu Seamaty Technology Co Ltd, Heska Corporation, IDEXX Laboratories Inc, Ushio Europe B V, Randox Laboratories Ltd, DiaSys Diagnostic Systems GmbH, Scil Animal Care Company GmbH, ProtectLife International Biomedical Inc (Amishield), HORIBA Medical, and Zoetis Inc. The report projects a market value of xx Million by 2033.
Veterinary Chemistry Analyzers Market Structure & Innovation Trends
The Veterinary Chemistry Analyzers market exhibits a moderately consolidated structure, with a few major players holding significant market share. IDEXX Laboratories Inc and Heska Corporation are currently leading the market, collectively holding an estimated xx% market share in 2025. The market is characterized by continuous innovation driven by the need for faster, more accurate, and portable diagnostic tools. Stringent regulatory frameworks, particularly concerning diagnostic accuracy and safety, influence market dynamics. The market witnesses significant M&A activity, reflecting consolidation efforts and technological integration. Deal values in the past 5 years have ranged from xx Million to xx Million, with an average of xx Million per deal. Product substitutes, such as traditional laboratory methods, remain a factor, but the increasing preference for rapid and point-of-care diagnostics is gradually reducing their influence. End-user demographics, including veterinary clinics, hospitals, and research institutions, are diverse, with increasing demand from companion animal care driving substantial growth.
- Market Concentration: Moderately Consolidated
- Key Innovation Drivers: Speed, Accuracy, Portability
- Regulatory Landscape: Stringent, focusing on accuracy and safety
- M&A Activity: Frequent, with deal values averaging xx Million
Veterinary Chemistry Analyzers Market Dynamics & Trends
The Veterinary Chemistry Analyzers market is experiencing robust growth, driven by several factors. The rising prevalence of animal diseases, increasing pet ownership, and advancements in veterinary care contribute to heightened demand for accurate and efficient diagnostic tools. Technological advancements such as miniaturization, automation, and improved analytical capabilities are fueling market expansion. A CAGR of xx% is projected from 2025 to 2033, primarily driven by the increasing adoption of point-of-care diagnostics in veterinary clinics. Consumer preference for rapid turnaround times and user-friendly devices is significantly impacting market trends. Intense competition among established players and new entrants leads to continuous product innovation and price adjustments. Market penetration in developing economies remains relatively low, presenting significant growth opportunities.
Dominant Regions & Segments in Veterinary Chemistry Analyzers Market
North America currently holds the dominant position in the global Veterinary Chemistry Analyzers market, driven by factors such as high pet ownership rates, advanced veterinary infrastructure, and substantial investment in animal healthcare. Within North America, the United States accounts for the largest share.
Key Drivers in North America:
- High Pet Ownership Rates
- Advanced Veterinary Infrastructure
- High Investment in Animal Healthcare
Dominant Segments:
- By Product: Instruments dominate the market due to higher initial investment and recurring consumable revenue.
- By Application: Blood Chemistry Analysis is the leading segment due to its broad applicability across various animal types and diseases.
- By Animal Type: Companion animals currently hold the largest market share, fueled by increasing pet ownership and higher veterinary spending per animal.
- By Type: Table-top analyzers remain prevalent, but portable analyzers are witnessing a surge in demand, driven by their convenience and portability.
The European market is also witnessing substantial growth due to the expanding veterinary sector and rising awareness regarding animal health. Asia-Pacific exhibits significant growth potential, driven by the increasing pet ownership rates and government initiatives promoting animal healthcare.
Veterinary Chemistry Analyzers Market Product Innovations
Recent product innovations focus on enhanced accuracy, speed, and ease of use. Miniaturized and portable analyzers are gaining traction, enabling point-of-care diagnostics. Integration of advanced technologies such as AI and machine learning is enhancing diagnostic capabilities and automating data analysis. The market is witnessing a trend towards user-friendly interfaces and cloud-based data management systems. These innovations cater to the growing demand for efficient and effective veterinary diagnostics, aligning with the overall shift towards advanced technologies in veterinary medicine.
Report Scope & Segmentation Analysis
This report comprehensively segments the Veterinary Chemistry Analyzers market across several dimensions. The By Product segment includes Instruments and Consumables, with instruments exhibiting higher growth due to technological advancements and increased adoption. The By Application segment covers Blood Chemistry Analysis, Blood Gas and Electrolyte Analysis, Urinalysis, and Glucose Monitoring, with Blood Chemistry Analysis leading the market share. The By Animal Type segment includes Farm Animals and Companion Animals, with companion animals dominating the market. Finally, the By Type segment includes Portable and Table-Top analyzers, both exhibiting significant growth potential. Each segment's growth projection is detailed within the full report.
Key Drivers of Veterinary Chemistry Analyzers Market Growth
The Veterinary Chemistry Analyzers market is fueled by several key drivers. The rising prevalence of animal diseases necessitates advanced diagnostic tools, driving demand. Technological advancements lead to faster, more accurate, and portable analyzers. Increased pet ownership and spending on pet healthcare create strong market momentum. Government regulations and initiatives promoting animal welfare further boost market growth.
Challenges in the Veterinary Chemistry Analyzers Market Sector
The market faces challenges such as high initial investment costs for advanced analyzers, potentially limiting adoption in smaller clinics. Supply chain disruptions can impact the availability of components and consumables. Intense competition from established players and emerging entrants necessitates continuous innovation and cost optimization. Regulatory hurdles and compliance requirements add complexity to market entry and operations.
Emerging Opportunities in Veterinary Chemistry Analyzers Market
Emerging opportunities lie in the development of highly sensitive and specific analyzers for early disease detection. Integration of AI and machine learning holds potential for automated data analysis and improved diagnostic accuracy. Expansion into developing markets with growing pet ownership rates presents significant growth prospects. The development of user-friendly, cost-effective point-of-care diagnostics addresses a critical market need.
Leading Players in the Veterinary Chemistry Analyzers Market Market
- Chengdu Seamaty Technology Co Ltd
- Heska Corporation
- IDEXX Laboratories Inc
- Ushio Europe B V
- Randox Laboratories Ltd
- DiaSys Diagnostic Systems GmbH
- Scil Animal Care Company GmbH
- ProtectLife International Biomedical Inc (Amishield)
- HORIBA Medical
- Zoetis Inc
Key Developments in Veterinary Chemistry Analyzers Market Industry
- December 2022: Bionote applied for approval of domestic and international sales of their clinical chemistry analyzer, Vcheck C, expanding into the veterinary clinical chemistry market. This signifies the entry of a new player and potential increased competition.
- April 2022: Carolina Liquid Chemistries Corporation signed a semi-exclusive agreement to distribute a portable chemistry analyzer for the US veterinary market. This signifies a strategic move to expand distribution networks and market reach.
Future Outlook for Veterinary Chemistry Analyzers Market Market
The Veterinary Chemistry Analyzers market is poised for continued growth, driven by technological advancements, increasing pet ownership, and rising demand for rapid and accurate diagnostics. Strategic partnerships, product diversification, and expansion into emerging markets will shape future market dynamics. The integration of AI and advanced analytics will further enhance diagnostic capabilities and open new avenues for market expansion. The market's future outlook remains positive, with significant growth potential across various segments and geographical regions.
Veterinary Chemistry Analyzers Market Segmentation
-
1. Type
- 1.1. Portable
- 1.2. Table-Top
-
2. Product
- 2.1. Instruments
- 2.2. Consumables
-
3. Application
- 3.1. Blood Chemistry Analysis
- 3.2. Blood Gas and Electrolyte Analysis
- 3.3. Urinalysis
- 3.4. Glucose Monitoring
-
4. Animal Type
- 4.1. Farm Animals
- 4.2. Companion Animals
Veterinary Chemistry Analyzers Market Segmentation By Geography
-
1. North America
- 1.1. United States
- 1.2. Canada
- 1.3. Mexico
-
2. Europe
- 2.1. Germany
- 2.2. United Kingdom
- 2.3. France
- 2.4. Italy
- 2.5. Spain
- 2.6. Rest of Europe
-
3. Asia Pacific
- 3.1. China
- 3.2. Japan
- 3.3. India
- 3.4. Australia
- 3.5. South Korea
- 3.6. Rest of Asia Pacific
-
4. Middle East and Africa
- 4.1. GCC
- 4.2. South Africa
- 4.3. Rest of Middle East and Africa
-
5. South America
- 5.1. Brazil
- 5.2. Argentina
- 5.3. Rest of South America
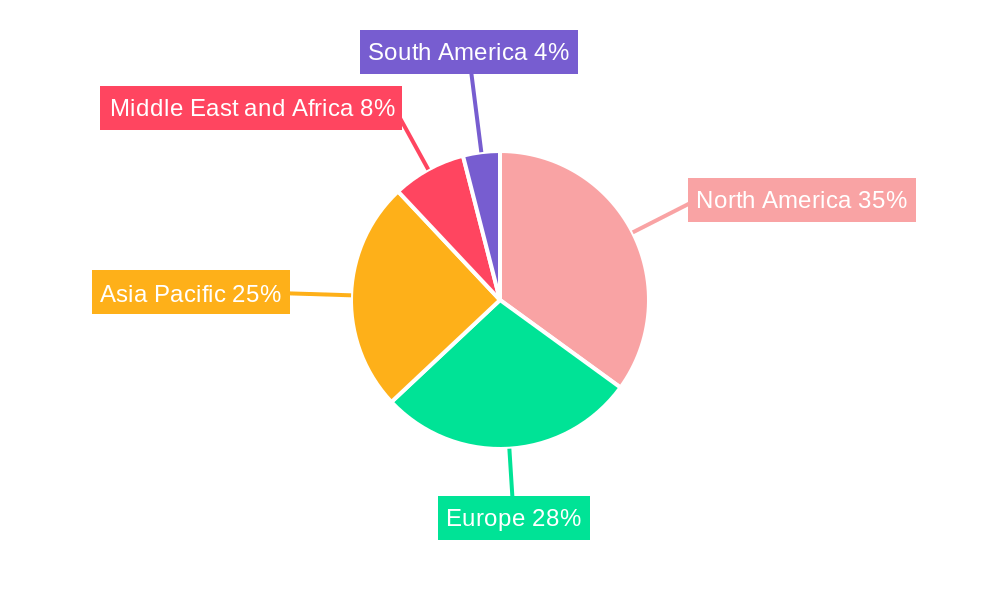
Veterinary Chemistry Analyzers Market Regional Market Share
Geographic Coverage of Veterinary Chemistry Analyzers Market
Veterinary Chemistry Analyzers Market REPORT HIGHLIGHTS
| Aspects | Details |
|---|---|
| Study Period | 2020-2034 |
| Base Year | 2025 |
| Estimated Year | 2026 |
| Forecast Period | 2026-2034 |
| Historical Period | 2020-2025 |
| Growth Rate | CAGR of 9.50% from 2020-2034 |
| Segmentation |
|
Table of Contents
- 1. Introduction
- 1.1. Research Scope
- 1.2. Market Segmentation
- 1.3. Research Objective
- 1.4. Definitions and Assumptions
- 2. Executive Summary
- 2.1. Market Snapshot
- 3. Market Dynamics
- 3.1. Market Drivers
- 3.2. Market Restrains
- 3.3. Market Trends
- 3.4. Market Opportunities
- 4. Market Factor Analysis
- 4.1. Porters Five Forces
- 4.1.1. Bargaining Power of Suppliers
- 4.1.2. Bargaining Power of Buyers
- 4.1.3. Threat of New Entrants
- 4.1.4. Threat of Substitutes
- 4.1.5. Competitive Rivalry
- 4.2. PESTEL analysis
- 4.3. BCG Analysis
- 4.3.1. Stars (High Growth, High Market Share)
- 4.3.2. Cash Cows (Low Growth, High Market Share)
- 4.3.3. Question Mark (High Growth, Low Market Share)
- 4.3.4. Dogs (Low Growth, Low Market Share)
- 4.4. Ansoff Matrix Analysis
- 4.5. Supply Chain Analysis
- 4.6. Regulatory Landscape
- 4.7. Current Market Potential and Opportunity Assessment (TAM–SAM–SOM Framework)
- 4.8. PRI Analyst Note
- 4.1. Porters Five Forces
- 5. Market Analysis, Insights and Forecast 2021-2033
- 5.1. Market Analysis, Insights and Forecast - by Type
- 5.1.1. Portable
- 5.1.2. Table-Top
- 5.2. Market Analysis, Insights and Forecast - by Product
- 5.2.1. Instruments
- 5.2.2. Consumables
- 5.3. Market Analysis, Insights and Forecast - by Application
- 5.3.1. Blood Chemistry Analysis
- 5.3.2. Blood Gas and Electrolyte Analysis
- 5.3.3. Urinalysis
- 5.3.4. Glucose Monitoring
- 5.4. Market Analysis, Insights and Forecast - by Animal Type
- 5.4.1. Farm Animals
- 5.4.2. Companion Animals
- 5.5. Market Analysis, Insights and Forecast - by Region
- 5.5.1. North America
- 5.5.2. Europe
- 5.5.3. Asia Pacific
- 5.5.4. Middle East and Africa
- 5.5.5. South America
- 5.1. Market Analysis, Insights and Forecast - by Type
- 6. Global Veterinary Chemistry Analyzers Market Analysis, Insights and Forecast, 2021-2033
- 6.1. Market Analysis, Insights and Forecast - by Type
- 6.1.1. Portable
- 6.1.2. Table-Top
- 6.2. Market Analysis, Insights and Forecast - by Product
- 6.2.1. Instruments
- 6.2.2. Consumables
- 6.3. Market Analysis, Insights and Forecast - by Application
- 6.3.1. Blood Chemistry Analysis
- 6.3.2. Blood Gas and Electrolyte Analysis
- 6.3.3. Urinalysis
- 6.3.4. Glucose Monitoring
- 6.4. Market Analysis, Insights and Forecast - by Animal Type
- 6.4.1. Farm Animals
- 6.4.2. Companion Animals
- 6.1. Market Analysis, Insights and Forecast - by Type
- 7. North America Veterinary Chemistry Analyzers Market Analysis, Insights and Forecast, 2020-2032
- 7.1. Market Analysis, Insights and Forecast - by Type
- 7.1.1. Portable
- 7.1.2. Table-Top
- 7.2. Market Analysis, Insights and Forecast - by Product
- 7.2.1. Instruments
- 7.2.2. Consumables
- 7.3. Market Analysis, Insights and Forecast - by Application
- 7.3.1. Blood Chemistry Analysis
- 7.3.2. Blood Gas and Electrolyte Analysis
- 7.3.3. Urinalysis
- 7.3.4. Glucose Monitoring
- 7.4. Market Analysis, Insights and Forecast - by Animal Type
- 7.4.1. Farm Animals
- 7.4.2. Companion Animals
- 7.1. Market Analysis, Insights and Forecast - by Type
- 8. Europe Veterinary Chemistry Analyzers Market Analysis, Insights and Forecast, 2020-2032
- 8.1. Market Analysis, Insights and Forecast - by Type
- 8.1.1. Portable
- 8.1.2. Table-Top
- 8.2. Market Analysis, Insights and Forecast - by Product
- 8.2.1. Instruments
- 8.2.2. Consumables
- 8.3. Market Analysis, Insights and Forecast - by Application
- 8.3.1. Blood Chemistry Analysis
- 8.3.2. Blood Gas and Electrolyte Analysis
- 8.3.3. Urinalysis
- 8.3.4. Glucose Monitoring
- 8.4. Market Analysis, Insights and Forecast - by Animal Type
- 8.4.1. Farm Animals
- 8.4.2. Companion Animals
- 8.1. Market Analysis, Insights and Forecast - by Type
- 9. Asia Pacific Veterinary Chemistry Analyzers Market Analysis, Insights and Forecast, 2020-2032
- 9.1. Market Analysis, Insights and Forecast - by Type
- 9.1.1. Portable
- 9.1.2. Table-Top
- 9.2. Market Analysis, Insights and Forecast - by Product
- 9.2.1. Instruments
- 9.2.2. Consumables
- 9.3. Market Analysis, Insights and Forecast - by Application
- 9.3.1. Blood Chemistry Analysis
- 9.3.2. Blood Gas and Electrolyte Analysis
- 9.3.3. Urinalysis
- 9.3.4. Glucose Monitoring
- 9.4. Market Analysis, Insights and Forecast - by Animal Type
- 9.4.1. Farm Animals
- 9.4.2. Companion Animals
- 9.1. Market Analysis, Insights and Forecast - by Type
- 10. Middle East and Africa Veterinary Chemistry Analyzers Market Analysis, Insights and Forecast, 2020-2032
- 10.1. Market Analysis, Insights and Forecast - by Type
- 10.1.1. Portable
- 10.1.2. Table-Top
- 10.2. Market Analysis, Insights and Forecast - by Product
- 10.2.1. Instruments
- 10.2.2. Consumables
- 10.3. Market Analysis, Insights and Forecast - by Application
- 10.3.1. Blood Chemistry Analysis
- 10.3.2. Blood Gas and Electrolyte Analysis
- 10.3.3. Urinalysis
- 10.3.4. Glucose Monitoring
- 10.4. Market Analysis, Insights and Forecast - by Animal Type
- 10.4.1. Farm Animals
- 10.4.2. Companion Animals
- 10.1. Market Analysis, Insights and Forecast - by Type
- 11. South America Veterinary Chemistry Analyzers Market Analysis, Insights and Forecast, 2020-2032
- 11.1. Market Analysis, Insights and Forecast - by Type
- 11.1.1. Portable
- 11.1.2. Table-Top
- 11.2. Market Analysis, Insights and Forecast - by Product
- 11.2.1. Instruments
- 11.2.2. Consumables
- 11.3. Market Analysis, Insights and Forecast - by Application
- 11.3.1. Blood Chemistry Analysis
- 11.3.2. Blood Gas and Electrolyte Analysis
- 11.3.3. Urinalysis
- 11.3.4. Glucose Monitoring
- 11.4. Market Analysis, Insights and Forecast - by Animal Type
- 11.4.1. Farm Animals
- 11.4.2. Companion Animals
- 11.1. Market Analysis, Insights and Forecast - by Type
- 12. Competitive Analysis
- 12.1. Company Profiles
- 12.1.1 Chengdu Seamaty Technology Co Ltd
- 12.1.1.1. Company Overview
- 12.1.1.2. Products
- 12.1.1.3. Company Financials
- 12.1.1.4. SWOT Analysis
- 12.1.2 Heska Corporation
- 12.1.2.1. Company Overview
- 12.1.2.2. Products
- 12.1.2.3. Company Financials
- 12.1.2.4. SWOT Analysis
- 12.1.3 IDEXX Laboratories Inc
- 12.1.3.1. Company Overview
- 12.1.3.2. Products
- 12.1.3.3. Company Financials
- 12.1.3.4. SWOT Analysis
- 12.1.4 Ushio Europe B V
- 12.1.4.1. Company Overview
- 12.1.4.2. Products
- 12.1.4.3. Company Financials
- 12.1.4.4. SWOT Analysis
- 12.1.5 Randox Laboratories Ltd
- 12.1.5.1. Company Overview
- 12.1.5.2. Products
- 12.1.5.3. Company Financials
- 12.1.5.4. SWOT Analysis
- 12.1.6 DiaSys Diagnostic Systems GmbH
- 12.1.6.1. Company Overview
- 12.1.6.2. Products
- 12.1.6.3. Company Financials
- 12.1.6.4. SWOT Analysis
- 12.1.7 Scil Animal Care Company GmbH
- 12.1.7.1. Company Overview
- 12.1.7.2. Products
- 12.1.7.3. Company Financials
- 12.1.7.4. SWOT Analysis
- 12.1.8 ProtectLife International Biomedical Inc (Amishield)
- 12.1.8.1. Company Overview
- 12.1.8.2. Products
- 12.1.8.3. Company Financials
- 12.1.8.4. SWOT Analysis
- 12.1.9 HORIBA Medical
- 12.1.9.1. Company Overview
- 12.1.9.2. Products
- 12.1.9.3. Company Financials
- 12.1.9.4. SWOT Analysis
- 12.1.10 Zoetis Inc
- 12.1.10.1. Company Overview
- 12.1.10.2. Products
- 12.1.10.3. Company Financials
- 12.1.10.4. SWOT Analysis
- 12.1.1 Chengdu Seamaty Technology Co Ltd
- 12.2. Market Entropy
- 12.2.1 Company's Key Areas Served
- 12.2.2 Recent Developments
- 12.3. Company Market Share Analysis 2025
- 12.3.1 Top 5 Companies Market Share Analysis
- 12.3.2 Top 3 Companies Market Share Analysis
- 12.4. List of Potential Customers
- 13. Research Methodology
List of Figures
- Figure 1: Global Veterinary Chemistry Analyzers Market Revenue Breakdown (Million, %) by Region 2025 & 2033
- Figure 2: Global Veterinary Chemistry Analyzers Market Volume Breakdown (K Unit, %) by Region 2025 & 2033
- Figure 3: North America Veterinary Chemistry Analyzers Market Revenue (Million), by Type 2025 & 2033
- Figure 4: North America Veterinary Chemistry Analyzers Market Volume (K Unit), by Type 2025 & 2033
- Figure 5: North America Veterinary Chemistry Analyzers Market Revenue Share (%), by Type 2025 & 2033
- Figure 6: North America Veterinary Chemistry Analyzers Market Volume Share (%), by Type 2025 & 2033
- Figure 7: North America Veterinary Chemistry Analyzers Market Revenue (Million), by Product 2025 & 2033
- Figure 8: North America Veterinary Chemistry Analyzers Market Volume (K Unit), by Product 2025 & 2033
- Figure 9: North America Veterinary Chemistry Analyzers Market Revenue Share (%), by Product 2025 & 2033
- Figure 10: North America Veterinary Chemistry Analyzers Market Volume Share (%), by Product 2025 & 2033
- Figure 11: North America Veterinary Chemistry Analyzers Market Revenue (Million), by Application 2025 & 2033
- Figure 12: North America Veterinary Chemistry Analyzers Market Volume (K Unit), by Application 2025 & 2033
- Figure 13: North America Veterinary Chemistry Analyzers Market Revenue Share (%), by Application 2025 & 2033
- Figure 14: North America Veterinary Chemistry Analyzers Market Volume Share (%), by Application 2025 & 2033
- Figure 15: North America Veterinary Chemistry Analyzers Market Revenue (Million), by Animal Type 2025 & 2033
- Figure 16: North America Veterinary Chemistry Analyzers Market Volume (K Unit), by Animal Type 2025 & 2033
- Figure 17: North America Veterinary Chemistry Analyzers Market Revenue Share (%), by Animal Type 2025 & 2033
- Figure 18: North America Veterinary Chemistry Analyzers Market Volume Share (%), by Animal Type 2025 & 2033
- Figure 19: North America Veterinary Chemistry Analyzers Market Revenue (Million), by Country 2025 & 2033
- Figure 20: North America Veterinary Chemistry Analyzers Market Volume (K Unit), by Country 2025 & 2033
- Figure 21: North America Veterinary Chemistry Analyzers Market Revenue Share (%), by Country 2025 & 2033
- Figure 22: North America Veterinary Chemistry Analyzers Market Volume Share (%), by Country 2025 & 2033
- Figure 23: Europe Veterinary Chemistry Analyzers Market Revenue (Million), by Type 2025 & 2033
- Figure 24: Europe Veterinary Chemistry Analyzers Market Volume (K Unit), by Type 2025 & 2033
- Figure 25: Europe Veterinary Chemistry Analyzers Market Revenue Share (%), by Type 2025 & 2033
- Figure 26: Europe Veterinary Chemistry Analyzers Market Volume Share (%), by Type 2025 & 2033
- Figure 27: Europe Veterinary Chemistry Analyzers Market Revenue (Million), by Product 2025 & 2033
- Figure 28: Europe Veterinary Chemistry Analyzers Market Volume (K Unit), by Product 2025 & 2033
- Figure 29: Europe Veterinary Chemistry Analyzers Market Revenue Share (%), by Product 2025 & 2033
- Figure 30: Europe Veterinary Chemistry Analyzers Market Volume Share (%), by Product 2025 & 2033
- Figure 31: Europe Veterinary Chemistry Analyzers Market Revenue (Million), by Application 2025 & 2033
- Figure 32: Europe Veterinary Chemistry Analyzers Market Volume (K Unit), by Application 2025 & 2033
- Figure 33: Europe Veterinary Chemistry Analyzers Market Revenue Share (%), by Application 2025 & 2033
- Figure 34: Europe Veterinary Chemistry Analyzers Market Volume Share (%), by Application 2025 & 2033
- Figure 35: Europe Veterinary Chemistry Analyzers Market Revenue (Million), by Animal Type 2025 & 2033
- Figure 36: Europe Veterinary Chemistry Analyzers Market Volume (K Unit), by Animal Type 2025 & 2033
- Figure 37: Europe Veterinary Chemistry Analyzers Market Revenue Share (%), by Animal Type 2025 & 2033
- Figure 38: Europe Veterinary Chemistry Analyzers Market Volume Share (%), by Animal Type 2025 & 2033
- Figure 39: Europe Veterinary Chemistry Analyzers Market Revenue (Million), by Country 2025 & 2033
- Figure 40: Europe Veterinary Chemistry Analyzers Market Volume (K Unit), by Country 2025 & 2033
- Figure 41: Europe Veterinary Chemistry Analyzers Market Revenue Share (%), by Country 2025 & 2033
- Figure 42: Europe Veterinary Chemistry Analyzers Market Volume Share (%), by Country 2025 & 2033
- Figure 43: Asia Pacific Veterinary Chemistry Analyzers Market Revenue (Million), by Type 2025 & 2033
- Figure 44: Asia Pacific Veterinary Chemistry Analyzers Market Volume (K Unit), by Type 2025 & 2033
- Figure 45: Asia Pacific Veterinary Chemistry Analyzers Market Revenue Share (%), by Type 2025 & 2033
- Figure 46: Asia Pacific Veterinary Chemistry Analyzers Market Volume Share (%), by Type 2025 & 2033
- Figure 47: Asia Pacific Veterinary Chemistry Analyzers Market Revenue (Million), by Product 2025 & 2033
- Figure 48: Asia Pacific Veterinary Chemistry Analyzers Market Volume (K Unit), by Product 2025 & 2033
- Figure 49: Asia Pacific Veterinary Chemistry Analyzers Market Revenue Share (%), by Product 2025 & 2033
- Figure 50: Asia Pacific Veterinary Chemistry Analyzers Market Volume Share (%), by Product 2025 & 2033
- Figure 51: Asia Pacific Veterinary Chemistry Analyzers Market Revenue (Million), by Application 2025 & 2033
- Figure 52: Asia Pacific Veterinary Chemistry Analyzers Market Volume (K Unit), by Application 2025 & 2033
- Figure 53: Asia Pacific Veterinary Chemistry Analyzers Market Revenue Share (%), by Application 2025 & 2033
- Figure 54: Asia Pacific Veterinary Chemistry Analyzers Market Volume Share (%), by Application 2025 & 2033
- Figure 55: Asia Pacific Veterinary Chemistry Analyzers Market Revenue (Million), by Animal Type 2025 & 2033
- Figure 56: Asia Pacific Veterinary Chemistry Analyzers Market Volume (K Unit), by Animal Type 2025 & 2033
- Figure 57: Asia Pacific Veterinary Chemistry Analyzers Market Revenue Share (%), by Animal Type 2025 & 2033
- Figure 58: Asia Pacific Veterinary Chemistry Analyzers Market Volume Share (%), by Animal Type 2025 & 2033
- Figure 59: Asia Pacific Veterinary Chemistry Analyzers Market Revenue (Million), by Country 2025 & 2033
- Figure 60: Asia Pacific Veterinary Chemistry Analyzers Market Volume (K Unit), by Country 2025 & 2033
- Figure 61: Asia Pacific Veterinary Chemistry Analyzers Market Revenue Share (%), by Country 2025 & 2033
- Figure 62: Asia Pacific Veterinary Chemistry Analyzers Market Volume Share (%), by Country 2025 & 2033
- Figure 63: Middle East and Africa Veterinary Chemistry Analyzers Market Revenue (Million), by Type 2025 & 2033
- Figure 64: Middle East and Africa Veterinary Chemistry Analyzers Market Volume (K Unit), by Type 2025 & 2033
- Figure 65: Middle East and Africa Veterinary Chemistry Analyzers Market Revenue Share (%), by Type 2025 & 2033
- Figure 66: Middle East and Africa Veterinary Chemistry Analyzers Market Volume Share (%), by Type 2025 & 2033
- Figure 67: Middle East and Africa Veterinary Chemistry Analyzers Market Revenue (Million), by Product 2025 & 2033
- Figure 68: Middle East and Africa Veterinary Chemistry Analyzers Market Volume (K Unit), by Product 2025 & 2033
- Figure 69: Middle East and Africa Veterinary Chemistry Analyzers Market Revenue Share (%), by Product 2025 & 2033
- Figure 70: Middle East and Africa Veterinary Chemistry Analyzers Market Volume Share (%), by Product 2025 & 2033
- Figure 71: Middle East and Africa Veterinary Chemistry Analyzers Market Revenue (Million), by Application 2025 & 2033
- Figure 72: Middle East and Africa Veterinary Chemistry Analyzers Market Volume (K Unit), by Application 2025 & 2033
- Figure 73: Middle East and Africa Veterinary Chemistry Analyzers Market Revenue Share (%), by Application 2025 & 2033
- Figure 74: Middle East and Africa Veterinary Chemistry Analyzers Market Volume Share (%), by Application 2025 & 2033
- Figure 75: Middle East and Africa Veterinary Chemistry Analyzers Market Revenue (Million), by Animal Type 2025 & 2033
- Figure 76: Middle East and Africa Veterinary Chemistry Analyzers Market Volume (K Unit), by Animal Type 2025 & 2033
- Figure 77: Middle East and Africa Veterinary Chemistry Analyzers Market Revenue Share (%), by Animal Type 2025 & 2033
- Figure 78: Middle East and Africa Veterinary Chemistry Analyzers Market Volume Share (%), by Animal Type 2025 & 2033
- Figure 79: Middle East and Africa Veterinary Chemistry Analyzers Market Revenue (Million), by Country 2025 & 2033
- Figure 80: Middle East and Africa Veterinary Chemistry Analyzers Market Volume (K Unit), by Country 2025 & 2033
- Figure 81: Middle East and Africa Veterinary Chemistry Analyzers Market Revenue Share (%), by Country 2025 & 2033
- Figure 82: Middle East and Africa Veterinary Chemistry Analyzers Market Volume Share (%), by Country 2025 & 2033
- Figure 83: South America Veterinary Chemistry Analyzers Market Revenue (Million), by Type 2025 & 2033
- Figure 84: South America Veterinary Chemistry Analyzers Market Volume (K Unit), by Type 2025 & 2033
- Figure 85: South America Veterinary Chemistry Analyzers Market Revenue Share (%), by Type 2025 & 2033
- Figure 86: South America Veterinary Chemistry Analyzers Market Volume Share (%), by Type 2025 & 2033
- Figure 87: South America Veterinary Chemistry Analyzers Market Revenue (Million), by Product 2025 & 2033
- Figure 88: South America Veterinary Chemistry Analyzers Market Volume (K Unit), by Product 2025 & 2033
- Figure 89: South America Veterinary Chemistry Analyzers Market Revenue Share (%), by Product 2025 & 2033
- Figure 90: South America Veterinary Chemistry Analyzers Market Volume Share (%), by Product 2025 & 2033
- Figure 91: South America Veterinary Chemistry Analyzers Market Revenue (Million), by Application 2025 & 2033
- Figure 92: South America Veterinary Chemistry Analyzers Market Volume (K Unit), by Application 2025 & 2033
- Figure 93: South America Veterinary Chemistry Analyzers Market Revenue Share (%), by Application 2025 & 2033
- Figure 94: South America Veterinary Chemistry Analyzers Market Volume Share (%), by Application 2025 & 2033
- Figure 95: South America Veterinary Chemistry Analyzers Market Revenue (Million), by Animal Type 2025 & 2033
- Figure 96: South America Veterinary Chemistry Analyzers Market Volume (K Unit), by Animal Type 2025 & 2033
- Figure 97: South America Veterinary Chemistry Analyzers Market Revenue Share (%), by Animal Type 2025 & 2033
- Figure 98: South America Veterinary Chemistry Analyzers Market Volume Share (%), by Animal Type 2025 & 2033
- Figure 99: South America Veterinary Chemistry Analyzers Market Revenue (Million), by Country 2025 & 2033
- Figure 100: South America Veterinary Chemistry Analyzers Market Volume (K Unit), by Country 2025 & 2033
- Figure 101: South America Veterinary Chemistry Analyzers Market Revenue Share (%), by Country 2025 & 2033
- Figure 102: South America Veterinary Chemistry Analyzers Market Volume Share (%), by Country 2025 & 2033
List of Tables
- Table 1: Global Veterinary Chemistry Analyzers Market Revenue Million Forecast, by Type 2020 & 2033
- Table 2: Global Veterinary Chemistry Analyzers Market Volume K Unit Forecast, by Type 2020 & 2033
- Table 3: Global Veterinary Chemistry Analyzers Market Revenue Million Forecast, by Product 2020 & 2033
- Table 4: Global Veterinary Chemistry Analyzers Market Volume K Unit Forecast, by Product 2020 & 2033
- Table 5: Global Veterinary Chemistry Analyzers Market Revenue Million Forecast, by Application 2020 & 2033
- Table 6: Global Veterinary Chemistry Analyzers Market Volume K Unit Forecast, by Application 2020 & 2033
- Table 7: Global Veterinary Chemistry Analyzers Market Revenue Million Forecast, by Animal Type 2020 & 2033
- Table 8: Global Veterinary Chemistry Analyzers Market Volume K Unit Forecast, by Animal Type 2020 & 2033
- Table 9: Global Veterinary Chemistry Analyzers Market Revenue Million Forecast, by Region 2020 & 2033
- Table 10: Global Veterinary Chemistry Analyzers Market Volume K Unit Forecast, by Region 2020 & 2033
- Table 11: Global Veterinary Chemistry Analyzers Market Revenue Million Forecast, by Type 2020 & 2033
- Table 12: Global Veterinary Chemistry Analyzers Market Volume K Unit Forecast, by Type 2020 & 2033
- Table 13: Global Veterinary Chemistry Analyzers Market Revenue Million Forecast, by Product 2020 & 2033
- Table 14: Global Veterinary Chemistry Analyzers Market Volume K Unit Forecast, by Product 2020 & 2033
- Table 15: Global Veterinary Chemistry Analyzers Market Revenue Million Forecast, by Application 2020 & 2033
- Table 16: Global Veterinary Chemistry Analyzers Market Volume K Unit Forecast, by Application 2020 & 2033
- Table 17: Global Veterinary Chemistry Analyzers Market Revenue Million Forecast, by Animal Type 2020 & 2033
- Table 18: Global Veterinary Chemistry Analyzers Market Volume K Unit Forecast, by Animal Type 2020 & 2033
- Table 19: Global Veterinary Chemistry Analyzers Market Revenue Million Forecast, by Country 2020 & 2033
- Table 20: Global Veterinary Chemistry Analyzers Market Volume K Unit Forecast, by Country 2020 & 2033
- Table 21: United States Veterinary Chemistry Analyzers Market Revenue (Million) Forecast, by Application 2020 & 2033
- Table 22: United States Veterinary Chemistry Analyzers Market Volume (K Unit) Forecast, by Application 2020 & 2033
- Table 23: Canada Veterinary Chemistry Analyzers Market Revenue (Million) Forecast, by Application 2020 & 2033
- Table 24: Canada Veterinary Chemistry Analyzers Market Volume (K Unit) Forecast, by Application 2020 & 2033
- Table 25: Mexico Veterinary Chemistry Analyzers Market Revenue (Million) Forecast, by Application 2020 & 2033
- Table 26: Mexico Veterinary Chemistry Analyzers Market Volume (K Unit) Forecast, by Application 2020 & 2033
- Table 27: Global Veterinary Chemistry Analyzers Market Revenue Million Forecast, by Type 2020 & 2033
- Table 28: Global Veterinary Chemistry Analyzers Market Volume K Unit Forecast, by Type 2020 & 2033
- Table 29: Global Veterinary Chemistry Analyzers Market Revenue Million Forecast, by Product 2020 & 2033
- Table 30: Global Veterinary Chemistry Analyzers Market Volume K Unit Forecast, by Product 2020 & 2033
- Table 31: Global Veterinary Chemistry Analyzers Market Revenue Million Forecast, by Application 2020 & 2033
- Table 32: Global Veterinary Chemistry Analyzers Market Volume K Unit Forecast, by Application 2020 & 2033
- Table 33: Global Veterinary Chemistry Analyzers Market Revenue Million Forecast, by Animal Type 2020 & 2033
- Table 34: Global Veterinary Chemistry Analyzers Market Volume K Unit Forecast, by Animal Type 2020 & 2033
- Table 35: Global Veterinary Chemistry Analyzers Market Revenue Million Forecast, by Country 2020 & 2033
- Table 36: Global Veterinary Chemistry Analyzers Market Volume K Unit Forecast, by Country 2020 & 2033
- Table 37: Germany Veterinary Chemistry Analyzers Market Revenue (Million) Forecast, by Application 2020 & 2033
- Table 38: Germany Veterinary Chemistry Analyzers Market Volume (K Unit) Forecast, by Application 2020 & 2033
- Table 39: United Kingdom Veterinary Chemistry Analyzers Market Revenue (Million) Forecast, by Application 2020 & 2033
- Table 40: United Kingdom Veterinary Chemistry Analyzers Market Volume (K Unit) Forecast, by Application 2020 & 2033
- Table 41: France Veterinary Chemistry Analyzers Market Revenue (Million) Forecast, by Application 2020 & 2033
- Table 42: France Veterinary Chemistry Analyzers Market Volume (K Unit) Forecast, by Application 2020 & 2033
- Table 43: Italy Veterinary Chemistry Analyzers Market Revenue (Million) Forecast, by Application 2020 & 2033
- Table 44: Italy Veterinary Chemistry Analyzers Market Volume (K Unit) Forecast, by Application 2020 & 2033
- Table 45: Spain Veterinary Chemistry Analyzers Market Revenue (Million) Forecast, by Application 2020 & 2033
- Table 46: Spain Veterinary Chemistry Analyzers Market Volume (K Unit) Forecast, by Application 2020 & 2033
- Table 47: Rest of Europe Veterinary Chemistry Analyzers Market Revenue (Million) Forecast, by Application 2020 & 2033
- Table 48: Rest of Europe Veterinary Chemistry Analyzers Market Volume (K Unit) Forecast, by Application 2020 & 2033
- Table 49: Global Veterinary Chemistry Analyzers Market Revenue Million Forecast, by Type 2020 & 2033
- Table 50: Global Veterinary Chemistry Analyzers Market Volume K Unit Forecast, by Type 2020 & 2033
- Table 51: Global Veterinary Chemistry Analyzers Market Revenue Million Forecast, by Product 2020 & 2033
- Table 52: Global Veterinary Chemistry Analyzers Market Volume K Unit Forecast, by Product 2020 & 2033
- Table 53: Global Veterinary Chemistry Analyzers Market Revenue Million Forecast, by Application 2020 & 2033
- Table 54: Global Veterinary Chemistry Analyzers Market Volume K Unit Forecast, by Application 2020 & 2033
- Table 55: Global Veterinary Chemistry Analyzers Market Revenue Million Forecast, by Animal Type 2020 & 2033
- Table 56: Global Veterinary Chemistry Analyzers Market Volume K Unit Forecast, by Animal Type 2020 & 2033
- Table 57: Global Veterinary Chemistry Analyzers Market Revenue Million Forecast, by Country 2020 & 2033
- Table 58: Global Veterinary Chemistry Analyzers Market Volume K Unit Forecast, by Country 2020 & 2033
- Table 59: China Veterinary Chemistry Analyzers Market Revenue (Million) Forecast, by Application 2020 & 2033
- Table 60: China Veterinary Chemistry Analyzers Market Volume (K Unit) Forecast, by Application 2020 & 2033
- Table 61: Japan Veterinary Chemistry Analyzers Market Revenue (Million) Forecast, by Application 2020 & 2033
- Table 62: Japan Veterinary Chemistry Analyzers Market Volume (K Unit) Forecast, by Application 2020 & 2033
- Table 63: India Veterinary Chemistry Analyzers Market Revenue (Million) Forecast, by Application 2020 & 2033
- Table 64: India Veterinary Chemistry Analyzers Market Volume (K Unit) Forecast, by Application 2020 & 2033
- Table 65: Australia Veterinary Chemistry Analyzers Market Revenue (Million) Forecast, by Application 2020 & 2033
- Table 66: Australia Veterinary Chemistry Analyzers Market Volume (K Unit) Forecast, by Application 2020 & 2033
- Table 67: South Korea Veterinary Chemistry Analyzers Market Revenue (Million) Forecast, by Application 2020 & 2033
- Table 68: South Korea Veterinary Chemistry Analyzers Market Volume (K Unit) Forecast, by Application 2020 & 2033
- Table 69: Rest of Asia Pacific Veterinary Chemistry Analyzers Market Revenue (Million) Forecast, by Application 2020 & 2033
- Table 70: Rest of Asia Pacific Veterinary Chemistry Analyzers Market Volume (K Unit) Forecast, by Application 2020 & 2033
- Table 71: Global Veterinary Chemistry Analyzers Market Revenue Million Forecast, by Type 2020 & 2033
- Table 72: Global Veterinary Chemistry Analyzers Market Volume K Unit Forecast, by Type 2020 & 2033
- Table 73: Global Veterinary Chemistry Analyzers Market Revenue Million Forecast, by Product 2020 & 2033
- Table 74: Global Veterinary Chemistry Analyzers Market Volume K Unit Forecast, by Product 2020 & 2033
- Table 75: Global Veterinary Chemistry Analyzers Market Revenue Million Forecast, by Application 2020 & 2033
- Table 76: Global Veterinary Chemistry Analyzers Market Volume K Unit Forecast, by Application 2020 & 2033
- Table 77: Global Veterinary Chemistry Analyzers Market Revenue Million Forecast, by Animal Type 2020 & 2033
- Table 78: Global Veterinary Chemistry Analyzers Market Volume K Unit Forecast, by Animal Type 2020 & 2033
- Table 79: Global Veterinary Chemistry Analyzers Market Revenue Million Forecast, by Country 2020 & 2033
- Table 80: Global Veterinary Chemistry Analyzers Market Volume K Unit Forecast, by Country 2020 & 2033
- Table 81: GCC Veterinary Chemistry Analyzers Market Revenue (Million) Forecast, by Application 2020 & 2033
- Table 82: GCC Veterinary Chemistry Analyzers Market Volume (K Unit) Forecast, by Application 2020 & 2033
- Table 83: South Africa Veterinary Chemistry Analyzers Market Revenue (Million) Forecast, by Application 2020 & 2033
- Table 84: South Africa Veterinary Chemistry Analyzers Market Volume (K Unit) Forecast, by Application 2020 & 2033
- Table 85: Rest of Middle East and Africa Veterinary Chemistry Analyzers Market Revenue (Million) Forecast, by Application 2020 & 2033
- Table 86: Rest of Middle East and Africa Veterinary Chemistry Analyzers Market Volume (K Unit) Forecast, by Application 2020 & 2033
- Table 87: Global Veterinary Chemistry Analyzers Market Revenue Million Forecast, by Type 2020 & 2033
- Table 88: Global Veterinary Chemistry Analyzers Market Volume K Unit Forecast, by Type 2020 & 2033
- Table 89: Global Veterinary Chemistry Analyzers Market Revenue Million Forecast, by Product 2020 & 2033
- Table 90: Global Veterinary Chemistry Analyzers Market Volume K Unit Forecast, by Product 2020 & 2033
- Table 91: Global Veterinary Chemistry Analyzers Market Revenue Million Forecast, by Application 2020 & 2033
- Table 92: Global Veterinary Chemistry Analyzers Market Volume K Unit Forecast, by Application 2020 & 2033
- Table 93: Global Veterinary Chemistry Analyzers Market Revenue Million Forecast, by Animal Type 2020 & 2033
- Table 94: Global Veterinary Chemistry Analyzers Market Volume K Unit Forecast, by Animal Type 2020 & 2033
- Table 95: Global Veterinary Chemistry Analyzers Market Revenue Million Forecast, by Country 2020 & 2033
- Table 96: Global Veterinary Chemistry Analyzers Market Volume K Unit Forecast, by Country 2020 & 2033
- Table 97: Brazil Veterinary Chemistry Analyzers Market Revenue (Million) Forecast, by Application 2020 & 2033
- Table 98: Brazil Veterinary Chemistry Analyzers Market Volume (K Unit) Forecast, by Application 2020 & 2033
- Table 99: Argentina Veterinary Chemistry Analyzers Market Revenue (Million) Forecast, by Application 2020 & 2033
- Table 100: Argentina Veterinary Chemistry Analyzers Market Volume (K Unit) Forecast, by Application 2020 & 2033
- Table 101: Rest of South America Veterinary Chemistry Analyzers Market Revenue (Million) Forecast, by Application 2020 & 2033
- Table 102: Rest of South America Veterinary Chemistry Analyzers Market Volume (K Unit) Forecast, by Application 2020 & 2033
Frequently Asked Questions
1. What is the projected Compound Annual Growth Rate (CAGR) of the Veterinary Chemistry Analyzers Market?
The projected CAGR is approximately 9.50%.
2. Which companies are prominent players in the Veterinary Chemistry Analyzers Market?
Key companies in the market include Chengdu Seamaty Technology Co Ltd, Heska Corporation, IDEXX Laboratories Inc, Ushio Europe B V, Randox Laboratories Ltd, DiaSys Diagnostic Systems GmbH, Scil Animal Care Company GmbH, ProtectLife International Biomedical Inc (Amishield), HORIBA Medical, Zoetis Inc.
3. What are the main segments of the Veterinary Chemistry Analyzers Market?
The market segments include Type, Product, Application, Animal Type.
4. Can you provide details about the market size?
The market size is estimated to be USD 1.64 Million as of 2022.
5. What are some drivers contributing to market growth?
Increase in Animal Adoption and Animal Healthcare Expenditure; Rise in the Prevalence of Animal Diseases.
6. What are the notable trends driving market growth?
Companion Animals Segment are Expected to Witness Growth Over the Forecast Period.
7. Are there any restraints impacting market growth?
High Cost Associated with Veterinary Chemistry Analyzers; Lack of Veterinarians and Shortage of Skilled Farm Workers.
8. Can you provide examples of recent developments in the market?
December 2022: Bionote, an in-vitro diagnostic product manufacturer, expanded into the veterinary clinical chemistry market by applying for approval of the domestic and international sales of their clinical chemistry analyzer Vcheck C.
9. What pricing options are available for accessing the report?
Pricing options include single-user, multi-user, and enterprise licenses priced at USD 4750, USD 5250, and USD 8750 respectively.
10. Is the market size provided in terms of value or volume?
The market size is provided in terms of value, measured in Million and volume, measured in K Unit.
11. Are there any specific market keywords associated with the report?
Yes, the market keyword associated with the report is "Veterinary Chemistry Analyzers Market," which aids in identifying and referencing the specific market segment covered.
12. How do I determine which pricing option suits my needs best?
The pricing options vary based on user requirements and access needs. Individual users may opt for single-user licenses, while businesses requiring broader access may choose multi-user or enterprise licenses for cost-effective access to the report.
13. Are there any additional resources or data provided in the Veterinary Chemistry Analyzers Market report?
While the report offers comprehensive insights, it's advisable to review the specific contents or supplementary materials provided to ascertain if additional resources or data are available.
14. How can I stay updated on further developments or reports in the Veterinary Chemistry Analyzers Market?
To stay informed about further developments, trends, and reports in the Veterinary Chemistry Analyzers Market, consider subscribing to industry newsletters, following relevant companies and organizations, or regularly checking reputable industry news sources and publications.
Methodology
Step 1 - Identification of Relevant Samples Size from Population Database


Step 2 - Approaches for Defining Global Market Size (Value, Volume* & Price*)

Note*: In applicable scenarios
Step 3 - Data Sources
Primary Research
- Web Analytics
- Survey Reports
- Research Institute
- Latest Research Reports
- Opinion Leaders
Secondary Research
- Annual Reports
- White Paper
- Latest Press Release
- Industry Association
- Paid Database
- Investor Presentations

Step 4 - Data Triangulation
Involves using different sources of information in order to increase the validity of a study
These sources are likely to be stakeholders in a program - participants, other researchers, program staff, other community members, and so on.
Then we put all data in single framework & apply various statistical tools to find out the dynamic on the market.
During the analysis stage, feedback from the stakeholder groups would be compared to determine areas of agreement as well as areas of divergence