
Key Insights
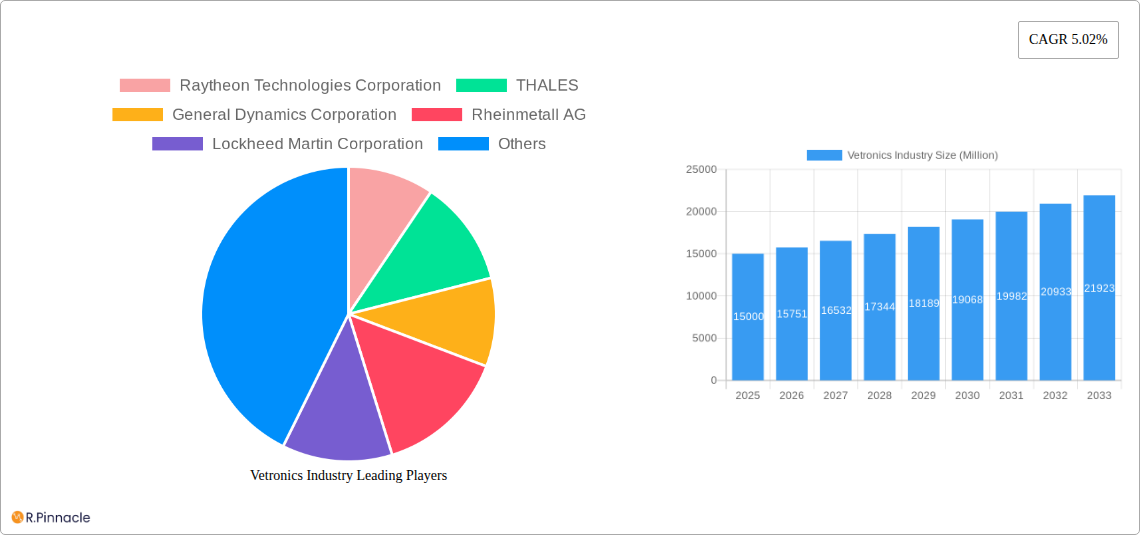
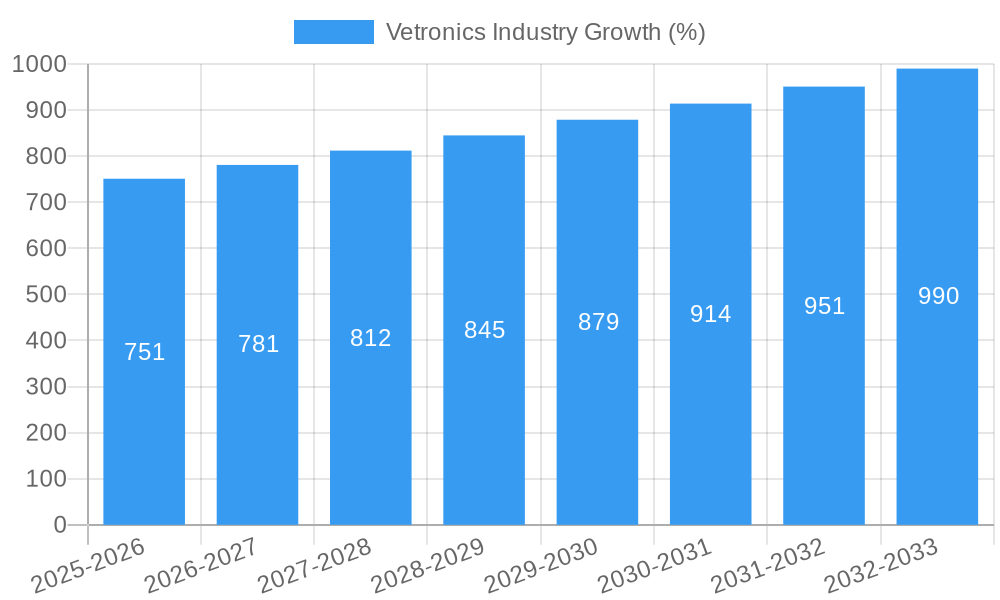
The global Vetronics market, encompassing integrated vehicle electronics systems for military vehicles, is experiencing robust growth, projected to reach a substantial size driven by increasing defense budgets globally and the modernization of armored fleets. The market's Compound Annual Growth Rate (CAGR) of 5.02% from 2019 to 2024 suggests a consistently expanding market, indicating a continued demand for advanced technologies enhancing battlefield awareness, situational understanding, and overall vehicle performance. Key drivers include the escalating demand for improved communication, navigation, and fire control systems, alongside the integration of advanced sensors and AI-powered functionalities. The integration of unmanned ground vehicles (UGVs) within military operations further fuels market expansion, creating a need for sophisticated vetronics solutions to manage and control these platforms. Significant technological advancements in areas like high-speed data processing, resilient communication networks, and miniaturized electronic components continue to propel market growth. Segmentation reveals a strong demand for vetronics in Main Battle Tanks (MBTs) and Light Armored Vehicles (LAVs), reflecting their crucial roles in modern warfare. While the market faces constraints like high initial investment costs and the complexities of integrating legacy systems with newer technologies, these challenges are being addressed through innovative system designs and collaborative industry efforts. The competition among key players, including Raytheon Technologies, Thales, General Dynamics, and others, fosters innovation and drives down costs, making vetronics solutions increasingly accessible.
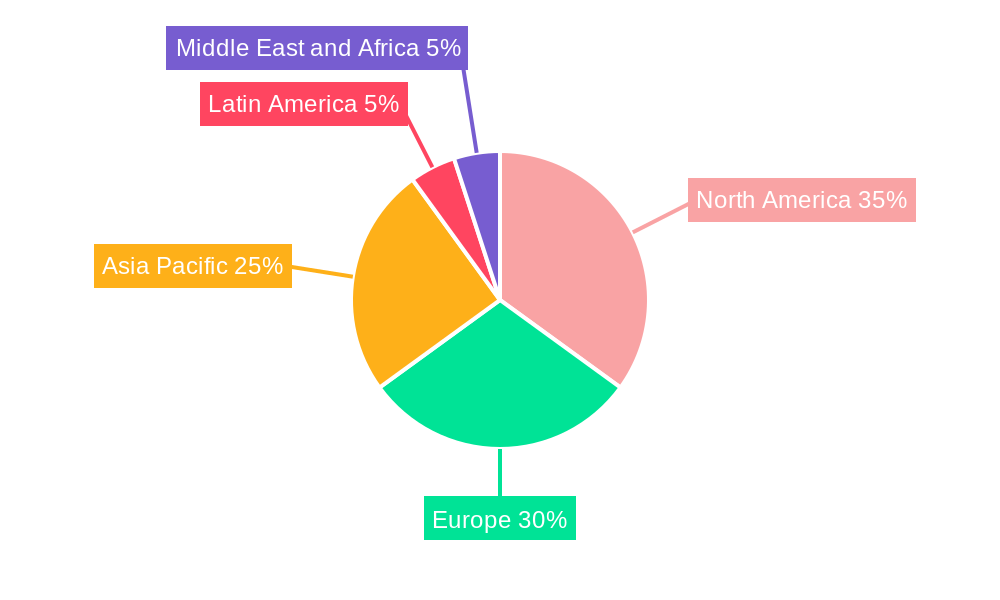
The geographical distribution of the market demonstrates strong regional variations. North America and Europe currently hold significant market shares due to established defense industries and substantial defense spending. However, the Asia-Pacific region is witnessing rapid growth, driven by significant military modernization initiatives in countries like India and China. This dynamic landscape presents lucrative opportunities for both established players and emerging technology providers. The forecast period of 2025-2033 indicates continued growth, with the market expected to be significantly larger than in 2025, propelled by ongoing technological advancements, increased defense spending, and geopolitical instability which drives modernization efforts in many regions. Specific sub-system segments like navigation and power systems are expected to experience particularly strong growth, reflecting the critical role these play in enhancing vehicle functionality and survivability. The market's future hinges on the continued development and integration of cutting-edge technologies to meet the evolving needs of modern warfare.
Vetronics Industry Market Report: 2019-2033
This comprehensive report provides an in-depth analysis of the Vetronics industry, projecting robust growth from USD xx Million in 2025 to USD xx Million by 2033. It covers market structure, innovation trends, dynamics, regional dominance, product innovations, and future outlook, offering actionable insights for industry professionals and investors. The study period spans 2019-2033, with 2025 as the base and estimated year.
Vetronics Industry Market Structure & Innovation Trends
The Vetronics market exhibits a moderately concentrated structure, with key players like Raytheon Technologies Corporation, Thales, General Dynamics Corporation, and Lockheed Martin Corporation holding significant market share. However, the presence of several smaller, specialized companies fosters innovation. Market share data for 2024 suggests Raytheon holds approximately 18%, Thales 15%, General Dynamics 12%, and Lockheed Martin 10%, with the remaining 45% distributed among other players. Innovation is driven by the demand for enhanced situational awareness, improved communication, and greater vehicle protection in military and defense applications. Stringent regulatory frameworks regarding cybersecurity and data protection influence product development. M&A activities have been moderate, with deal values totaling approximately USD xx Million in the past five years, primarily focused on consolidating smaller technology firms and expanding capabilities. Key innovation drivers include:
- Advancements in computing power and AI for enhanced situational awareness.
- Development of robust cybersecurity measures to protect sensitive data.
- Miniaturization and integration of multiple subsystems for improved vehicle performance.
- Integration of advanced sensor technologies for improved target acquisition and tracking.
Vetronics Industry Market Dynamics & Trends
The Vetronics market is experiencing robust growth, driven by increasing defense budgets globally, modernization of existing military fleets, and the demand for improved battlefield capabilities. The market is projected to witness a CAGR of xx% during the forecast period (2025-2033). This growth is further fueled by technological advancements, such as the integration of artificial intelligence (AI) and machine learning (ML) algorithms for improved decision-making and automation. Consumer preferences are increasingly focused on lighter, more energy-efficient, and easily maintainable vetronics systems. Competitive dynamics are characterized by intense R&D investment, strategic partnerships, and contract wins from major defense procurement agencies. Market penetration of advanced vetronics systems is growing rapidly, particularly in developed nations with strong defense capabilities, exceeding xx% in 2024.
Dominant Regions & Segments in Vetronics Industry
North America currently dominates the Vetronics market, driven by substantial defense spending and a robust technological base. Within this region, the United States accounts for the largest share due to its sizeable military budget and continuous modernization efforts.
Key Drivers for North American Dominance:
- High defense expenditure and proactive modernization of military assets.
- Strong technological infrastructure and innovation ecosystem.
- Presence of major defense contractors and technology providers.
Dominant Segments:
- Vehicle Type: Main Battle Tanks remain the largest segment due to their high integration of vetronics systems.
- Subsystem: Communication systems currently hold the largest share of the market because of the increased need for battlefield connectivity and information sharing.
The European market is the second-largest, driven by increased defense spending by several countries in response to geopolitical changes. Asia-Pacific is exhibiting significant growth potential due to increasing defense budgets and modernization of armed forces in several countries.
Vetronics Industry Product Innovations
Recent product innovations focus on enhancing situational awareness, improving communication capabilities, and increasing vehicle survivability. This includes the development of smaller, lighter, and more power-efficient systems, improved sensor integration, and the incorporation of AI and ML algorithms for enhanced decision-making. These innovations directly address the needs of modern warfare, providing a competitive advantage to manufacturers who can deliver superior performance and reliability. New applications extend to unmanned ground vehicles (UGVs) and other autonomous platforms, driving further market expansion.
Report Scope & Segmentation Analysis
This report segments the Vetronics market by vehicle type (Main Battle Tank, Light Armored Vehicle, Amphibious Armored Vehicle, Others), and subsystem (C, Navigation, Power). Each segment is analyzed based on historical data (2019-2024), market size in 2025, and growth projections (2025-2033). The report also analyzes competitive dynamics within each segment, highlighting key players and their market shares. Growth projections vary significantly depending on the segment, with Main Battle Tanks and Communication subsystems projecting the highest growth rates due to their critical role in modern warfare scenarios.
Key Drivers of Vetronics Industry Growth
Key growth drivers for the Vetronics industry include increasing defense budgets globally, the demand for enhanced situational awareness and improved communication systems in military operations, technological advancements in areas such as AI, miniaturization, and improved power efficiency. Government initiatives supporting the development and adoption of advanced military technologies further fuel this growth.
Challenges in the Vetronics Industry Sector
Challenges faced by the Vetronics industry include supply chain disruptions impacting the availability of critical components, intense competition among established players, and stringent regulatory requirements impacting product development and deployment. High development costs and the need for continuous technological upgrades also pose significant challenges. These factors result in potentially significant delays and increased costs for projects.
Emerging Opportunities in Vetronics Industry
Emerging opportunities include the integration of AI and ML into vetronics systems, the expanding market for unmanned vehicles (UGVs and autonomous platforms), and growing demand for enhanced cybersecurity measures. The increasing adoption of networked systems and the development of more energy-efficient systems also present attractive opportunities.
Leading Players in the Vetronics Industry Market
- Raytheon Technologies Corporation
- THALES
- General Dynamics Corporation
- Rheinmetall AG
- Lockheed Martin Corporation
- L3Harris Technologies Inc
- Leonardo S p A
- Curtiss-Wright Corporation
- BAE Systems plc
- Saab AB
Key Developments in Vetronics Industry Industry
- February 2023: USD 481.6 Million contract awarded to General Dynamics Mission Systems for AN/MLQ-44 Prophet-Enhanced SIGINT vetronics systems sustainment. This highlights the ongoing demand for upgrades and support of existing systems.
- July 2022: USD 280.1 Million contract awarded to General Dynamics Corporation for integrating active protection sensors onto M1A2 Abrams tanks. This signifies a significant investment in enhancing tank survivability.
Future Outlook for Vetronics Industry Market
The Vetronics market is poised for continued strong growth, driven by ongoing technological advancements, increasing defense spending globally, and the rising demand for advanced military capabilities. Strategic partnerships and investments in R&D will play a crucial role in shaping the future of the industry, with a focus on enhancing situational awareness, improving communication, and ensuring vehicle survivability in increasingly complex battlefield environments.
Vetronics Industry Segmentation
-
1. Vehicle Type
- 1.1. Main Battle Tank
- 1.2. Light Armored Vehicle
- 1.3. Amphibious Armored Vehicle
- 1.4. Other Ve
-
2. Subsystem
- 2.1. C4
- 2.2. Navigation
- 2.3. Power
Vetronics Industry Segmentation By Geography
-
1. North America
- 1.1. United States
- 1.2. Canada
-
2. Europe
- 2.1. Germany
- 2.2. United Kingdom
- 2.3. France
- 2.4. Russia
- 2.5. Rest of Europe
-
3. Asia Pacific
- 3.1. China
- 3.2. India
- 3.3. Japan
- 3.4. South Korea
- 3.5. Australia
- 3.6. Rest of Asia Pacific
-
4. Latin America
- 4.1. Brazil
- 4.2. Rest of Latin America
-
5. Middle East and Africa
- 5.1. United Arab Emirates
- 5.2. Saudi Arabia
- 5.3. Israel
- 5.4. Rest of Middle East and Africa
Vetronics Industry REPORT HIGHLIGHTS
| Aspects | Details |
|---|---|
| Study Period | 2019-2033 |
| Base Year | 2024 |
| Estimated Year | 2025 |
| Forecast Period | 2025-2033 |
| Historical Period | 2019-2024 |
| Growth Rate | CAGR of 5.02% from 2019-2033 |
| Segmentation |
|
Table of Contents
- 1. Introduction
- 1.1. Research Scope
- 1.2. Market Segmentation
- 1.3. Research Methodology
- 1.4. Definitions and Assumptions
- 2. Executive Summary
- 2.1. Introduction
- 3. Market Dynamics
- 3.1. Introduction
- 3.2. Market Drivers
- 3.3. Market Restrains
- 3.4. Market Trends
- 3.4.1. Light Armored Vehicles Segment is Estimated to Show Remarkable Growth During the Forecast Period
- 4. Market Factor Analysis
- 4.1. Porters Five Forces
- 4.2. Supply/Value Chain
- 4.3. PESTEL analysis
- 4.4. Market Entropy
- 4.5. Patent/Trademark Analysis
- 5. Global Vetronics Industry Analysis, Insights and Forecast, 2019-2031
- 5.1. Market Analysis, Insights and Forecast - by Vehicle Type
- 5.1.1. Main Battle Tank
- 5.1.2. Light Armored Vehicle
- 5.1.3. Amphibious Armored Vehicle
- 5.1.4. Other Ve
- 5.2. Market Analysis, Insights and Forecast - by Subsystem
- 5.2.1. C4
- 5.2.2. Navigation
- 5.2.3. Power
- 5.3. Market Analysis, Insights and Forecast - by Region
- 5.3.1. North America
- 5.3.2. Europe
- 5.3.3. Asia Pacific
- 5.3.4. Latin America
- 5.3.5. Middle East and Africa
- 5.1. Market Analysis, Insights and Forecast - by Vehicle Type
- 6. North America Vetronics Industry Analysis, Insights and Forecast, 2019-2031
- 6.1. Market Analysis, Insights and Forecast - by Vehicle Type
- 6.1.1. Main Battle Tank
- 6.1.2. Light Armored Vehicle
- 6.1.3. Amphibious Armored Vehicle
- 6.1.4. Other Ve
- 6.2. Market Analysis, Insights and Forecast - by Subsystem
- 6.2.1. C4
- 6.2.2. Navigation
- 6.2.3. Power
- 6.1. Market Analysis, Insights and Forecast - by Vehicle Type
- 7. Europe Vetronics Industry Analysis, Insights and Forecast, 2019-2031
- 7.1. Market Analysis, Insights and Forecast - by Vehicle Type
- 7.1.1. Main Battle Tank
- 7.1.2. Light Armored Vehicle
- 7.1.3. Amphibious Armored Vehicle
- 7.1.4. Other Ve
- 7.2. Market Analysis, Insights and Forecast - by Subsystem
- 7.2.1. C4
- 7.2.2. Navigation
- 7.2.3. Power
- 7.1. Market Analysis, Insights and Forecast - by Vehicle Type
- 8. Asia Pacific Vetronics Industry Analysis, Insights and Forecast, 2019-2031
- 8.1. Market Analysis, Insights and Forecast - by Vehicle Type
- 8.1.1. Main Battle Tank
- 8.1.2. Light Armored Vehicle
- 8.1.3. Amphibious Armored Vehicle
- 8.1.4. Other Ve
- 8.2. Market Analysis, Insights and Forecast - by Subsystem
- 8.2.1. C4
- 8.2.2. Navigation
- 8.2.3. Power
- 8.1. Market Analysis, Insights and Forecast - by Vehicle Type
- 9. Latin America Vetronics Industry Analysis, Insights and Forecast, 2019-2031
- 9.1. Market Analysis, Insights and Forecast - by Vehicle Type
- 9.1.1. Main Battle Tank
- 9.1.2. Light Armored Vehicle
- 9.1.3. Amphibious Armored Vehicle
- 9.1.4. Other Ve
- 9.2. Market Analysis, Insights and Forecast - by Subsystem
- 9.2.1. C4
- 9.2.2. Navigation
- 9.2.3. Power
- 9.1. Market Analysis, Insights and Forecast - by Vehicle Type
- 10. Middle East and Africa Vetronics Industry Analysis, Insights and Forecast, 2019-2031
- 10.1. Market Analysis, Insights and Forecast - by Vehicle Type
- 10.1.1. Main Battle Tank
- 10.1.2. Light Armored Vehicle
- 10.1.3. Amphibious Armored Vehicle
- 10.1.4. Other Ve
- 10.2. Market Analysis, Insights and Forecast - by Subsystem
- 10.2.1. C4
- 10.2.2. Navigation
- 10.2.3. Power
- 10.1. Market Analysis, Insights and Forecast - by Vehicle Type
- 11. North America Vetronics Industry Analysis, Insights and Forecast, 2019-2031
- 11.1. Market Analysis, Insights and Forecast - By Country/Sub-region
- 11.1.1 United States
- 11.1.2 Canada
- 12. Europe Vetronics Industry Analysis, Insights and Forecast, 2019-2031
- 12.1. Market Analysis, Insights and Forecast - By Country/Sub-region
- 12.1.1 Germany
- 12.1.2 United Kingdom
- 12.1.3 France
- 12.1.4 Russia
- 12.1.5 Rest of Europe
- 13. Asia Pacific Vetronics Industry Analysis, Insights and Forecast, 2019-2031
- 13.1. Market Analysis, Insights and Forecast - By Country/Sub-region
- 13.1.1 India
- 13.1.2 China
- 13.1.3 South Korea
- 13.1.4 Australia
- 13.1.5 Japan
- 13.1.6 Rest of Asia Pacific
- 14. Latin America Vetronics Industry Analysis, Insights and Forecast, 2019-2031
- 14.1. Market Analysis, Insights and Forecast - By Country/Sub-region
- 14.1.1 Brazil
- 14.1.2 Rest of Latin America
- 15. Middle East and Africa Vetronics Industry Analysis, Insights and Forecast, 2019-2031
- 15.1. Market Analysis, Insights and Forecast - By Country/Sub-region
- 15.1.1 United Arab Emirates
- 15.1.2 Saudi Arabia
- 15.1.3 Israel
- 15.1.4 Rest of Middle East and Africa
- 16. Competitive Analysis
- 16.1. Global Market Share Analysis 2024
- 16.2. Company Profiles
- 16.2.1 Raytheon Technologies Corporation
- 16.2.1.1. Overview
- 16.2.1.2. Products
- 16.2.1.3. SWOT Analysis
- 16.2.1.4. Recent Developments
- 16.2.1.5. Financials (Based on Availability)
- 16.2.2 THALES
- 16.2.2.1. Overview
- 16.2.2.2. Products
- 16.2.2.3. SWOT Analysis
- 16.2.2.4. Recent Developments
- 16.2.2.5. Financials (Based on Availability)
- 16.2.3 General Dynamics Corporation
- 16.2.3.1. Overview
- 16.2.3.2. Products
- 16.2.3.3. SWOT Analysis
- 16.2.3.4. Recent Developments
- 16.2.3.5. Financials (Based on Availability)
- 16.2.4 Rheinmetall AG
- 16.2.4.1. Overview
- 16.2.4.2. Products
- 16.2.4.3. SWOT Analysis
- 16.2.4.4. Recent Developments
- 16.2.4.5. Financials (Based on Availability)
- 16.2.5 Lockheed Martin Corporation
- 16.2.5.1. Overview
- 16.2.5.2. Products
- 16.2.5.3. SWOT Analysis
- 16.2.5.4. Recent Developments
- 16.2.5.5. Financials (Based on Availability)
- 16.2.6 L3Harris Technologies Inc
- 16.2.6.1. Overview
- 16.2.6.2. Products
- 16.2.6.3. SWOT Analysis
- 16.2.6.4. Recent Developments
- 16.2.6.5. Financials (Based on Availability)
- 16.2.7 Leonardo S p A
- 16.2.7.1. Overview
- 16.2.7.2. Products
- 16.2.7.3. SWOT Analysis
- 16.2.7.4. Recent Developments
- 16.2.7.5. Financials (Based on Availability)
- 16.2.8 Curtiss-Wright Corporation
- 16.2.8.1. Overview
- 16.2.8.2. Products
- 16.2.8.3. SWOT Analysis
- 16.2.8.4. Recent Developments
- 16.2.8.5. Financials (Based on Availability)
- 16.2.9 BAE Systems plc
- 16.2.9.1. Overview
- 16.2.9.2. Products
- 16.2.9.3. SWOT Analysis
- 16.2.9.4. Recent Developments
- 16.2.9.5. Financials (Based on Availability)
- 16.2.10 Saab AB
- 16.2.10.1. Overview
- 16.2.10.2. Products
- 16.2.10.3. SWOT Analysis
- 16.2.10.4. Recent Developments
- 16.2.10.5. Financials (Based on Availability)
- 16.2.1 Raytheon Technologies Corporation
List of Figures
- Figure 1: Global Vetronics Industry Revenue Breakdown (Million, %) by Region 2024 & 2032
- Figure 2: North America Vetronics Industry Revenue (Million), by Country 2024 & 2032
- Figure 3: North America Vetronics Industry Revenue Share (%), by Country 2024 & 2032
- Figure 4: Europe Vetronics Industry Revenue (Million), by Country 2024 & 2032
- Figure 5: Europe Vetronics Industry Revenue Share (%), by Country 2024 & 2032
- Figure 6: Asia Pacific Vetronics Industry Revenue (Million), by Country 2024 & 2032
- Figure 7: Asia Pacific Vetronics Industry Revenue Share (%), by Country 2024 & 2032
- Figure 8: Latin America Vetronics Industry Revenue (Million), by Country 2024 & 2032
- Figure 9: Latin America Vetronics Industry Revenue Share (%), by Country 2024 & 2032
- Figure 10: Middle East and Africa Vetronics Industry Revenue (Million), by Country 2024 & 2032
- Figure 11: Middle East and Africa Vetronics Industry Revenue Share (%), by Country 2024 & 2032
- Figure 12: North America Vetronics Industry Revenue (Million), by Vehicle Type 2024 & 2032
- Figure 13: North America Vetronics Industry Revenue Share (%), by Vehicle Type 2024 & 2032
- Figure 14: North America Vetronics Industry Revenue (Million), by Subsystem 2024 & 2032
- Figure 15: North America Vetronics Industry Revenue Share (%), by Subsystem 2024 & 2032
- Figure 16: North America Vetronics Industry Revenue (Million), by Country 2024 & 2032
- Figure 17: North America Vetronics Industry Revenue Share (%), by Country 2024 & 2032
- Figure 18: Europe Vetronics Industry Revenue (Million), by Vehicle Type 2024 & 2032
- Figure 19: Europe Vetronics Industry Revenue Share (%), by Vehicle Type 2024 & 2032
- Figure 20: Europe Vetronics Industry Revenue (Million), by Subsystem 2024 & 2032
- Figure 21: Europe Vetronics Industry Revenue Share (%), by Subsystem 2024 & 2032
- Figure 22: Europe Vetronics Industry Revenue (Million), by Country 2024 & 2032
- Figure 23: Europe Vetronics Industry Revenue Share (%), by Country 2024 & 2032
- Figure 24: Asia Pacific Vetronics Industry Revenue (Million), by Vehicle Type 2024 & 2032
- Figure 25: Asia Pacific Vetronics Industry Revenue Share (%), by Vehicle Type 2024 & 2032
- Figure 26: Asia Pacific Vetronics Industry Revenue (Million), by Subsystem 2024 & 2032
- Figure 27: Asia Pacific Vetronics Industry Revenue Share (%), by Subsystem 2024 & 2032
- Figure 28: Asia Pacific Vetronics Industry Revenue (Million), by Country 2024 & 2032
- Figure 29: Asia Pacific Vetronics Industry Revenue Share (%), by Country 2024 & 2032
- Figure 30: Latin America Vetronics Industry Revenue (Million), by Vehicle Type 2024 & 2032
- Figure 31: Latin America Vetronics Industry Revenue Share (%), by Vehicle Type 2024 & 2032
- Figure 32: Latin America Vetronics Industry Revenue (Million), by Subsystem 2024 & 2032
- Figure 33: Latin America Vetronics Industry Revenue Share (%), by Subsystem 2024 & 2032
- Figure 34: Latin America Vetronics Industry Revenue (Million), by Country 2024 & 2032
- Figure 35: Latin America Vetronics Industry Revenue Share (%), by Country 2024 & 2032
- Figure 36: Middle East and Africa Vetronics Industry Revenue (Million), by Vehicle Type 2024 & 2032
- Figure 37: Middle East and Africa Vetronics Industry Revenue Share (%), by Vehicle Type 2024 & 2032
- Figure 38: Middle East and Africa Vetronics Industry Revenue (Million), by Subsystem 2024 & 2032
- Figure 39: Middle East and Africa Vetronics Industry Revenue Share (%), by Subsystem 2024 & 2032
- Figure 40: Middle East and Africa Vetronics Industry Revenue (Million), by Country 2024 & 2032
- Figure 41: Middle East and Africa Vetronics Industry Revenue Share (%), by Country 2024 & 2032
List of Tables
- Table 1: Global Vetronics Industry Revenue Million Forecast, by Region 2019 & 2032
- Table 2: Global Vetronics Industry Revenue Million Forecast, by Vehicle Type 2019 & 2032
- Table 3: Global Vetronics Industry Revenue Million Forecast, by Subsystem 2019 & 2032
- Table 4: Global Vetronics Industry Revenue Million Forecast, by Region 2019 & 2032
- Table 5: Global Vetronics Industry Revenue Million Forecast, by Country 2019 & 2032
- Table 6: United States Vetronics Industry Revenue (Million) Forecast, by Application 2019 & 2032
- Table 7: Canada Vetronics Industry Revenue (Million) Forecast, by Application 2019 & 2032
- Table 8: Global Vetronics Industry Revenue Million Forecast, by Country 2019 & 2032
- Table 9: Germany Vetronics Industry Revenue (Million) Forecast, by Application 2019 & 2032
- Table 10: United Kingdom Vetronics Industry Revenue (Million) Forecast, by Application 2019 & 2032
- Table 11: France Vetronics Industry Revenue (Million) Forecast, by Application 2019 & 2032
- Table 12: Russia Vetronics Industry Revenue (Million) Forecast, by Application 2019 & 2032
- Table 13: Rest of Europe Vetronics Industry Revenue (Million) Forecast, by Application 2019 & 2032
- Table 14: Global Vetronics Industry Revenue Million Forecast, by Country 2019 & 2032
- Table 15: India Vetronics Industry Revenue (Million) Forecast, by Application 2019 & 2032
- Table 16: China Vetronics Industry Revenue (Million) Forecast, by Application 2019 & 2032
- Table 17: South Korea Vetronics Industry Revenue (Million) Forecast, by Application 2019 & 2032
- Table 18: Australia Vetronics Industry Revenue (Million) Forecast, by Application 2019 & 2032
- Table 19: Japan Vetronics Industry Revenue (Million) Forecast, by Application 2019 & 2032
- Table 20: Rest of Asia Pacific Vetronics Industry Revenue (Million) Forecast, by Application 2019 & 2032
- Table 21: Global Vetronics Industry Revenue Million Forecast, by Country 2019 & 2032
- Table 22: Brazil Vetronics Industry Revenue (Million) Forecast, by Application 2019 & 2032
- Table 23: Rest of Latin America Vetronics Industry Revenue (Million) Forecast, by Application 2019 & 2032
- Table 24: Global Vetronics Industry Revenue Million Forecast, by Country 2019 & 2032
- Table 25: United Arab Emirates Vetronics Industry Revenue (Million) Forecast, by Application 2019 & 2032
- Table 26: Saudi Arabia Vetronics Industry Revenue (Million) Forecast, by Application 2019 & 2032
- Table 27: Israel Vetronics Industry Revenue (Million) Forecast, by Application 2019 & 2032
- Table 28: Rest of Middle East and Africa Vetronics Industry Revenue (Million) Forecast, by Application 2019 & 2032
- Table 29: Global Vetronics Industry Revenue Million Forecast, by Vehicle Type 2019 & 2032
- Table 30: Global Vetronics Industry Revenue Million Forecast, by Subsystem 2019 & 2032
- Table 31: Global Vetronics Industry Revenue Million Forecast, by Country 2019 & 2032
- Table 32: United States Vetronics Industry Revenue (Million) Forecast, by Application 2019 & 2032
- Table 33: Canada Vetronics Industry Revenue (Million) Forecast, by Application 2019 & 2032
- Table 34: Global Vetronics Industry Revenue Million Forecast, by Vehicle Type 2019 & 2032
- Table 35: Global Vetronics Industry Revenue Million Forecast, by Subsystem 2019 & 2032
- Table 36: Global Vetronics Industry Revenue Million Forecast, by Country 2019 & 2032
- Table 37: Germany Vetronics Industry Revenue (Million) Forecast, by Application 2019 & 2032
- Table 38: United Kingdom Vetronics Industry Revenue (Million) Forecast, by Application 2019 & 2032
- Table 39: France Vetronics Industry Revenue (Million) Forecast, by Application 2019 & 2032
- Table 40: Russia Vetronics Industry Revenue (Million) Forecast, by Application 2019 & 2032
- Table 41: Rest of Europe Vetronics Industry Revenue (Million) Forecast, by Application 2019 & 2032
- Table 42: Global Vetronics Industry Revenue Million Forecast, by Vehicle Type 2019 & 2032
- Table 43: Global Vetronics Industry Revenue Million Forecast, by Subsystem 2019 & 2032
- Table 44: Global Vetronics Industry Revenue Million Forecast, by Country 2019 & 2032
- Table 45: China Vetronics Industry Revenue (Million) Forecast, by Application 2019 & 2032
- Table 46: India Vetronics Industry Revenue (Million) Forecast, by Application 2019 & 2032
- Table 47: Japan Vetronics Industry Revenue (Million) Forecast, by Application 2019 & 2032
- Table 48: South Korea Vetronics Industry Revenue (Million) Forecast, by Application 2019 & 2032
- Table 49: Australia Vetronics Industry Revenue (Million) Forecast, by Application 2019 & 2032
- Table 50: Rest of Asia Pacific Vetronics Industry Revenue (Million) Forecast, by Application 2019 & 2032
- Table 51: Global Vetronics Industry Revenue Million Forecast, by Vehicle Type 2019 & 2032
- Table 52: Global Vetronics Industry Revenue Million Forecast, by Subsystem 2019 & 2032
- Table 53: Global Vetronics Industry Revenue Million Forecast, by Country 2019 & 2032
- Table 54: Brazil Vetronics Industry Revenue (Million) Forecast, by Application 2019 & 2032
- Table 55: Rest of Latin America Vetronics Industry Revenue (Million) Forecast, by Application 2019 & 2032
- Table 56: Global Vetronics Industry Revenue Million Forecast, by Vehicle Type 2019 & 2032
- Table 57: Global Vetronics Industry Revenue Million Forecast, by Subsystem 2019 & 2032
- Table 58: Global Vetronics Industry Revenue Million Forecast, by Country 2019 & 2032
- Table 59: United Arab Emirates Vetronics Industry Revenue (Million) Forecast, by Application 2019 & 2032
- Table 60: Saudi Arabia Vetronics Industry Revenue (Million) Forecast, by Application 2019 & 2032
- Table 61: Israel Vetronics Industry Revenue (Million) Forecast, by Application 2019 & 2032
- Table 62: Rest of Middle East and Africa Vetronics Industry Revenue (Million) Forecast, by Application 2019 & 2032
Frequently Asked Questions
1. What is the projected Compound Annual Growth Rate (CAGR) of the Vetronics Industry?
The projected CAGR is approximately 5.02%.
2. Which companies are prominent players in the Vetronics Industry?
Key companies in the market include Raytheon Technologies Corporation, THALES, General Dynamics Corporation, Rheinmetall AG, Lockheed Martin Corporation, L3Harris Technologies Inc, Leonardo S p A, Curtiss-Wright Corporation, BAE Systems plc, Saab AB.
3. What are the main segments of the Vetronics Industry?
The market segments include Vehicle Type, Subsystem.
4. Can you provide details about the market size?
The market size is estimated to be USD XX Million as of 2022.
5. What are some drivers contributing to market growth?
N/A
6. What are the notable trends driving market growth?
Light Armored Vehicles Segment is Estimated to Show Remarkable Growth During the Forecast Period.
7. Are there any restraints impacting market growth?
N/A
8. Can you provide examples of recent developments in the market?
In February 2023, the US Army Contracting Command announced a USD 481.6 million contract to the General Dynamics Mission Systems segment to sustain the AN/MLQ-44 Prophet-Enhanced SIGINT vetronics systems.
9. What pricing options are available for accessing the report?
Pricing options include single-user, multi-user, and enterprise licenses priced at USD 4750, USD 5250, and USD 8750 respectively.
10. Is the market size provided in terms of value or volume?
The market size is provided in terms of value, measured in Million.
11. Are there any specific market keywords associated with the report?
Yes, the market keyword associated with the report is "Vetronics Industry," which aids in identifying and referencing the specific market segment covered.
12. How do I determine which pricing option suits my needs best?
The pricing options vary based on user requirements and access needs. Individual users may opt for single-user licenses, while businesses requiring broader access may choose multi-user or enterprise licenses for cost-effective access to the report.
13. Are there any additional resources or data provided in the Vetronics Industry report?
While the report offers comprehensive insights, it's advisable to review the specific contents or supplementary materials provided to ascertain if additional resources or data are available.
14. How can I stay updated on further developments or reports in the Vetronics Industry?
To stay informed about further developments, trends, and reports in the Vetronics Industry, consider subscribing to industry newsletters, following relevant companies and organizations, or regularly checking reputable industry news sources and publications.
Methodology
Step 1 - Identification of Relevant Samples Size from Population Database


Step 2 - Approaches for Defining Global Market Size (Value, Volume* & Price*)

Note*: In applicable scenarios
Step 3 - Data Sources
Primary Research
- Web Analytics
- Survey Reports
- Research Institute
- Latest Research Reports
- Opinion Leaders
Secondary Research
- Annual Reports
- White Paper
- Latest Press Release
- Industry Association
- Paid Database
- Investor Presentations

Step 4 - Data Triangulation
Involves using different sources of information in order to increase the validity of a study
These sources are likely to be stakeholders in a program - participants, other researchers, program staff, other community members, and so on.
Then we put all data in single framework & apply various statistical tools to find out the dynamic on the market.
During the analysis stage, feedback from the stakeholder groups would be compared to determine areas of agreement as well as areas of divergence


