

Key Insights
The global vial adaptors for drug reconstitution market, valued at approximately 1.5 billion in 2024, is projected for significant expansion. Expected to grow at a compound annual growth rate (CAGR) of 6.2% from 2024 to 2033, this market's growth is underpinned by several critical drivers. The rising incidence of chronic diseases, including autoimmune disorders, infectious diseases, and metabolic conditions, is escalating the demand for injectable pharmaceuticals, consequently boosting the need for safe and efficient vial adaptors. Technological innovations are also key, with advancements in adaptor design, enhanced material science (such as the integration of durable and biocompatible materials like polycarbonate and silicon), and the increasing adoption of single-use systems contributing to market expansion. Furthermore, stringent regulatory frameworks governing drug delivery and patient safety are encouraging the adoption of high-quality, standardized adaptors. Potential challenges include significant initial investment for advanced technologies and susceptibility to supply chain volatility.
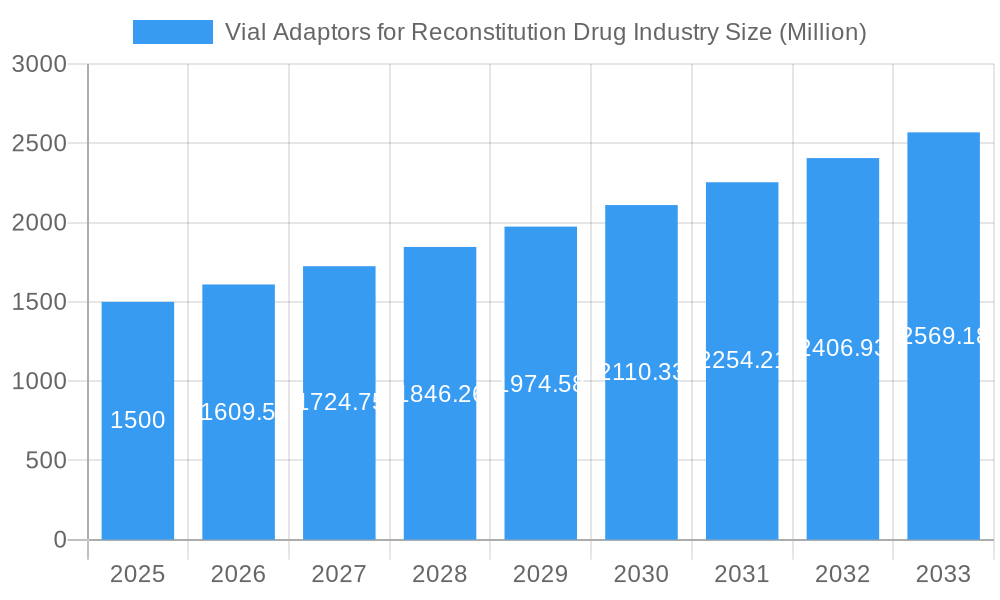
Vial Adaptors for Reconstitution Drug Industry Market Size (In Billion)
The market demonstrates diverse segmentation. Within the material segment, polycarbonate and silicon adaptors currently lead due to their inherent superior properties. The therapeutic area segmentation spans autoimmune diseases, infectious diseases, and metabolic conditions, with consistent growth anticipated across all categories, driven by the global increase in these prevalent conditions. Geographically, North America and Europe represent substantial market share, supported by advanced healthcare infrastructure and high adoption of sophisticated drug delivery systems. However, the Asia-Pacific region is forecasted for considerable growth, propelled by rising disposable incomes, increasing healthcare investments, and a rapidly expanding pharmaceutical sector. Leading market participants, including Becton Dickinson and West Pharmaceutical Services, are strategically focusing on research and development, mergers and acquisitions, and global expansion to leverage emerging market opportunities.
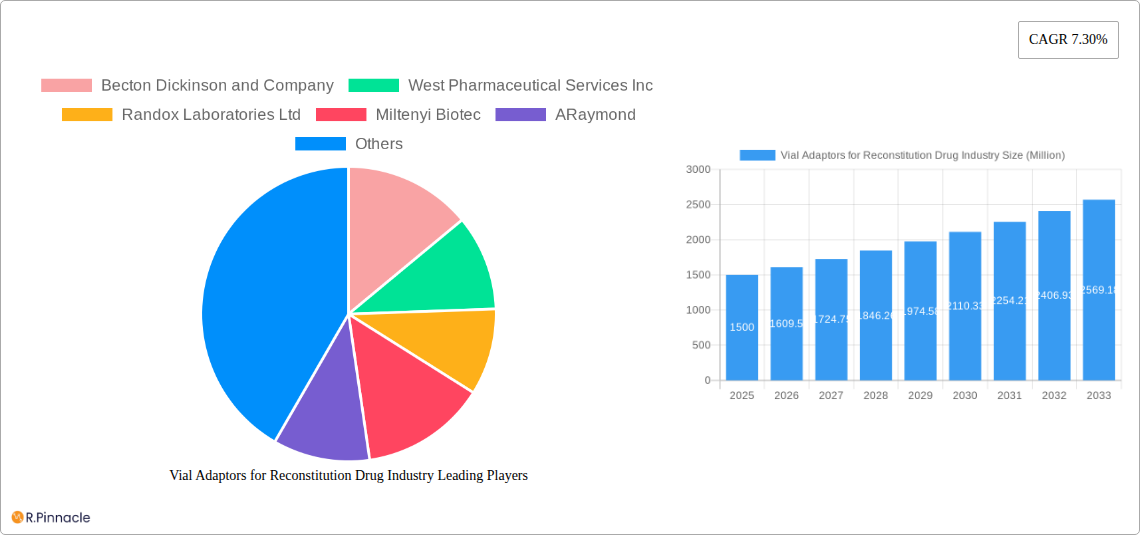
Vial Adaptors for Reconstitution Drug Industry Company Market Share
Vial Adaptors for Reconstitution Drug Industry: A Comprehensive Market Report (2019-2033)
This comprehensive report provides an in-depth analysis of the Vial Adaptors for Reconstitution Drug Industry, offering valuable insights for industry professionals, investors, and strategic decision-makers. The report covers the period from 2019 to 2033, with a focus on the 2025-2033 forecast period. The global market size is projected to reach xx Million by 2033.
Vial Adaptors for Reconstitution Drug Industry Market Structure & Innovation Trends
The Vial Adaptors for Reconstitution market is characterized by a moderately concentrated structure, with key players like Becton Dickinson and Company, West Pharmaceutical Services Inc, and Thermo Fisher Scientific holding significant market share. The exact market share for each company in 2025 is estimated at: BD (xx%), West (xx%), Thermo Fisher (xx%), with remaining players sharing the rest. Innovation is driven by the need for improved sterility, ease of use, and compatibility with various drug formulations. Regulatory frameworks, such as those set by the FDA and EMA, heavily influence product design and manufacturing processes. Substitutes, while limited, include specialized syringes and other drug delivery systems. End-users predominantly comprise pharmaceutical manufacturers and contract manufacturing organizations (CMOs).
Several significant M&A activities have shaped the market landscape. While precise deal values are often confidential, observable trends show increasing consolidation in the sector. For example, the collaboration between Sartorius and BICO Group (Dec 2022) signals a strategic shift towards integrating advanced technologies. Furthermore, Miltenyi Biotec's expansion (Dec 2021) indicates an aggressive growth strategy within the industry.
Vial Adaptors for Reconstitution Drug Industry Market Dynamics & Trends
The Vial Adaptors for Reconstitution market is experiencing robust growth, driven by several key factors. The increasing prevalence of chronic diseases, such as autoimmune diseases, infectious diseases, and metabolic conditions, fuels demand for injectable medications, consequently boosting the demand for vial adaptors. Technological advancements, including the development of novel materials and improved designs for enhanced sterility and ease of use, are further accelerating market expansion. Consumer preferences are shifting toward more convenient and user-friendly drug delivery systems, driving innovation in adaptor design. The competitive landscape is marked by intense rivalry among established players and emerging companies, leading to continuous product development and price competition. The CAGR for the forecast period (2025-2033) is projected to be xx%, with market penetration expected to reach xx% by 2033.
Dominant Regions & Segments in Vial Adaptors for Reconstitution Drug Industry
North America currently dominates the vial adaptors market, driven by strong pharmaceutical R&D investment and a large number of established pharmaceutical companies. Europe follows closely, while Asia-Pacific is expected to exhibit the highest growth rate in the coming years.
Key Drivers by Region:
- North America: Robust pharmaceutical industry, stringent regulatory environment, high healthcare expenditure.
- Europe: Well-established healthcare infrastructure, high adoption of advanced technologies, increasing prevalence of chronic diseases.
- Asia-Pacific: Rapidly expanding pharmaceutical market, increasing disposable incomes, rising healthcare awareness.
Dominant Segments:
- Material: Polycarbonate holds a significant market share due to its cost-effectiveness and suitable properties. Silicon is preferred for its biocompatibility, while polyethylene offers flexibility. Other materials, including specialized polymers, cater to niche applications.
- Therapeutic Area: Autoimmune diseases, infectious diseases, and metabolic conditions collectively represent a considerable market segment, mirroring the high prevalence of these conditions globally.
Vial Adaptors for Reconstitution Drug Industry Product Innovations
Recent innovations focus on improving sterility, reducing drug waste, and enhancing user experience. This includes the development of single-use adaptors, pre-filled adaptors, and adaptors designed for specific drug formulations. These innovations are crucial for ensuring patient safety and efficacy, aligning with the growing demand for advanced drug delivery systems. The market trend reflects a shift towards personalized medicine, requiring more sophisticated and adaptable vial adaptors to cater to specific treatment needs.
Report Scope & Segmentation Analysis
This report segments the Vial Adaptors for Reconstitution market by material (Polycarbonate, Silicon, Polyethylene, Other Materials) and therapeutic area (Autoimmune Diseases, Infectious Diseases, Metabolic Conditions, Other Therapeutic Areas). Each segment is analyzed based on market size, growth rate, and competitive dynamics. Growth projections indicate significant expansion across all segments, though the rate varies depending on technological advancements and evolving regulatory landscapes. Polycarbonate is expected to maintain market dominance due to its balance of cost and performance, whereas the therapeutic segments show growth correlated with disease prevalence and treatment advancements.
Key Drivers of Vial Adaptors for Reconstitution Drug Industry Growth
Several key factors drive market growth, including increasing demand for injectable drugs, technological advancements in adaptor design and materials, and stringent regulatory requirements for sterility and safety. Furthermore, the rising prevalence of chronic diseases globally, combined with the continuous research and development in novel drug delivery systems, fuels the growth of this sector. Government initiatives promoting advancements in drug delivery also play a crucial role.
Challenges in the Vial Adaptors for Reconstitution Drug Industry Sector
The industry faces challenges such as stringent regulatory approvals, which can increase time and costs associated with product development and launch. Maintaining consistent supply chain operations is also vital, considering that disruptions can lead to production delays and stock shortages, potentially impacting revenue and market share. Competitive pressure among numerous market players necessitates continuous innovation and cost optimization for sustained success. The projected impact of these challenges on market growth is estimated at xx Million in revenue loss annually.
Emerging Opportunities in Vial Adaptors for Reconstitution Drug Industry
Emerging opportunities lie in the development of biocompatible and biodegradable materials, personalized drug delivery systems, and innovative adaptor designs for efficient drug reconstitution. Expanding into emerging markets, particularly in developing economies, represents a significant growth potential. Moreover, collaborations with pharmaceutical companies to integrate vial adaptors into complete drug delivery solutions offer new avenues for expansion and revenue generation.
Leading Players in the Vial Adaptors for Reconstitution Drug Industry Market
- Becton Dickinson and Company
- West Pharmaceutical Services Inc
- Randox Laboratories Ltd
- Miltenyi Biotec
- ARaymond
- Stevanato Group
- Sartorius AG
- Baxter International Inc
- B Braun SE
- Thermo Fisher Scientific
- Simplivia
- Agilent Technologies
Key Developments in Vial Adaptors for Reconstitution Drug Industry Industry
- Dec 2022: Sartorius and BICO Group announced a technology, sales, and marketing cooperation, potentially leading to innovative vial adaptor solutions.
- Dec 2021: Miltenyi Biotec expanded its production capacity, signaling increased market competitiveness and potential for higher production volumes.
Future Outlook for Vial Adaptors for Reconstitution Drug Industry Market
The future outlook for the vial adaptors market is positive, driven by sustained growth in the pharmaceutical industry, advancements in drug delivery technologies, and increasing demand for convenient and safe drug administration methods. Strategic partnerships, investments in R&D, and expansion into new geographical markets will play a key role in shaping the industry's trajectory over the next decade. The market is poised for further consolidation and technological advancements, potentially leading to innovative products and services that meet the evolving needs of healthcare providers and patients.
Vial Adaptors for Reconstitution Drug Industry Segmentation
-
1. Material
- 1.1. Polycarbonate
- 1.2. Silicon
- 1.3. Polyethylene
- 1.4. Other Materials
-
2. Therapeutic Area
- 2.1. Autoimmune Diseases
- 2.2. Infectious Diseases
- 2.3. Metabolic Conditions
- 2.4. Other Therapeutic Areas
Vial Adaptors for Reconstitution Drug Industry Segmentation By Geography
-
1. North America
- 1.1. United States
- 1.2. Canada
- 1.3. Mexico
-
2. Europe
- 2.1. Germany
- 2.2. United Kingdom
- 2.3. France
- 2.4. Italy
- 2.5. Spain
- 2.6. Rest of Europe
-
3. Asia Pacific
- 3.1. China
- 3.2. Japan
- 3.3. India
- 3.4. Australia
- 3.5. South Korea
- 3.6. Rest of Asia Pacific
-
4. Middle East and Africa
- 4.1. GCC
- 4.2. South Africa
- 4.3. Rest of Middle East and Africa
-
5. South America
- 5.1. Brazil
- 5.2. Argentina
- 5.3. Rest of South America
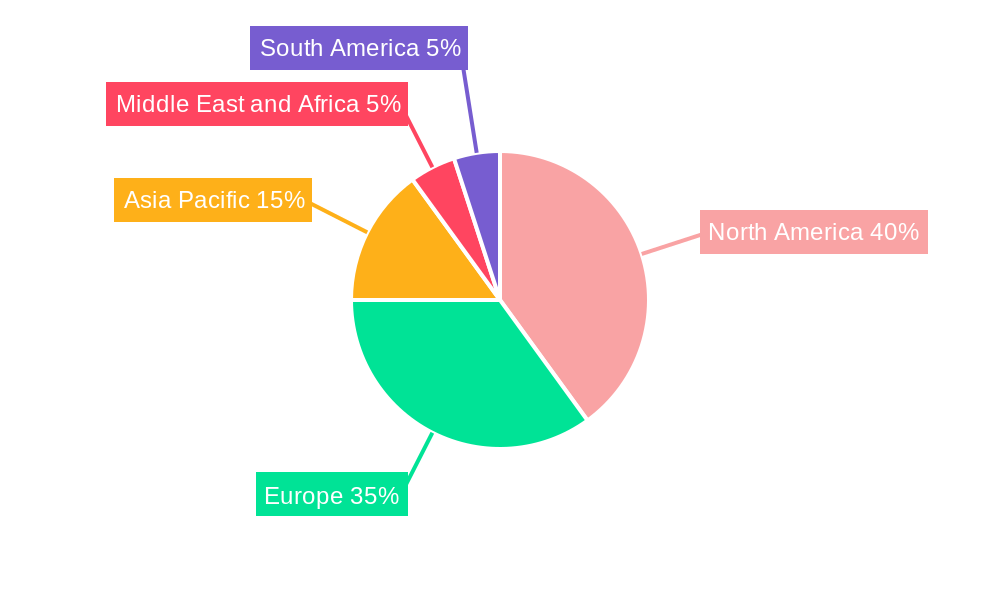
Vial Adaptors for Reconstitution Drug Industry Regional Market Share
Geographic Coverage of Vial Adaptors for Reconstitution Drug Industry
Vial Adaptors for Reconstitution Drug Industry REPORT HIGHLIGHTS
| Aspects | Details |
|---|---|
| Study Period | 2020-2034 |
| Base Year | 2025 |
| Estimated Year | 2026 |
| Forecast Period | 2026-2034 |
| Historical Period | 2020-2025 |
| Growth Rate | CAGR of 6.2% from 2020-2034 |
| Segmentation |
|
Table of Contents
- 1. Introduction
- 1.1. Research Scope
- 1.2. Market Segmentation
- 1.3. Research Objective
- 1.4. Definitions and Assumptions
- 2. Executive Summary
- 2.1. Market Snapshot
- 3. Market Dynamics
- 3.1. Market Drivers
- 3.2. Market Restrains
- 3.3. Market Trends
- 3.4. Market Opportunities
- 4. Market Factor Analysis
- 4.1. Porters Five Forces
- 4.1.1. Bargaining Power of Suppliers
- 4.1.2. Bargaining Power of Buyers
- 4.1.3. Threat of New Entrants
- 4.1.4. Threat of Substitutes
- 4.1.5. Competitive Rivalry
- 4.2. PESTEL analysis
- 4.3. BCG Analysis
- 4.3.1. Stars (High Growth, High Market Share)
- 4.3.2. Cash Cows (Low Growth, High Market Share)
- 4.3.3. Question Mark (High Growth, Low Market Share)
- 4.3.4. Dogs (Low Growth, Low Market Share)
- 4.4. Ansoff Matrix Analysis
- 4.5. Supply Chain Analysis
- 4.6. Regulatory Landscape
- 4.7. Current Market Potential and Opportunity Assessment (TAM–SAM–SOM Framework)
- 4.8. PRI Analyst Note
- 4.1. Porters Five Forces
- 5. Market Analysis, Insights and Forecast 2021-2033
- 5.1. Market Analysis, Insights and Forecast - by Material
- 5.1.1. Polycarbonate
- 5.1.2. Silicon
- 5.1.3. Polyethylene
- 5.1.4. Other Materials
- 5.2. Market Analysis, Insights and Forecast - by Therapeutic Area
- 5.2.1. Autoimmune Diseases
- 5.2.2. Infectious Diseases
- 5.2.3. Metabolic Conditions
- 5.2.4. Other Therapeutic Areas
- 5.3. Market Analysis, Insights and Forecast - by Region
- 5.3.1. North America
- 5.3.2. Europe
- 5.3.3. Asia Pacific
- 5.3.4. Middle East and Africa
- 5.3.5. South America
- 5.1. Market Analysis, Insights and Forecast - by Material
- 6. Global Vial Adaptors for Reconstitution Drug Industry Analysis, Insights and Forecast, 2021-2033
- 6.1. Market Analysis, Insights and Forecast - by Material
- 6.1.1. Polycarbonate
- 6.1.2. Silicon
- 6.1.3. Polyethylene
- 6.1.4. Other Materials
- 6.2. Market Analysis, Insights and Forecast - by Therapeutic Area
- 6.2.1. Autoimmune Diseases
- 6.2.2. Infectious Diseases
- 6.2.3. Metabolic Conditions
- 6.2.4. Other Therapeutic Areas
- 6.1. Market Analysis, Insights and Forecast - by Material
- 7. North America Vial Adaptors for Reconstitution Drug Industry Analysis, Insights and Forecast, 2020-2032
- 7.1. Market Analysis, Insights and Forecast - by Material
- 7.1.1. Polycarbonate
- 7.1.2. Silicon
- 7.1.3. Polyethylene
- 7.1.4. Other Materials
- 7.2. Market Analysis, Insights and Forecast - by Therapeutic Area
- 7.2.1. Autoimmune Diseases
- 7.2.2. Infectious Diseases
- 7.2.3. Metabolic Conditions
- 7.2.4. Other Therapeutic Areas
- 7.1. Market Analysis, Insights and Forecast - by Material
- 8. Europe Vial Adaptors for Reconstitution Drug Industry Analysis, Insights and Forecast, 2020-2032
- 8.1. Market Analysis, Insights and Forecast - by Material
- 8.1.1. Polycarbonate
- 8.1.2. Silicon
- 8.1.3. Polyethylene
- 8.1.4. Other Materials
- 8.2. Market Analysis, Insights and Forecast - by Therapeutic Area
- 8.2.1. Autoimmune Diseases
- 8.2.2. Infectious Diseases
- 8.2.3. Metabolic Conditions
- 8.2.4. Other Therapeutic Areas
- 8.1. Market Analysis, Insights and Forecast - by Material
- 9. Asia Pacific Vial Adaptors for Reconstitution Drug Industry Analysis, Insights and Forecast, 2020-2032
- 9.1. Market Analysis, Insights and Forecast - by Material
- 9.1.1. Polycarbonate
- 9.1.2. Silicon
- 9.1.3. Polyethylene
- 9.1.4. Other Materials
- 9.2. Market Analysis, Insights and Forecast - by Therapeutic Area
- 9.2.1. Autoimmune Diseases
- 9.2.2. Infectious Diseases
- 9.2.3. Metabolic Conditions
- 9.2.4. Other Therapeutic Areas
- 9.1. Market Analysis, Insights and Forecast - by Material
- 10. Middle East and Africa Vial Adaptors for Reconstitution Drug Industry Analysis, Insights and Forecast, 2020-2032
- 10.1. Market Analysis, Insights and Forecast - by Material
- 10.1.1. Polycarbonate
- 10.1.2. Silicon
- 10.1.3. Polyethylene
- 10.1.4. Other Materials
- 10.2. Market Analysis, Insights and Forecast - by Therapeutic Area
- 10.2.1. Autoimmune Diseases
- 10.2.2. Infectious Diseases
- 10.2.3. Metabolic Conditions
- 10.2.4. Other Therapeutic Areas
- 10.1. Market Analysis, Insights and Forecast - by Material
- 11. South America Vial Adaptors for Reconstitution Drug Industry Analysis, Insights and Forecast, 2020-2032
- 11.1. Market Analysis, Insights and Forecast - by Material
- 11.1.1. Polycarbonate
- 11.1.2. Silicon
- 11.1.3. Polyethylene
- 11.1.4. Other Materials
- 11.2. Market Analysis, Insights and Forecast - by Therapeutic Area
- 11.2.1. Autoimmune Diseases
- 11.2.2. Infectious Diseases
- 11.2.3. Metabolic Conditions
- 11.2.4. Other Therapeutic Areas
- 11.1. Market Analysis, Insights and Forecast - by Material
- 12. Competitive Analysis
- 12.1. Company Profiles
- 12.1.1 Becton Dickinson and Company
- 12.1.1.1. Company Overview
- 12.1.1.2. Products
- 12.1.1.3. Company Financials
- 12.1.1.4. SWOT Analysis
- 12.1.2 West Pharmaceutical Services Inc
- 12.1.2.1. Company Overview
- 12.1.2.2. Products
- 12.1.2.3. Company Financials
- 12.1.2.4. SWOT Analysis
- 12.1.3 Randox Laboratories Ltd
- 12.1.3.1. Company Overview
- 12.1.3.2. Products
- 12.1.3.3. Company Financials
- 12.1.3.4. SWOT Analysis
- 12.1.4 Miltenyi Biotec
- 12.1.4.1. Company Overview
- 12.1.4.2. Products
- 12.1.4.3. Company Financials
- 12.1.4.4. SWOT Analysis
- 12.1.5 ARaymond
- 12.1.5.1. Company Overview
- 12.1.5.2. Products
- 12.1.5.3. Company Financials
- 12.1.5.4. SWOT Analysis
- 12.1.6 Stevanato Group
- 12.1.6.1. Company Overview
- 12.1.6.2. Products
- 12.1.6.3. Company Financials
- 12.1.6.4. SWOT Analysis
- 12.1.7 Sartorious AG
- 12.1.7.1. Company Overview
- 12.1.7.2. Products
- 12.1.7.3. Company Financials
- 12.1.7.4. SWOT Analysis
- 12.1.8 Baxter International Inc
- 12.1.8.1. Company Overview
- 12.1.8.2. Products
- 12.1.8.3. Company Financials
- 12.1.8.4. SWOT Analysis
- 12.1.9 B Braun SE
- 12.1.9.1. Company Overview
- 12.1.9.2. Products
- 12.1.9.3. Company Financials
- 12.1.9.4. SWOT Analysis
- 12.1.10 Thermo Fisher Scientific
- 12.1.10.1. Company Overview
- 12.1.10.2. Products
- 12.1.10.3. Company Financials
- 12.1.10.4. SWOT Analysis
- 12.1.11 Simplivia
- 12.1.11.1. Company Overview
- 12.1.11.2. Products
- 12.1.11.3. Company Financials
- 12.1.11.4. SWOT Analysis
- 12.1.12 Agilent Technologies
- 12.1.12.1. Company Overview
- 12.1.12.2. Products
- 12.1.12.3. Company Financials
- 12.1.12.4. SWOT Analysis
- 12.1.1 Becton Dickinson and Company
- 12.2. Market Entropy
- 12.2.1 Company's Key Areas Served
- 12.2.2 Recent Developments
- 12.3. Company Market Share Analysis 2025
- 12.3.1 Top 5 Companies Market Share Analysis
- 12.3.2 Top 3 Companies Market Share Analysis
- 12.4. List of Potential Customers
- 13. Research Methodology
List of Figures
- Figure 1: Global Vial Adaptors for Reconstitution Drug Industry Revenue Breakdown (billion, %) by Region 2025 & 2033
- Figure 2: Global Vial Adaptors for Reconstitution Drug Industry Volume Breakdown (K Unit, %) by Region 2025 & 2033
- Figure 3: North America Vial Adaptors for Reconstitution Drug Industry Revenue (billion), by Material 2025 & 2033
- Figure 4: North America Vial Adaptors for Reconstitution Drug Industry Volume (K Unit), by Material 2025 & 2033
- Figure 5: North America Vial Adaptors for Reconstitution Drug Industry Revenue Share (%), by Material 2025 & 2033
- Figure 6: North America Vial Adaptors for Reconstitution Drug Industry Volume Share (%), by Material 2025 & 2033
- Figure 7: North America Vial Adaptors for Reconstitution Drug Industry Revenue (billion), by Therapeutic Area 2025 & 2033
- Figure 8: North America Vial Adaptors for Reconstitution Drug Industry Volume (K Unit), by Therapeutic Area 2025 & 2033
- Figure 9: North America Vial Adaptors for Reconstitution Drug Industry Revenue Share (%), by Therapeutic Area 2025 & 2033
- Figure 10: North America Vial Adaptors for Reconstitution Drug Industry Volume Share (%), by Therapeutic Area 2025 & 2033
- Figure 11: North America Vial Adaptors for Reconstitution Drug Industry Revenue (billion), by Country 2025 & 2033
- Figure 12: North America Vial Adaptors for Reconstitution Drug Industry Volume (K Unit), by Country 2025 & 2033
- Figure 13: North America Vial Adaptors for Reconstitution Drug Industry Revenue Share (%), by Country 2025 & 2033
- Figure 14: North America Vial Adaptors for Reconstitution Drug Industry Volume Share (%), by Country 2025 & 2033
- Figure 15: Europe Vial Adaptors for Reconstitution Drug Industry Revenue (billion), by Material 2025 & 2033
- Figure 16: Europe Vial Adaptors for Reconstitution Drug Industry Volume (K Unit), by Material 2025 & 2033
- Figure 17: Europe Vial Adaptors for Reconstitution Drug Industry Revenue Share (%), by Material 2025 & 2033
- Figure 18: Europe Vial Adaptors for Reconstitution Drug Industry Volume Share (%), by Material 2025 & 2033
- Figure 19: Europe Vial Adaptors for Reconstitution Drug Industry Revenue (billion), by Therapeutic Area 2025 & 2033
- Figure 20: Europe Vial Adaptors for Reconstitution Drug Industry Volume (K Unit), by Therapeutic Area 2025 & 2033
- Figure 21: Europe Vial Adaptors for Reconstitution Drug Industry Revenue Share (%), by Therapeutic Area 2025 & 2033
- Figure 22: Europe Vial Adaptors for Reconstitution Drug Industry Volume Share (%), by Therapeutic Area 2025 & 2033
- Figure 23: Europe Vial Adaptors for Reconstitution Drug Industry Revenue (billion), by Country 2025 & 2033
- Figure 24: Europe Vial Adaptors for Reconstitution Drug Industry Volume (K Unit), by Country 2025 & 2033
- Figure 25: Europe Vial Adaptors for Reconstitution Drug Industry Revenue Share (%), by Country 2025 & 2033
- Figure 26: Europe Vial Adaptors for Reconstitution Drug Industry Volume Share (%), by Country 2025 & 2033
- Figure 27: Asia Pacific Vial Adaptors for Reconstitution Drug Industry Revenue (billion), by Material 2025 & 2033
- Figure 28: Asia Pacific Vial Adaptors for Reconstitution Drug Industry Volume (K Unit), by Material 2025 & 2033
- Figure 29: Asia Pacific Vial Adaptors for Reconstitution Drug Industry Revenue Share (%), by Material 2025 & 2033
- Figure 30: Asia Pacific Vial Adaptors for Reconstitution Drug Industry Volume Share (%), by Material 2025 & 2033
- Figure 31: Asia Pacific Vial Adaptors for Reconstitution Drug Industry Revenue (billion), by Therapeutic Area 2025 & 2033
- Figure 32: Asia Pacific Vial Adaptors for Reconstitution Drug Industry Volume (K Unit), by Therapeutic Area 2025 & 2033
- Figure 33: Asia Pacific Vial Adaptors for Reconstitution Drug Industry Revenue Share (%), by Therapeutic Area 2025 & 2033
- Figure 34: Asia Pacific Vial Adaptors for Reconstitution Drug Industry Volume Share (%), by Therapeutic Area 2025 & 2033
- Figure 35: Asia Pacific Vial Adaptors for Reconstitution Drug Industry Revenue (billion), by Country 2025 & 2033
- Figure 36: Asia Pacific Vial Adaptors for Reconstitution Drug Industry Volume (K Unit), by Country 2025 & 2033
- Figure 37: Asia Pacific Vial Adaptors for Reconstitution Drug Industry Revenue Share (%), by Country 2025 & 2033
- Figure 38: Asia Pacific Vial Adaptors for Reconstitution Drug Industry Volume Share (%), by Country 2025 & 2033
- Figure 39: Middle East and Africa Vial Adaptors for Reconstitution Drug Industry Revenue (billion), by Material 2025 & 2033
- Figure 40: Middle East and Africa Vial Adaptors for Reconstitution Drug Industry Volume (K Unit), by Material 2025 & 2033
- Figure 41: Middle East and Africa Vial Adaptors for Reconstitution Drug Industry Revenue Share (%), by Material 2025 & 2033
- Figure 42: Middle East and Africa Vial Adaptors for Reconstitution Drug Industry Volume Share (%), by Material 2025 & 2033
- Figure 43: Middle East and Africa Vial Adaptors for Reconstitution Drug Industry Revenue (billion), by Therapeutic Area 2025 & 2033
- Figure 44: Middle East and Africa Vial Adaptors for Reconstitution Drug Industry Volume (K Unit), by Therapeutic Area 2025 & 2033
- Figure 45: Middle East and Africa Vial Adaptors for Reconstitution Drug Industry Revenue Share (%), by Therapeutic Area 2025 & 2033
- Figure 46: Middle East and Africa Vial Adaptors for Reconstitution Drug Industry Volume Share (%), by Therapeutic Area 2025 & 2033
- Figure 47: Middle East and Africa Vial Adaptors for Reconstitution Drug Industry Revenue (billion), by Country 2025 & 2033
- Figure 48: Middle East and Africa Vial Adaptors for Reconstitution Drug Industry Volume (K Unit), by Country 2025 & 2033
- Figure 49: Middle East and Africa Vial Adaptors for Reconstitution Drug Industry Revenue Share (%), by Country 2025 & 2033
- Figure 50: Middle East and Africa Vial Adaptors for Reconstitution Drug Industry Volume Share (%), by Country 2025 & 2033
- Figure 51: South America Vial Adaptors for Reconstitution Drug Industry Revenue (billion), by Material 2025 & 2033
- Figure 52: South America Vial Adaptors for Reconstitution Drug Industry Volume (K Unit), by Material 2025 & 2033
- Figure 53: South America Vial Adaptors for Reconstitution Drug Industry Revenue Share (%), by Material 2025 & 2033
- Figure 54: South America Vial Adaptors for Reconstitution Drug Industry Volume Share (%), by Material 2025 & 2033
- Figure 55: South America Vial Adaptors for Reconstitution Drug Industry Revenue (billion), by Therapeutic Area 2025 & 2033
- Figure 56: South America Vial Adaptors for Reconstitution Drug Industry Volume (K Unit), by Therapeutic Area 2025 & 2033
- Figure 57: South America Vial Adaptors for Reconstitution Drug Industry Revenue Share (%), by Therapeutic Area 2025 & 2033
- Figure 58: South America Vial Adaptors for Reconstitution Drug Industry Volume Share (%), by Therapeutic Area 2025 & 2033
- Figure 59: South America Vial Adaptors for Reconstitution Drug Industry Revenue (billion), by Country 2025 & 2033
- Figure 60: South America Vial Adaptors for Reconstitution Drug Industry Volume (K Unit), by Country 2025 & 2033
- Figure 61: South America Vial Adaptors for Reconstitution Drug Industry Revenue Share (%), by Country 2025 & 2033
- Figure 62: South America Vial Adaptors for Reconstitution Drug Industry Volume Share (%), by Country 2025 & 2033
List of Tables
- Table 1: Global Vial Adaptors for Reconstitution Drug Industry Revenue billion Forecast, by Material 2020 & 2033
- Table 2: Global Vial Adaptors for Reconstitution Drug Industry Volume K Unit Forecast, by Material 2020 & 2033
- Table 3: Global Vial Adaptors for Reconstitution Drug Industry Revenue billion Forecast, by Therapeutic Area 2020 & 2033
- Table 4: Global Vial Adaptors for Reconstitution Drug Industry Volume K Unit Forecast, by Therapeutic Area 2020 & 2033
- Table 5: Global Vial Adaptors for Reconstitution Drug Industry Revenue billion Forecast, by Region 2020 & 2033
- Table 6: Global Vial Adaptors for Reconstitution Drug Industry Volume K Unit Forecast, by Region 2020 & 2033
- Table 7: Global Vial Adaptors for Reconstitution Drug Industry Revenue billion Forecast, by Material 2020 & 2033
- Table 8: Global Vial Adaptors for Reconstitution Drug Industry Volume K Unit Forecast, by Material 2020 & 2033
- Table 9: Global Vial Adaptors for Reconstitution Drug Industry Revenue billion Forecast, by Therapeutic Area 2020 & 2033
- Table 10: Global Vial Adaptors for Reconstitution Drug Industry Volume K Unit Forecast, by Therapeutic Area 2020 & 2033
- Table 11: Global Vial Adaptors for Reconstitution Drug Industry Revenue billion Forecast, by Country 2020 & 2033
- Table 12: Global Vial Adaptors for Reconstitution Drug Industry Volume K Unit Forecast, by Country 2020 & 2033
- Table 13: United States Vial Adaptors for Reconstitution Drug Industry Revenue (billion) Forecast, by Application 2020 & 2033
- Table 14: United States Vial Adaptors for Reconstitution Drug Industry Volume (K Unit) Forecast, by Application 2020 & 2033
- Table 15: Canada Vial Adaptors for Reconstitution Drug Industry Revenue (billion) Forecast, by Application 2020 & 2033
- Table 16: Canada Vial Adaptors for Reconstitution Drug Industry Volume (K Unit) Forecast, by Application 2020 & 2033
- Table 17: Mexico Vial Adaptors for Reconstitution Drug Industry Revenue (billion) Forecast, by Application 2020 & 2033
- Table 18: Mexico Vial Adaptors for Reconstitution Drug Industry Volume (K Unit) Forecast, by Application 2020 & 2033
- Table 19: Global Vial Adaptors for Reconstitution Drug Industry Revenue billion Forecast, by Material 2020 & 2033
- Table 20: Global Vial Adaptors for Reconstitution Drug Industry Volume K Unit Forecast, by Material 2020 & 2033
- Table 21: Global Vial Adaptors for Reconstitution Drug Industry Revenue billion Forecast, by Therapeutic Area 2020 & 2033
- Table 22: Global Vial Adaptors for Reconstitution Drug Industry Volume K Unit Forecast, by Therapeutic Area 2020 & 2033
- Table 23: Global Vial Adaptors for Reconstitution Drug Industry Revenue billion Forecast, by Country 2020 & 2033
- Table 24: Global Vial Adaptors for Reconstitution Drug Industry Volume K Unit Forecast, by Country 2020 & 2033
- Table 25: Germany Vial Adaptors for Reconstitution Drug Industry Revenue (billion) Forecast, by Application 2020 & 2033
- Table 26: Germany Vial Adaptors for Reconstitution Drug Industry Volume (K Unit) Forecast, by Application 2020 & 2033
- Table 27: United Kingdom Vial Adaptors for Reconstitution Drug Industry Revenue (billion) Forecast, by Application 2020 & 2033
- Table 28: United Kingdom Vial Adaptors for Reconstitution Drug Industry Volume (K Unit) Forecast, by Application 2020 & 2033
- Table 29: France Vial Adaptors for Reconstitution Drug Industry Revenue (billion) Forecast, by Application 2020 & 2033
- Table 30: France Vial Adaptors for Reconstitution Drug Industry Volume (K Unit) Forecast, by Application 2020 & 2033
- Table 31: Italy Vial Adaptors for Reconstitution Drug Industry Revenue (billion) Forecast, by Application 2020 & 2033
- Table 32: Italy Vial Adaptors for Reconstitution Drug Industry Volume (K Unit) Forecast, by Application 2020 & 2033
- Table 33: Spain Vial Adaptors for Reconstitution Drug Industry Revenue (billion) Forecast, by Application 2020 & 2033
- Table 34: Spain Vial Adaptors for Reconstitution Drug Industry Volume (K Unit) Forecast, by Application 2020 & 2033
- Table 35: Rest of Europe Vial Adaptors for Reconstitution Drug Industry Revenue (billion) Forecast, by Application 2020 & 2033
- Table 36: Rest of Europe Vial Adaptors for Reconstitution Drug Industry Volume (K Unit) Forecast, by Application 2020 & 2033
- Table 37: Global Vial Adaptors for Reconstitution Drug Industry Revenue billion Forecast, by Material 2020 & 2033
- Table 38: Global Vial Adaptors for Reconstitution Drug Industry Volume K Unit Forecast, by Material 2020 & 2033
- Table 39: Global Vial Adaptors for Reconstitution Drug Industry Revenue billion Forecast, by Therapeutic Area 2020 & 2033
- Table 40: Global Vial Adaptors for Reconstitution Drug Industry Volume K Unit Forecast, by Therapeutic Area 2020 & 2033
- Table 41: Global Vial Adaptors for Reconstitution Drug Industry Revenue billion Forecast, by Country 2020 & 2033
- Table 42: Global Vial Adaptors for Reconstitution Drug Industry Volume K Unit Forecast, by Country 2020 & 2033
- Table 43: China Vial Adaptors for Reconstitution Drug Industry Revenue (billion) Forecast, by Application 2020 & 2033
- Table 44: China Vial Adaptors for Reconstitution Drug Industry Volume (K Unit) Forecast, by Application 2020 & 2033
- Table 45: Japan Vial Adaptors for Reconstitution Drug Industry Revenue (billion) Forecast, by Application 2020 & 2033
- Table 46: Japan Vial Adaptors for Reconstitution Drug Industry Volume (K Unit) Forecast, by Application 2020 & 2033
- Table 47: India Vial Adaptors for Reconstitution Drug Industry Revenue (billion) Forecast, by Application 2020 & 2033
- Table 48: India Vial Adaptors for Reconstitution Drug Industry Volume (K Unit) Forecast, by Application 2020 & 2033
- Table 49: Australia Vial Adaptors for Reconstitution Drug Industry Revenue (billion) Forecast, by Application 2020 & 2033
- Table 50: Australia Vial Adaptors for Reconstitution Drug Industry Volume (K Unit) Forecast, by Application 2020 & 2033
- Table 51: South Korea Vial Adaptors for Reconstitution Drug Industry Revenue (billion) Forecast, by Application 2020 & 2033
- Table 52: South Korea Vial Adaptors for Reconstitution Drug Industry Volume (K Unit) Forecast, by Application 2020 & 2033
- Table 53: Rest of Asia Pacific Vial Adaptors for Reconstitution Drug Industry Revenue (billion) Forecast, by Application 2020 & 2033
- Table 54: Rest of Asia Pacific Vial Adaptors for Reconstitution Drug Industry Volume (K Unit) Forecast, by Application 2020 & 2033
- Table 55: Global Vial Adaptors for Reconstitution Drug Industry Revenue billion Forecast, by Material 2020 & 2033
- Table 56: Global Vial Adaptors for Reconstitution Drug Industry Volume K Unit Forecast, by Material 2020 & 2033
- Table 57: Global Vial Adaptors for Reconstitution Drug Industry Revenue billion Forecast, by Therapeutic Area 2020 & 2033
- Table 58: Global Vial Adaptors for Reconstitution Drug Industry Volume K Unit Forecast, by Therapeutic Area 2020 & 2033
- Table 59: Global Vial Adaptors for Reconstitution Drug Industry Revenue billion Forecast, by Country 2020 & 2033
- Table 60: Global Vial Adaptors for Reconstitution Drug Industry Volume K Unit Forecast, by Country 2020 & 2033
- Table 61: GCC Vial Adaptors for Reconstitution Drug Industry Revenue (billion) Forecast, by Application 2020 & 2033
- Table 62: GCC Vial Adaptors for Reconstitution Drug Industry Volume (K Unit) Forecast, by Application 2020 & 2033
- Table 63: South Africa Vial Adaptors for Reconstitution Drug Industry Revenue (billion) Forecast, by Application 2020 & 2033
- Table 64: South Africa Vial Adaptors for Reconstitution Drug Industry Volume (K Unit) Forecast, by Application 2020 & 2033
- Table 65: Rest of Middle East and Africa Vial Adaptors for Reconstitution Drug Industry Revenue (billion) Forecast, by Application 2020 & 2033
- Table 66: Rest of Middle East and Africa Vial Adaptors for Reconstitution Drug Industry Volume (K Unit) Forecast, by Application 2020 & 2033
- Table 67: Global Vial Adaptors for Reconstitution Drug Industry Revenue billion Forecast, by Material 2020 & 2033
- Table 68: Global Vial Adaptors for Reconstitution Drug Industry Volume K Unit Forecast, by Material 2020 & 2033
- Table 69: Global Vial Adaptors for Reconstitution Drug Industry Revenue billion Forecast, by Therapeutic Area 2020 & 2033
- Table 70: Global Vial Adaptors for Reconstitution Drug Industry Volume K Unit Forecast, by Therapeutic Area 2020 & 2033
- Table 71: Global Vial Adaptors for Reconstitution Drug Industry Revenue billion Forecast, by Country 2020 & 2033
- Table 72: Global Vial Adaptors for Reconstitution Drug Industry Volume K Unit Forecast, by Country 2020 & 2033
- Table 73: Brazil Vial Adaptors for Reconstitution Drug Industry Revenue (billion) Forecast, by Application 2020 & 2033
- Table 74: Brazil Vial Adaptors for Reconstitution Drug Industry Volume (K Unit) Forecast, by Application 2020 & 2033
- Table 75: Argentina Vial Adaptors for Reconstitution Drug Industry Revenue (billion) Forecast, by Application 2020 & 2033
- Table 76: Argentina Vial Adaptors for Reconstitution Drug Industry Volume (K Unit) Forecast, by Application 2020 & 2033
- Table 77: Rest of South America Vial Adaptors for Reconstitution Drug Industry Revenue (billion) Forecast, by Application 2020 & 2033
- Table 78: Rest of South America Vial Adaptors for Reconstitution Drug Industry Volume (K Unit) Forecast, by Application 2020 & 2033
Frequently Asked Questions
1. What is the projected Compound Annual Growth Rate (CAGR) of the Vial Adaptors for Reconstitution Drug Industry?
The projected CAGR is approximately 6.2%.
2. Which companies are prominent players in the Vial Adaptors for Reconstitution Drug Industry?
Key companies in the market include Becton Dickinson and Company, West Pharmaceutical Services Inc , Randox Laboratories Ltd, Miltenyi Biotec, ARaymond, Stevanato Group, Sartorious AG, Baxter International Inc, B Braun SE, Thermo Fisher Scientific, Simplivia, Agilent Technologies.
3. What are the main segments of the Vial Adaptors for Reconstitution Drug Industry?
The market segments include Material, Therapeutic Area.
4. Can you provide details about the market size?
The market size is estimated to be USD 1.5 billion as of 2022.
5. What are some drivers contributing to market growth?
Increasing Prevalence of Infectious Diseases; Rising Geriatric Population; Increasing Awareness of the Advantages of the Vial Adaptors.
6. What are the notable trends driving market growth?
Infectious Diseases Segment is Expected to Hold a Significant Market Share Over the Forecast Period.
7. Are there any restraints impacting market growth?
Availability of Substitutes.
8. Can you provide examples of recent developments in the market?
Dec 2022: The life science group Sartorius and Sweden-based BICO Group, a provider of instruments and consumables for bioprinting, bioscience, and automation applications, agreed on a comprehensive technology as well as sales and marketing cooperation.
9. What pricing options are available for accessing the report?
Pricing options include single-user, multi-user, and enterprise licenses priced at USD 4750, USD 5250, and USD 8750 respectively.
10. Is the market size provided in terms of value or volume?
The market size is provided in terms of value, measured in billion and volume, measured in K Unit.
11. Are there any specific market keywords associated with the report?
Yes, the market keyword associated with the report is "Vial Adaptors for Reconstitution Drug Industry," which aids in identifying and referencing the specific market segment covered.
12. How do I determine which pricing option suits my needs best?
The pricing options vary based on user requirements and access needs. Individual users may opt for single-user licenses, while businesses requiring broader access may choose multi-user or enterprise licenses for cost-effective access to the report.
13. Are there any additional resources or data provided in the Vial Adaptors for Reconstitution Drug Industry report?
While the report offers comprehensive insights, it's advisable to review the specific contents or supplementary materials provided to ascertain if additional resources or data are available.
14. How can I stay updated on further developments or reports in the Vial Adaptors for Reconstitution Drug Industry?
To stay informed about further developments, trends, and reports in the Vial Adaptors for Reconstitution Drug Industry, consider subscribing to industry newsletters, following relevant companies and organizations, or regularly checking reputable industry news sources and publications.
Methodology
Step 1 - Identification of Relevant Samples Size from Population Database


Step 2 - Approaches for Defining Global Market Size (Value, Volume* & Price*)

Note*: In applicable scenarios
Step 3 - Data Sources
Primary Research
- Web Analytics
- Survey Reports
- Research Institute
- Latest Research Reports
- Opinion Leaders
Secondary Research
- Annual Reports
- White Paper
- Latest Press Release
- Industry Association
- Paid Database
- Investor Presentations

Step 4 - Data Triangulation
Involves using different sources of information in order to increase the validity of a study
These sources are likely to be stakeholders in a program - participants, other researchers, program staff, other community members, and so on.
Then we put all data in single framework & apply various statistical tools to find out the dynamic on the market.
During the analysis stage, feedback from the stakeholder groups would be compared to determine areas of agreement as well as areas of divergence