
Key Insights
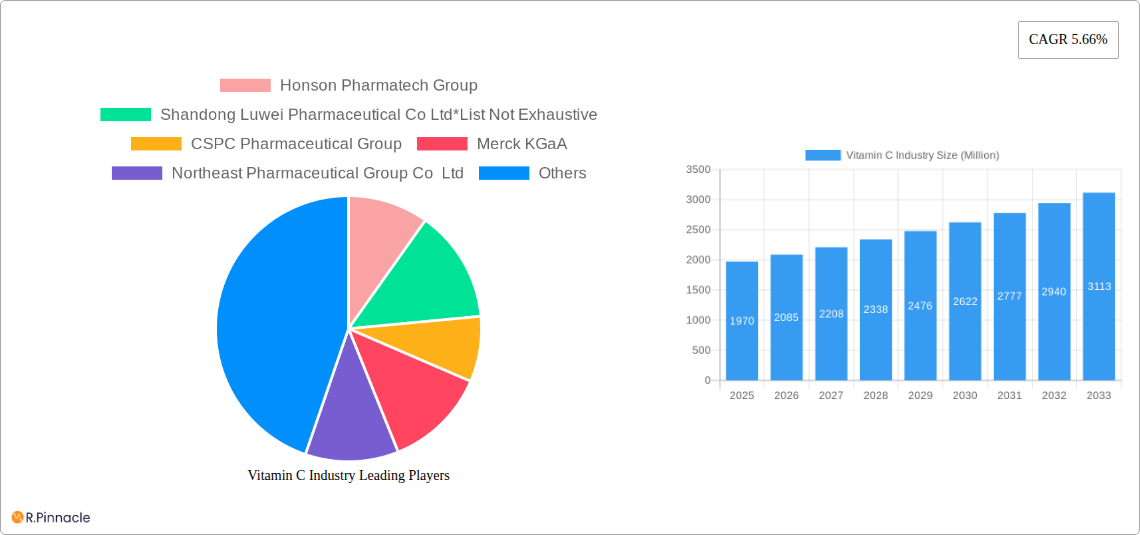
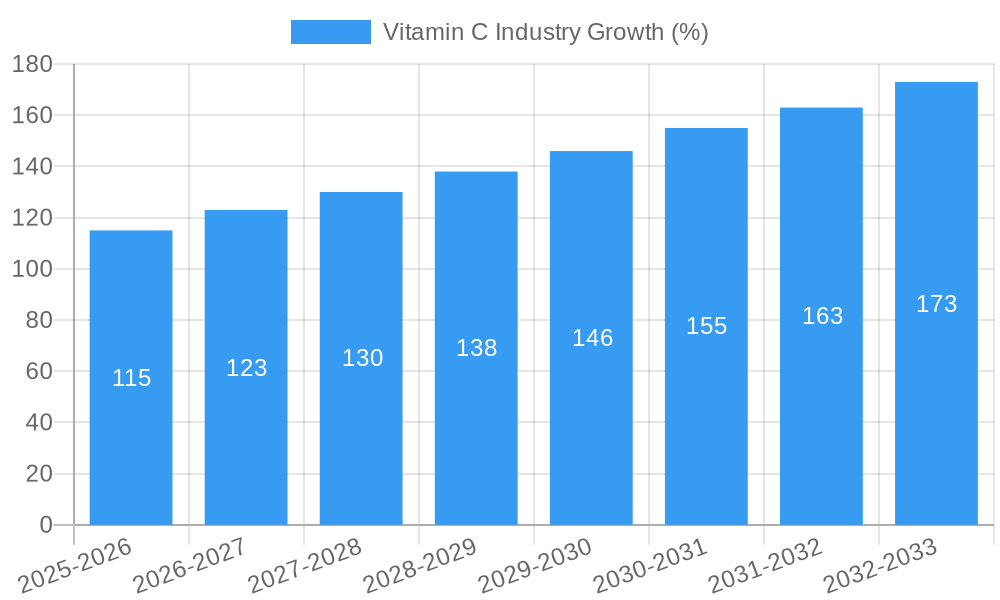
The global Vitamin C market, valued at $1.97 billion in 2025, is projected to experience robust growth, driven by increasing health consciousness and the expanding application of Vitamin C across diverse sectors. The compound annual growth rate (CAGR) of 5.66% from 2019 to 2024 suggests a sustained market expansion, anticipated to continue throughout the forecast period (2025-2033). Key drivers include the rising prevalence of vitamin deficiencies, increasing demand for natural and organic products, and the growing use of Vitamin C as a functional ingredient in food and beverages. The food and beverage industry remains a dominant application segment, fueled by consumer preference for fortified foods and drinks. Pharmaceuticals and healthcare also contribute significantly, with Vitamin C utilized in various formulations for its therapeutic properties. The beauty and personal care segment is experiencing considerable growth due to the inclusion of Vitamin C in skincare products for its antioxidant and brightening effects. Competition among key players like BASF SE, Merck KGaA, and others is intense, fostering innovation and driving price competitiveness. While regulatory changes and fluctuations in raw material prices pose potential restraints, the overall market outlook remains positive, with projected expansion across all major geographic regions, including North America, Europe, and Asia Pacific, which are anticipated to be the leading markets based on existing consumption patterns and economic growth.
The growth trajectory is expected to be fueled by several factors. The burgeoning demand for immunity-boosting products, particularly post-pandemic, has significantly boosted Vitamin C sales. Further, the increasing awareness about the role of Vitamin C in collagen synthesis and skin health is propelling growth in the beauty and personal care segments. The market's geographical distribution shows a strong presence in developed economies, but emerging markets in Asia-Pacific and South America are poised for significant growth, driven by rising disposable incomes and improving healthcare infrastructure. Companies are focusing on product diversification, introducing innovative formulations, and expanding their distribution networks to capture market share. Sustainability and ethical sourcing are also gaining importance, influencing consumer choices and prompting manufacturers to adopt responsible practices throughout their supply chains.
This comprehensive report provides an in-depth analysis of the global Vitamin C industry, offering invaluable insights for industry professionals, investors, and strategic decision-makers. With a study period spanning 2019-2033, a base year of 2025, and a forecast period of 2025-2033, this report leverages extensive data analysis to project market trends and opportunities. The market size is predicted to reach xx Million by 2033, exhibiting a robust CAGR.
Vitamin C Industry Market Structure & Innovation Trends
The Vitamin C market exhibits a moderately concentrated structure, with key players such as Honson Pharmatech Group, Shandong Luwei Pharmaceutical Co Ltd, CSPC Pharmaceutical Group, Merck KGaA, Northeast Pharmaceutical Group Co Ltd, BASF SE, Freshine Chem, Koninklijke DSM NV, Foodchem International Corporation, and MC Biotec Inc. holding significant market share. However, the presence of numerous smaller players contributes to a dynamic competitive landscape.
- Market Concentration: The top 5 players account for approximately xx% of the global market share (2024 data).
- Innovation Drivers: Growing demand for natural and organic products, increasing health consciousness among consumers, and advancements in manufacturing technologies are key drivers of innovation.
- Regulatory Frameworks: Stringent regulations regarding food additives and pharmaceutical ingredients influence product development and market access.
- Product Substitutes: The availability of alternative antioxidants and nutritional supplements presents competitive pressure.
- End-User Demographics: The rising prevalence of lifestyle diseases and increasing disposable incomes in emerging economies are major factors driving demand.
- M&A Activities: The merger of Royal DSM and Firmenich in May 2022, creating a EUR 11.5 billion entity, highlights significant consolidation and strategic alliances in the industry. The total value of M&A deals in the Vitamin C industry between 2019 and 2024 is estimated at xx Million.
Vitamin C Industry Market Dynamics & Trends
The global Vitamin C market is experiencing robust growth, driven by increasing consumer awareness of its health benefits and its widespread applications across various sectors. Technological advancements in manufacturing processes are leading to higher production efficiency and lower costs. Changing consumer preferences towards healthier lifestyles and functional foods further fuel market expansion. The competitive landscape is characterized by both intense rivalry among established players and the emergence of new entrants, fostering innovation and product differentiation. The market is witnessing a growing preference for sustainable and ethically sourced Vitamin C, influencing the sourcing strategies of manufacturers. The predicted CAGR for the forecast period is xx%, reflecting a strong market outlook. Market penetration in developing economies is expected to increase significantly, contributing to overall growth.
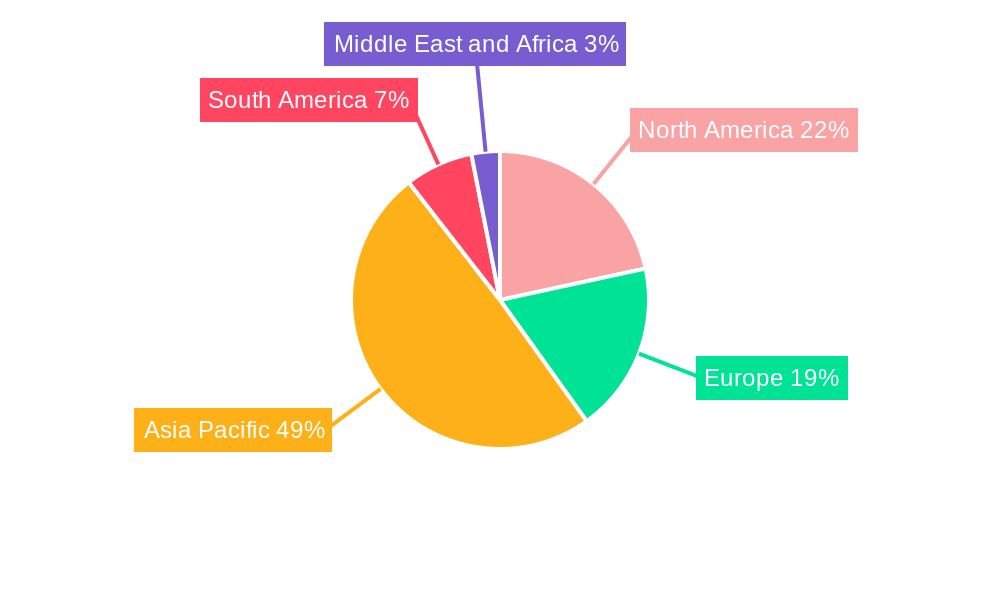
Dominant Regions & Segments in Vitamin C Industry
The Asia-Pacific region is currently the dominant market for Vitamin C, driven by factors such as robust economic growth, increasing population, and rising health awareness.
- Asia-Pacific: Key drivers include rapid economic expansion, increasing disposable incomes, and rising health consciousness. Significant infrastructure development also facilitates market growth.
- North America: Strong demand from the pharmaceutical and healthcare sectors contributes to regional dominance.
- Europe: This region shows steady growth due to the demand for high-quality Vitamin C products in the food and beverage industries.
Segment Dominance: The Pharmaceuticals and Healthcare segment holds the largest market share among applications, followed by Food and Beverage, Beauty and Personal Care, and Animal Feed, reflecting the versatile applications of Vitamin C across various industries.
Vitamin C Industry Product Innovations
Recent innovations focus on improving the bioavailability, stability, and delivery methods of Vitamin C. Liposomal Vitamin C and other advanced formulations are gaining popularity due to enhanced absorption and efficacy. Technological advancements in fermentation and extraction techniques are contributing to cost-effective production and improved sustainability. This reflects a clear market trend towards more effective and sustainable Vitamin C products.
Report Scope & Segmentation Analysis
This report segments the Vitamin C market by application:
- Food and Beverage: This segment is projected to grow at a CAGR of xx% during the forecast period. The market is driven by the increasing demand for fortified foods and beverages.
- Pharmaceuticals and Healthcare: This segment exhibits the highest growth potential due to the rising demand for Vitamin C as a pharmaceutical ingredient and dietary supplement. The projected CAGR is xx%.
- Beauty and Personal Care: This segment is growing steadily due to the incorporation of Vitamin C in skincare and cosmetic products. The growth is predicted at a CAGR of xx%.
- Animal Feed: This segment demonstrates consistent growth due to the increasing demand for Vitamin C as a feed additive in animal nutrition. The CAGR for this segment is expected to be xx%.
Key Drivers of Vitamin C Industry Growth
The key drivers of Vitamin C industry growth include:
- Rising consumer awareness of its health benefits.
- Increased demand for fortified foods and beverages.
- Technological advancements leading to efficient and cost-effective production.
- Growing applications in the pharmaceutical and cosmetic industries.
- Favorable government regulations supporting the use of Vitamin C in various applications.
Challenges in the Vitamin C Industry Sector
Challenges facing the Vitamin C industry include:
- Fluctuations in raw material prices and supply chain disruptions.
- Intense competition from both established players and new entrants.
- Stringent regulatory requirements for food and pharmaceutical applications.
- Environmental concerns related to production processes.
- Ensuring product quality and authenticity to avoid counterfeiting.
Emerging Opportunities in Vitamin C Industry
Emerging opportunities include:
- Expansion into new and untapped markets, particularly in developing economies.
- Development of innovative delivery systems (e.g., liposomal) for enhanced bioavailability.
- Growing demand for sustainable and ethically sourced Vitamin C.
- Increased focus on functional foods and beverages containing Vitamin C.
- Development of novel applications in the nutraceutical and cosmeceutical sectors.
Leading Players in the Vitamin C Industry Market
- Honson Pharmatech Group
- Shandong Luwei Pharmaceutical Co Ltd
- CSPC Pharmaceutical Group
- Merck KGaA
- Northeast Pharmaceutical Group Co Ltd
- BASF SE
- Freshine Chem
- Koninklijke DSM NV
- Foodchem International Corporation
- MC Biotec Inc
Key Developments in Vitamin C Industry Industry
- December 2022: Merck KGaA and Mersana Therapeutics announced a joint partnership to create novel immunostimulatory antibody-drug conjugates, enhancing Merck KGaA's ADC strategy.
- May 2022: Royal DSM merged with Firmenich, creating a major player with diversified business units, including food and beverage, health and nutrition, and animal nutrition, significantly impacting market dynamics.
Future Outlook for Vitamin C Industry Market
The Vitamin C market is poised for continued growth, driven by several factors, including increasing health consciousness, expanding applications in various sectors, and ongoing innovations in product formulation and delivery. Strategic partnerships, mergers and acquisitions, and focus on sustainability will further shape the industry landscape, presenting significant opportunities for growth and market expansion in the coming years.
Vitamin C Industry Segmentation
-
1. Application
- 1.1. Food and Beverage
- 1.2. Pharmaceuticals and Healthcare
- 1.3. Beauty and Personal Care
- 1.4. Animal Feed
Vitamin C Industry Segmentation By Geography
-
1. North America
- 1.1. United States
- 1.2. Canada
- 1.3. Mexico
- 1.4. Rest of North America
-
2. Europe
- 2.1. Spain
- 2.2. United Kingdom
- 2.3. Germany
- 2.4. France
- 2.5. Italy
- 2.6. Russia
- 2.7. Rest of Europe
-
3. Asia Pacific
- 3.1. China
- 3.2. Japan
- 3.3. India
- 3.4. Australia
- 3.5. Rest of Asia Pacific
-
4. South America
- 4.1. Brazil
- 4.2. Argentina
- 4.3. Rest of South America
-
5. Middle East and Africa
- 5.1. South Africa
- 5.2. United Arab Emirates
- 5.3. Rest of Middle East and Africa
Vitamin C Industry REPORT HIGHLIGHTS
| Aspects | Details |
|---|---|
| Study Period | 2019-2033 |
| Base Year | 2024 |
| Estimated Year | 2025 |
| Forecast Period | 2025-2033 |
| Historical Period | 2019-2024 |
| Growth Rate | CAGR of 5.66% from 2019-2033 |
| Segmentation |
|
Table of Contents
- 1. Introduction
- 1.1. Research Scope
- 1.2. Market Segmentation
- 1.3. Research Methodology
- 1.4. Definitions and Assumptions
- 2. Executive Summary
- 2.1. Introduction
- 3. Market Dynamics
- 3.1. Introduction
- 3.2. Market Drivers
- 3.2.1. Increasing Demand for Functional and Fortified Food; Multi-functionality and Wide Application of Riboflavin
- 3.3. Market Restrains
- 3.3.1. Low Stability of Riboflavin on Exposure to Light and Heat
- 3.4. Market Trends
- 3.4.1. Increasing Demand from Fortified/Functional Food and Beverage Application
- 4. Market Factor Analysis
- 4.1. Porters Five Forces
- 4.2. Supply/Value Chain
- 4.3. PESTEL analysis
- 4.4. Market Entropy
- 4.5. Patent/Trademark Analysis
- 5. Global Vitamin C Industry Analysis, Insights and Forecast, 2019-2031
- 5.1. Market Analysis, Insights and Forecast - by Application
- 5.1.1. Food and Beverage
- 5.1.2. Pharmaceuticals and Healthcare
- 5.1.3. Beauty and Personal Care
- 5.1.4. Animal Feed
- 5.2. Market Analysis, Insights and Forecast - by Region
- 5.2.1. North America
- 5.2.2. Europe
- 5.2.3. Asia Pacific
- 5.2.4. South America
- 5.2.5. Middle East and Africa
- 5.1. Market Analysis, Insights and Forecast - by Application
- 6. North America Vitamin C Industry Analysis, Insights and Forecast, 2019-2031
- 6.1. Market Analysis, Insights and Forecast - by Application
- 6.1.1. Food and Beverage
- 6.1.2. Pharmaceuticals and Healthcare
- 6.1.3. Beauty and Personal Care
- 6.1.4. Animal Feed
- 6.1. Market Analysis, Insights and Forecast - by Application
- 7. Europe Vitamin C Industry Analysis, Insights and Forecast, 2019-2031
- 7.1. Market Analysis, Insights and Forecast - by Application
- 7.1.1. Food and Beverage
- 7.1.2. Pharmaceuticals and Healthcare
- 7.1.3. Beauty and Personal Care
- 7.1.4. Animal Feed
- 7.1. Market Analysis, Insights and Forecast - by Application
- 8. Asia Pacific Vitamin C Industry Analysis, Insights and Forecast, 2019-2031
- 8.1. Market Analysis, Insights and Forecast - by Application
- 8.1.1. Food and Beverage
- 8.1.2. Pharmaceuticals and Healthcare
- 8.1.3. Beauty and Personal Care
- 8.1.4. Animal Feed
- 8.1. Market Analysis, Insights and Forecast - by Application
- 9. South America Vitamin C Industry Analysis, Insights and Forecast, 2019-2031
- 9.1. Market Analysis, Insights and Forecast - by Application
- 9.1.1. Food and Beverage
- 9.1.2. Pharmaceuticals and Healthcare
- 9.1.3. Beauty and Personal Care
- 9.1.4. Animal Feed
- 9.1. Market Analysis, Insights and Forecast - by Application
- 10. Middle East and Africa Vitamin C Industry Analysis, Insights and Forecast, 2019-2031
- 10.1. Market Analysis, Insights and Forecast - by Application
- 10.1.1. Food and Beverage
- 10.1.2. Pharmaceuticals and Healthcare
- 10.1.3. Beauty and Personal Care
- 10.1.4. Animal Feed
- 10.1. Market Analysis, Insights and Forecast - by Application
- 11. North America Vitamin C Industry Analysis, Insights and Forecast, 2019-2031
- 11.1. Market Analysis, Insights and Forecast - By Country/Sub-region
- 11.1.1 United States
- 11.1.2 Canada
- 11.1.3 Mexico
- 11.1.4 Rest of North America
- 12. Europe Vitamin C Industry Analysis, Insights and Forecast, 2019-2031
- 12.1. Market Analysis, Insights and Forecast - By Country/Sub-region
- 12.1.1 Spain
- 12.1.2 United Kingdom
- 12.1.3 Germany
- 12.1.4 France
- 12.1.5 Italy
- 12.1.6 Russia
- 12.1.7 Rest of Europe
- 13. Asia Pacific Vitamin C Industry Analysis, Insights and Forecast, 2019-2031
- 13.1. Market Analysis, Insights and Forecast - By Country/Sub-region
- 13.1.1 China
- 13.1.2 Japan
- 13.1.3 India
- 13.1.4 Australia
- 13.1.5 Rest of Asia Pacific
- 14. South America Vitamin C Industry Analysis, Insights and Forecast, 2019-2031
- 14.1. Market Analysis, Insights and Forecast - By Country/Sub-region
- 14.1.1 Brazil
- 14.1.2 Argentina
- 14.1.3 Rest of South America
- 15. Middle East and Africa Vitamin C Industry Analysis, Insights and Forecast, 2019-2031
- 15.1. Market Analysis, Insights and Forecast - By Country/Sub-region
- 15.1.1 South Africa
- 15.1.2 United Arab Emirates
- 15.1.3 Rest of Middle East and Africa
- 16. Competitive Analysis
- 16.1. Global Market Share Analysis 2024
- 16.2. Company Profiles
- 16.2.1 Honson Pharmatech Group
- 16.2.1.1. Overview
- 16.2.1.2. Products
- 16.2.1.3. SWOT Analysis
- 16.2.1.4. Recent Developments
- 16.2.1.5. Financials (Based on Availability)
- 16.2.2 Shandong Luwei Pharmaceutical Co Ltd*List Not Exhaustive
- 16.2.2.1. Overview
- 16.2.2.2. Products
- 16.2.2.3. SWOT Analysis
- 16.2.2.4. Recent Developments
- 16.2.2.5. Financials (Based on Availability)
- 16.2.3 CSPC Pharmaceutical Group
- 16.2.3.1. Overview
- 16.2.3.2. Products
- 16.2.3.3. SWOT Analysis
- 16.2.3.4. Recent Developments
- 16.2.3.5. Financials (Based on Availability)
- 16.2.4 Merck KGaA
- 16.2.4.1. Overview
- 16.2.4.2. Products
- 16.2.4.3. SWOT Analysis
- 16.2.4.4. Recent Developments
- 16.2.4.5. Financials (Based on Availability)
- 16.2.5 Northeast Pharmaceutical Group Co Ltd
- 16.2.5.1. Overview
- 16.2.5.2. Products
- 16.2.5.3. SWOT Analysis
- 16.2.5.4. Recent Developments
- 16.2.5.5. Financials (Based on Availability)
- 16.2.6 BASF SE
- 16.2.6.1. Overview
- 16.2.6.2. Products
- 16.2.6.3. SWOT Analysis
- 16.2.6.4. Recent Developments
- 16.2.6.5. Financials (Based on Availability)
- 16.2.7 Freshine Chem
- 16.2.7.1. Overview
- 16.2.7.2. Products
- 16.2.7.3. SWOT Analysis
- 16.2.7.4. Recent Developments
- 16.2.7.5. Financials (Based on Availability)
- 16.2.8 Koninklijke DSM NV
- 16.2.8.1. Overview
- 16.2.8.2. Products
- 16.2.8.3. SWOT Analysis
- 16.2.8.4. Recent Developments
- 16.2.8.5. Financials (Based on Availability)
- 16.2.9 Foodchem International Corporation
- 16.2.9.1. Overview
- 16.2.9.2. Products
- 16.2.9.3. SWOT Analysis
- 16.2.9.4. Recent Developments
- 16.2.9.5. Financials (Based on Availability)
- 16.2.10 MC Biotec Inc
- 16.2.10.1. Overview
- 16.2.10.2. Products
- 16.2.10.3. SWOT Analysis
- 16.2.10.4. Recent Developments
- 16.2.10.5. Financials (Based on Availability)
- 16.2.1 Honson Pharmatech Group
List of Figures
- Figure 1: Global Vitamin C Industry Revenue Breakdown (Million, %) by Region 2024 & 2032
- Figure 2: North America Vitamin C Industry Revenue (Million), by Country 2024 & 2032
- Figure 3: North America Vitamin C Industry Revenue Share (%), by Country 2024 & 2032
- Figure 4: Europe Vitamin C Industry Revenue (Million), by Country 2024 & 2032
- Figure 5: Europe Vitamin C Industry Revenue Share (%), by Country 2024 & 2032
- Figure 6: Asia Pacific Vitamin C Industry Revenue (Million), by Country 2024 & 2032
- Figure 7: Asia Pacific Vitamin C Industry Revenue Share (%), by Country 2024 & 2032
- Figure 8: South America Vitamin C Industry Revenue (Million), by Country 2024 & 2032
- Figure 9: South America Vitamin C Industry Revenue Share (%), by Country 2024 & 2032
- Figure 10: Middle East and Africa Vitamin C Industry Revenue (Million), by Country 2024 & 2032
- Figure 11: Middle East and Africa Vitamin C Industry Revenue Share (%), by Country 2024 & 2032
- Figure 12: North America Vitamin C Industry Revenue (Million), by Application 2024 & 2032
- Figure 13: North America Vitamin C Industry Revenue Share (%), by Application 2024 & 2032
- Figure 14: North America Vitamin C Industry Revenue (Million), by Country 2024 & 2032
- Figure 15: North America Vitamin C Industry Revenue Share (%), by Country 2024 & 2032
- Figure 16: Europe Vitamin C Industry Revenue (Million), by Application 2024 & 2032
- Figure 17: Europe Vitamin C Industry Revenue Share (%), by Application 2024 & 2032
- Figure 18: Europe Vitamin C Industry Revenue (Million), by Country 2024 & 2032
- Figure 19: Europe Vitamin C Industry Revenue Share (%), by Country 2024 & 2032
- Figure 20: Asia Pacific Vitamin C Industry Revenue (Million), by Application 2024 & 2032
- Figure 21: Asia Pacific Vitamin C Industry Revenue Share (%), by Application 2024 & 2032
- Figure 22: Asia Pacific Vitamin C Industry Revenue (Million), by Country 2024 & 2032
- Figure 23: Asia Pacific Vitamin C Industry Revenue Share (%), by Country 2024 & 2032
- Figure 24: South America Vitamin C Industry Revenue (Million), by Application 2024 & 2032
- Figure 25: South America Vitamin C Industry Revenue Share (%), by Application 2024 & 2032
- Figure 26: South America Vitamin C Industry Revenue (Million), by Country 2024 & 2032
- Figure 27: South America Vitamin C Industry Revenue Share (%), by Country 2024 & 2032
- Figure 28: Middle East and Africa Vitamin C Industry Revenue (Million), by Application 2024 & 2032
- Figure 29: Middle East and Africa Vitamin C Industry Revenue Share (%), by Application 2024 & 2032
- Figure 30: Middle East and Africa Vitamin C Industry Revenue (Million), by Country 2024 & 2032
- Figure 31: Middle East and Africa Vitamin C Industry Revenue Share (%), by Country 2024 & 2032
List of Tables
- Table 1: Global Vitamin C Industry Revenue Million Forecast, by Region 2019 & 2032
- Table 2: Global Vitamin C Industry Revenue Million Forecast, by Application 2019 & 2032
- Table 3: Global Vitamin C Industry Revenue Million Forecast, by Region 2019 & 2032
- Table 4: Global Vitamin C Industry Revenue Million Forecast, by Country 2019 & 2032
- Table 5: United States Vitamin C Industry Revenue (Million) Forecast, by Application 2019 & 2032
- Table 6: Canada Vitamin C Industry Revenue (Million) Forecast, by Application 2019 & 2032
- Table 7: Mexico Vitamin C Industry Revenue (Million) Forecast, by Application 2019 & 2032
- Table 8: Rest of North America Vitamin C Industry Revenue (Million) Forecast, by Application 2019 & 2032
- Table 9: Global Vitamin C Industry Revenue Million Forecast, by Country 2019 & 2032
- Table 10: Spain Vitamin C Industry Revenue (Million) Forecast, by Application 2019 & 2032
- Table 11: United Kingdom Vitamin C Industry Revenue (Million) Forecast, by Application 2019 & 2032
- Table 12: Germany Vitamin C Industry Revenue (Million) Forecast, by Application 2019 & 2032
- Table 13: France Vitamin C Industry Revenue (Million) Forecast, by Application 2019 & 2032
- Table 14: Italy Vitamin C Industry Revenue (Million) Forecast, by Application 2019 & 2032
- Table 15: Russia Vitamin C Industry Revenue (Million) Forecast, by Application 2019 & 2032
- Table 16: Rest of Europe Vitamin C Industry Revenue (Million) Forecast, by Application 2019 & 2032
- Table 17: Global Vitamin C Industry Revenue Million Forecast, by Country 2019 & 2032
- Table 18: China Vitamin C Industry Revenue (Million) Forecast, by Application 2019 & 2032
- Table 19: Japan Vitamin C Industry Revenue (Million) Forecast, by Application 2019 & 2032
- Table 20: India Vitamin C Industry Revenue (Million) Forecast, by Application 2019 & 2032
- Table 21: Australia Vitamin C Industry Revenue (Million) Forecast, by Application 2019 & 2032
- Table 22: Rest of Asia Pacific Vitamin C Industry Revenue (Million) Forecast, by Application 2019 & 2032
- Table 23: Global Vitamin C Industry Revenue Million Forecast, by Country 2019 & 2032
- Table 24: Brazil Vitamin C Industry Revenue (Million) Forecast, by Application 2019 & 2032
- Table 25: Argentina Vitamin C Industry Revenue (Million) Forecast, by Application 2019 & 2032
- Table 26: Rest of South America Vitamin C Industry Revenue (Million) Forecast, by Application 2019 & 2032
- Table 27: Global Vitamin C Industry Revenue Million Forecast, by Country 2019 & 2032
- Table 28: South Africa Vitamin C Industry Revenue (Million) Forecast, by Application 2019 & 2032
- Table 29: United Arab Emirates Vitamin C Industry Revenue (Million) Forecast, by Application 2019 & 2032
- Table 30: Rest of Middle East and Africa Vitamin C Industry Revenue (Million) Forecast, by Application 2019 & 2032
- Table 31: Global Vitamin C Industry Revenue Million Forecast, by Application 2019 & 2032
- Table 32: Global Vitamin C Industry Revenue Million Forecast, by Country 2019 & 2032
- Table 33: United States Vitamin C Industry Revenue (Million) Forecast, by Application 2019 & 2032
- Table 34: Canada Vitamin C Industry Revenue (Million) Forecast, by Application 2019 & 2032
- Table 35: Mexico Vitamin C Industry Revenue (Million) Forecast, by Application 2019 & 2032
- Table 36: Rest of North America Vitamin C Industry Revenue (Million) Forecast, by Application 2019 & 2032
- Table 37: Global Vitamin C Industry Revenue Million Forecast, by Application 2019 & 2032
- Table 38: Global Vitamin C Industry Revenue Million Forecast, by Country 2019 & 2032
- Table 39: Spain Vitamin C Industry Revenue (Million) Forecast, by Application 2019 & 2032
- Table 40: United Kingdom Vitamin C Industry Revenue (Million) Forecast, by Application 2019 & 2032
- Table 41: Germany Vitamin C Industry Revenue (Million) Forecast, by Application 2019 & 2032
- Table 42: France Vitamin C Industry Revenue (Million) Forecast, by Application 2019 & 2032
- Table 43: Italy Vitamin C Industry Revenue (Million) Forecast, by Application 2019 & 2032
- Table 44: Russia Vitamin C Industry Revenue (Million) Forecast, by Application 2019 & 2032
- Table 45: Rest of Europe Vitamin C Industry Revenue (Million) Forecast, by Application 2019 & 2032
- Table 46: Global Vitamin C Industry Revenue Million Forecast, by Application 2019 & 2032
- Table 47: Global Vitamin C Industry Revenue Million Forecast, by Country 2019 & 2032
- Table 48: China Vitamin C Industry Revenue (Million) Forecast, by Application 2019 & 2032
- Table 49: Japan Vitamin C Industry Revenue (Million) Forecast, by Application 2019 & 2032
- Table 50: India Vitamin C Industry Revenue (Million) Forecast, by Application 2019 & 2032
- Table 51: Australia Vitamin C Industry Revenue (Million) Forecast, by Application 2019 & 2032
- Table 52: Rest of Asia Pacific Vitamin C Industry Revenue (Million) Forecast, by Application 2019 & 2032
- Table 53: Global Vitamin C Industry Revenue Million Forecast, by Application 2019 & 2032
- Table 54: Global Vitamin C Industry Revenue Million Forecast, by Country 2019 & 2032
- Table 55: Brazil Vitamin C Industry Revenue (Million) Forecast, by Application 2019 & 2032
- Table 56: Argentina Vitamin C Industry Revenue (Million) Forecast, by Application 2019 & 2032
- Table 57: Rest of South America Vitamin C Industry Revenue (Million) Forecast, by Application 2019 & 2032
- Table 58: Global Vitamin C Industry Revenue Million Forecast, by Application 2019 & 2032
- Table 59: Global Vitamin C Industry Revenue Million Forecast, by Country 2019 & 2032
- Table 60: South Africa Vitamin C Industry Revenue (Million) Forecast, by Application 2019 & 2032
- Table 61: United Arab Emirates Vitamin C Industry Revenue (Million) Forecast, by Application 2019 & 2032
- Table 62: Rest of Middle East and Africa Vitamin C Industry Revenue (Million) Forecast, by Application 2019 & 2032
Frequently Asked Questions
1. What is the projected Compound Annual Growth Rate (CAGR) of the Vitamin C Industry?
The projected CAGR is approximately 5.66%.
2. Which companies are prominent players in the Vitamin C Industry?
Key companies in the market include Honson Pharmatech Group, Shandong Luwei Pharmaceutical Co Ltd*List Not Exhaustive, CSPC Pharmaceutical Group, Merck KGaA, Northeast Pharmaceutical Group Co Ltd, BASF SE, Freshine Chem, Koninklijke DSM NV, Foodchem International Corporation, MC Biotec Inc.
3. What are the main segments of the Vitamin C Industry?
The market segments include Application.
4. Can you provide details about the market size?
The market size is estimated to be USD 1.97 Million as of 2022.
5. What are some drivers contributing to market growth?
Increasing Demand for Functional and Fortified Food; Multi-functionality and Wide Application of Riboflavin.
6. What are the notable trends driving market growth?
Increasing Demand from Fortified/Functional Food and Beverage Application.
7. Are there any restraints impacting market growth?
Low Stability of Riboflavin on Exposure to Light and Heat.
8. Can you provide examples of recent developments in the market?
In December 2022, Merck KGaA and Mersana Therapeutics announced a joint partnership to create novel immunostimulatory antibody-drug conjugates. This collaboration strengthens the internal expertise and internal ADC strategy of Merck KGaA, Darmstadt, Germany.
9. What pricing options are available for accessing the report?
Pricing options include single-user, multi-user, and enterprise licenses priced at USD 4750, USD 5250, and USD 8750 respectively.
10. Is the market size provided in terms of value or volume?
The market size is provided in terms of value, measured in Million.
11. Are there any specific market keywords associated with the report?
Yes, the market keyword associated with the report is "Vitamin C Industry," which aids in identifying and referencing the specific market segment covered.
12. How do I determine which pricing option suits my needs best?
The pricing options vary based on user requirements and access needs. Individual users may opt for single-user licenses, while businesses requiring broader access may choose multi-user or enterprise licenses for cost-effective access to the report.
13. Are there any additional resources or data provided in the Vitamin C Industry report?
While the report offers comprehensive insights, it's advisable to review the specific contents or supplementary materials provided to ascertain if additional resources or data are available.
14. How can I stay updated on further developments or reports in the Vitamin C Industry?
To stay informed about further developments, trends, and reports in the Vitamin C Industry, consider subscribing to industry newsletters, following relevant companies and organizations, or regularly checking reputable industry news sources and publications.
Methodology
Step 1 - Identification of Relevant Samples Size from Population Database


Step 2 - Approaches for Defining Global Market Size (Value, Volume* & Price*)

Note*: In applicable scenarios
Step 3 - Data Sources
Primary Research
- Web Analytics
- Survey Reports
- Research Institute
- Latest Research Reports
- Opinion Leaders
Secondary Research
- Annual Reports
- White Paper
- Latest Press Release
- Industry Association
- Paid Database
- Investor Presentations

Step 4 - Data Triangulation
Involves using different sources of information in order to increase the validity of a study
These sources are likely to be stakeholders in a program - participants, other researchers, program staff, other community members, and so on.
Then we put all data in single framework & apply various statistical tools to find out the dynamic on the market.
During the analysis stage, feedback from the stakeholder groups would be compared to determine areas of agreement as well as areas of divergence


