Key Insights
The global vodka market, valued at $44.2 billion in 2025, is forecast to expand at a compound annual growth rate (CAGR) of 5.5% between 2025 and 2033. This growth is propelled by the rising popularity of vodka-based cocktails, especially among younger consumers, and a growing consumer preference for premium and super-premium brands with unique flavor profiles. Increased disposable incomes in emerging economies are also contributing to higher spending on alcoholic beverages. Geographic expansion in markets like Asia-Pacific and South America presents significant growth opportunities. However, potential restraints include evolving alcohol consumption regulations and increasing health consciousness. The market is segmented by distribution channel (on-trade, off-trade), type (flavored, non-flavored), and category (mass, premium, super-premium). Key industry players such as Bacardi Limited, Diageo PLC, and Pernod Ricard are employing strategic brand positioning, product innovation, and aggressive marketing to secure market share in this dynamic competitive landscape.
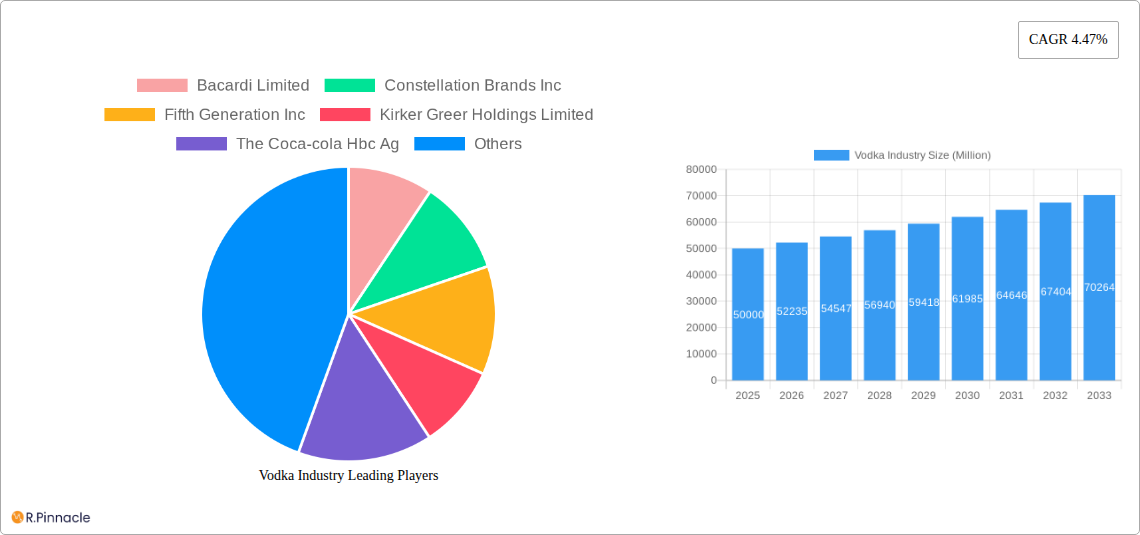
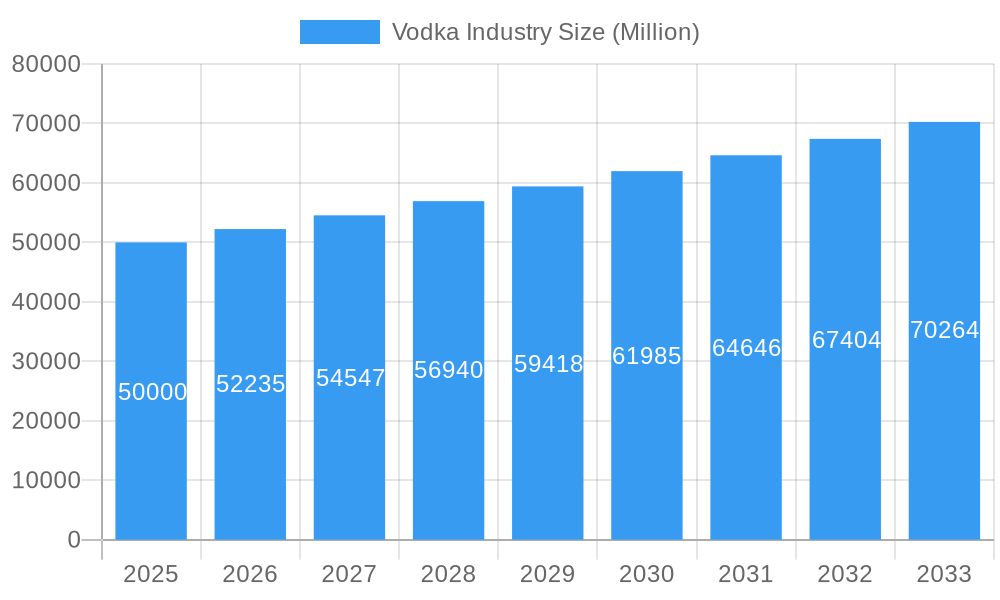
Vodka Industry Market Size (In Billion)
The forecast period (2025-2033) indicates sustained growth, particularly in the flavored and premium segments. The on-trade channel is expected to retain a substantial market share, while the off-trade channel is projected for steady growth due to at-home consumption convenience. While North America and Europe will continue to lead the market, Asia-Pacific and South America offer promising expansion avenues. Market success will depend on adapting to shifting consumer preferences, navigating regulatory changes, and implementing effective marketing strategies. Furthermore, sustainability and ethical sourcing are increasingly influencing consumer purchasing decisions.
Vodka Industry Company Market Share
This report delivers an in-depth analysis of the global vodka industry, providing critical insights for professionals, investors, and strategists. The study period spans 2019-2033, with 2025 serving as the base year and 2025-2033 as the forecast period. Through extensive data and analysis, this report illuminates current market dynamics, future trends, key segments, leading players, and emerging opportunities within the $44.2 billion vodka market.
Vodka Industry Market Structure & Innovation Trends
The global vodka market exhibits a moderately concentrated structure, with key players such as Bacardi Limited, Constellation Brands Inc, Diageo PLC, and Pernod Ricard holding significant market share. Market share data for 2024 indicates that the top 5 players collectively control approximately xx% of the market. The industry is driven by innovation in flavor profiles (flavored vodka showing xx% growth in 2024), packaging, and marketing strategies, catering to evolving consumer preferences. Regulatory frameworks, including alcohol content restrictions and marketing regulations, significantly impact market dynamics. Product substitutes, such as other spirits and non-alcoholic beverages, pose a competitive threat, particularly within the mass market segment. The end-user demographic is broad, encompassing various age groups and socioeconomic backgrounds, although younger adults represent a significant and growing target segment. M&A activity has been relatively active in recent years, with deal values exceeding $xx Million in 2024.
- Market Concentration: Top 5 players control approximately xx% of the market (2024).
- Innovation Drivers: New Flavors, Premiumization, Sustainable Packaging.
- M&A Activity: Deal values exceeding $xx Million in 2024.
- Regulatory Landscape: Varies significantly across regions, impacting marketing and distribution.
- Key Substitutes: Other spirits, non-alcoholic beverages.
Vodka Industry Market Dynamics & Trends
The global vodka market is projected to experience a CAGR of xx% during the forecast period (2025-2033), driven by several factors. Rising disposable incomes in developing economies, particularly in Asia and Africa, are expanding market penetration. A shift towards premium and super-premium vodka brands is a key trend, reflecting growing consumer preference for higher quality and unique flavor experiences. Technological advancements in production and distribution are enhancing efficiency and sustainability. The competitive landscape is highly dynamic, with established players facing increasing competition from smaller, craft distilleries offering innovative and niche products. Changing consumer preferences, particularly toward healthier lifestyle choices, are posing a challenge, with the growth of low-alcohol and non-alcoholic alternatives.
Dominant Regions & Segments in Vodka Industry
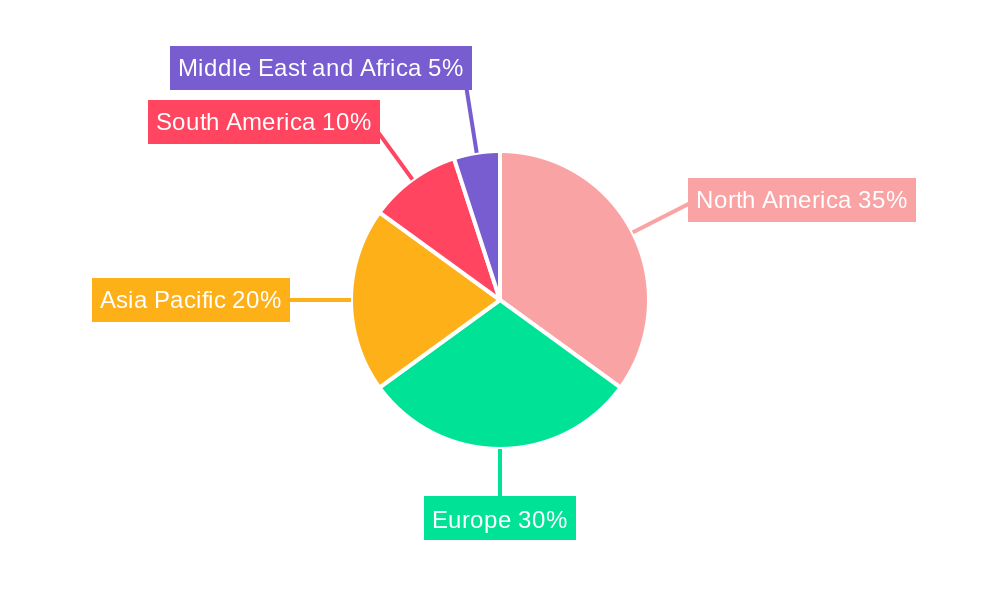
The North American region currently holds the largest market share within the vodka industry (xx% in 2024), driven by high levels of alcohol consumption and robust demand for premium and super-premium brands. This dominance is further fueled by strong economic growth, a well-established distribution network, and well-developed consumer base.
- By Distribution Channel:
- On-Trade: The on-trade channel (bars, restaurants) still holds significant share (xx% in 2024), although its growth is projected to be slower than the off-trade sector in the coming years.
- Off-Trade: The off-trade channel (retail stores, supermarkets) represents the dominant segment (xx% in 2024) demonstrating higher potential for growth owing to increased accessibility and convenience.
- By Type:
- Flavored: The flavored vodka segment is experiencing rapid growth (xx% CAGR from 2025-2033), driven by consumer preferences for diverse taste experiences.
- Non-Flavored: Traditional non-flavored vodka continues to maintain significant market share (xx% in 2024), despite the growth of flavored variants.
- By Category:
- Premium/Super-Premium: The premium and super-premium segments are demonstrating strong growth potential (xx% CAGR from 2025-2033), indicating a shift towards higher-quality products.
- Mass: The mass market segment is facing price competition but retains a considerable share of the market (xx% in 2024).
Vodka Industry Product Innovations
Recent product innovations focus on unique flavor profiles, premium ingredients, and sustainable packaging. The introduction of ready-to-drink (RTD) vodka cocktails caters to convenience-seeking consumers. Technological advancements, such as improved filtration and distillation techniques, enhance product quality and reduce environmental impact. Companies are investing in innovative marketing strategies, leveraging social media and influencer partnerships to reach target audiences. The market is seeing a rise in organic and craft vodka brands, targeting health-conscious consumers.
Report Scope & Segmentation Analysis
This report segments the vodka market by distribution channel (on-trade and off-trade), product type (flavored and non-flavored), and category (mass, premium, and super-premium). Growth projections for each segment are provided, along with analysis of market sizes and competitive dynamics. Market size estimates for 2024 and forecast projections to 2033 are detailed for each segment. Each segment's competitive landscape is addressed, outlining key players and their strategies.
Key Drivers of Vodka Industry Growth
Several factors are driving growth in the vodka industry, including rising disposable incomes in emerging markets, evolving consumer preferences for premium and flavored vodkas, increasing demand for ready-to-drink cocktails, and the introduction of sustainable packaging. Technological advancements in production and distribution enhance efficiency and reduce costs. Favorable government policies in some regions also contribute to market expansion.
Challenges in the Vodka Industry Sector
The vodka industry faces several challenges, including increasing competition from other alcoholic beverages, rising raw material costs, stringent regulations in certain markets, and fluctuations in consumer preferences. Health concerns surrounding alcohol consumption and growing popularity of non-alcoholic alternatives present additional pressure. Supply chain disruptions, impacting the availability of key ingredients, also pose significant risks.
Emerging Opportunities in Vodka Industry
The vodka industry offers numerous emerging opportunities, including the growing demand for premium and super-premium brands, the increasing popularity of flavored and ready-to-drink options, and the expansion into new and emerging markets. Opportunities exist in sustainable packaging solutions and health-conscious vodka products.
Leading Players in the Vodka Industry Market
- Bacardi Limited
- Constellation Brands Inc
- Fifth Generation Inc
- Kirker Greer Holdings Limited
- The Coca-Cola HBC AG
- Luctor International
- Pernod Ricard
- LVMH Moët Hennessy Louis Vuitton (Belvedere Vodka)
- Becle SAB de CV
- Diageo PLC
Key Developments in Vodka Industry
- February 2023: Diageo launched the Cherry Drop Smirnoff variety, a new flavored vodka with 37.5% ABV. This expands their product portfolio and caters to evolving consumer tastes.
- September 2022: Brown-Forman Corporation announced plans to distribute its brands, including Finlandia Vodka, in Slovakia from September 2023, expanding its market reach.
- August 2022: Constellation Brands launched 'Fresca Mixed,' a line of premium pre-mixed cocktails, including a vodka spritz, tapping into the growing RTD market.
Future Outlook for Vodka Industry Market
The future outlook for the vodka industry remains positive, driven by continued growth in emerging markets, innovation in product offerings, and the increasing popularity of premium and flavored vodkas. Strategic partnerships, expansion into new distribution channels, and investment in sustainable practices will play a critical role in shaping the future of the industry. The market is expected to see continued premiumization and diversification of product offerings, driven by consumer demand for unique and high-quality experiences.
Vodka Industry Segmentation
-
1. Type
- 1.1. Flavored
- 1.2. Non-Flavored
-
2. Category
- 2.1. Mass
- 2.2. Premium
- 2.3. Super-Premium
-
3. Distribution Channel
- 3.1. On-Trade
-
3.2. Off-Trade
- 3.2.1. Supermarkets/Hypermarkets
- 3.2.2. Specialty Stores
- 3.2.3. Online Retailers
- 3.2.4. Other Distribution Channels
Vodka Industry Segmentation By Geography
-
1. North America
- 1.1. United States
- 1.2. Canada
- 1.3. Mexico
- 1.4. Rest of North America
-
2. Europe
- 2.1. Spain
- 2.2. United Kingdom
- 2.3. Germany
- 2.4. France
- 2.5. Italy
- 2.6. Russia
- 2.7. Rest of Europe
-
3. Asia Pacific
- 3.1. China
- 3.2. Japan
- 3.3. India
- 3.4. Australia
- 3.5. Taiwan
- 3.6. Singapore
- 3.7. South Korea
- 3.8. Rest of Asia Pacific
-
4. South America
- 4.1. Brazil
- 4.2. Argentina
- 4.3. Rest of South America
-
5. Middle East and Africa
- 5.1. United Arab Emirates
- 5.2. South Africa
- 5.3. Rest of Middle East and Africa
Vodka Industry Regional Market Share
Geographic Coverage of Vodka Industry
Vodka Industry REPORT HIGHLIGHTS
| Aspects | Details |
|---|---|
| Study Period | 2020-2034 |
| Base Year | 2025 |
| Estimated Year | 2026 |
| Forecast Period | 2026-2034 |
| Historical Period | 2020-2025 |
| Growth Rate | CAGR of 5.5% from 2020-2034 |
| Segmentation |
|
Table of Contents
- 1. Introduction
- 1.1. Research Scope
- 1.2. Market Segmentation
- 1.3. Research Methodology
- 1.4. Definitions and Assumptions
- 2. Executive Summary
- 2.1. Introduction
- 3. Market Dynamics
- 3.1. Introduction
- 3.2. Market Drivers
- 3.2.1. Demand for Premium and Super Premium Vodka; Effective Branding and Marketing by Players
- 3.3. Market Restrains
- 3.3.1. Stringent Regulations Pertaining to Vodka; Popularity of Non-alcoholic Beverages
- 3.4. Market Trends
- 3.4.1. Premiumization of Vodka
- 4. Market Factor Analysis
- 4.1. Porters Five Forces
- 4.2. Supply/Value Chain
- 4.3. PESTEL analysis
- 4.4. Market Entropy
- 4.5. Patent/Trademark Analysis
- 5. Global Vodka Industry Analysis, Insights and Forecast, 2020-2032
- 5.1. Market Analysis, Insights and Forecast - by Type
- 5.1.1. Flavored
- 5.1.2. Non-Flavored
- 5.2. Market Analysis, Insights and Forecast - by Category
- 5.2.1. Mass
- 5.2.2. Premium
- 5.2.3. Super-Premium
- 5.3. Market Analysis, Insights and Forecast - by Distribution Channel
- 5.3.1. On-Trade
- 5.3.2. Off-Trade
- 5.3.2.1. Supermarkets/Hypermarkets
- 5.3.2.2. Specialty Stores
- 5.3.2.3. Online Retailers
- 5.3.2.4. Other Distribution Channels
- 5.4. Market Analysis, Insights and Forecast - by Region
- 5.4.1. North America
- 5.4.2. Europe
- 5.4.3. Asia Pacific
- 5.4.4. South America
- 5.4.5. Middle East and Africa
- 5.1. Market Analysis, Insights and Forecast - by Type
- 6. North America Vodka Industry Analysis, Insights and Forecast, 2020-2032
- 6.1. Market Analysis, Insights and Forecast - by Type
- 6.1.1. Flavored
- 6.1.2. Non-Flavored
- 6.2. Market Analysis, Insights and Forecast - by Category
- 6.2.1. Mass
- 6.2.2. Premium
- 6.2.3. Super-Premium
- 6.3. Market Analysis, Insights and Forecast - by Distribution Channel
- 6.3.1. On-Trade
- 6.3.2. Off-Trade
- 6.3.2.1. Supermarkets/Hypermarkets
- 6.3.2.2. Specialty Stores
- 6.3.2.3. Online Retailers
- 6.3.2.4. Other Distribution Channels
- 6.1. Market Analysis, Insights and Forecast - by Type
- 7. Europe Vodka Industry Analysis, Insights and Forecast, 2020-2032
- 7.1. Market Analysis, Insights and Forecast - by Type
- 7.1.1. Flavored
- 7.1.2. Non-Flavored
- 7.2. Market Analysis, Insights and Forecast - by Category
- 7.2.1. Mass
- 7.2.2. Premium
- 7.2.3. Super-Premium
- 7.3. Market Analysis, Insights and Forecast - by Distribution Channel
- 7.3.1. On-Trade
- 7.3.2. Off-Trade
- 7.3.2.1. Supermarkets/Hypermarkets
- 7.3.2.2. Specialty Stores
- 7.3.2.3. Online Retailers
- 7.3.2.4. Other Distribution Channels
- 7.1. Market Analysis, Insights and Forecast - by Type
- 8. Asia Pacific Vodka Industry Analysis, Insights and Forecast, 2020-2032
- 8.1. Market Analysis, Insights and Forecast - by Type
- 8.1.1. Flavored
- 8.1.2. Non-Flavored
- 8.2. Market Analysis, Insights and Forecast - by Category
- 8.2.1. Mass
- 8.2.2. Premium
- 8.2.3. Super-Premium
- 8.3. Market Analysis, Insights and Forecast - by Distribution Channel
- 8.3.1. On-Trade
- 8.3.2. Off-Trade
- 8.3.2.1. Supermarkets/Hypermarkets
- 8.3.2.2. Specialty Stores
- 8.3.2.3. Online Retailers
- 8.3.2.4. Other Distribution Channels
- 8.1. Market Analysis, Insights and Forecast - by Type
- 9. South America Vodka Industry Analysis, Insights and Forecast, 2020-2032
- 9.1. Market Analysis, Insights and Forecast - by Type
- 9.1.1. Flavored
- 9.1.2. Non-Flavored
- 9.2. Market Analysis, Insights and Forecast - by Category
- 9.2.1. Mass
- 9.2.2. Premium
- 9.2.3. Super-Premium
- 9.3. Market Analysis, Insights and Forecast - by Distribution Channel
- 9.3.1. On-Trade
- 9.3.2. Off-Trade
- 9.3.2.1. Supermarkets/Hypermarkets
- 9.3.2.2. Specialty Stores
- 9.3.2.3. Online Retailers
- 9.3.2.4. Other Distribution Channels
- 9.1. Market Analysis, Insights and Forecast - by Type
- 10. Middle East and Africa Vodka Industry Analysis, Insights and Forecast, 2020-2032
- 10.1. Market Analysis, Insights and Forecast - by Type
- 10.1.1. Flavored
- 10.1.2. Non-Flavored
- 10.2. Market Analysis, Insights and Forecast - by Category
- 10.2.1. Mass
- 10.2.2. Premium
- 10.2.3. Super-Premium
- 10.3. Market Analysis, Insights and Forecast - by Distribution Channel
- 10.3.1. On-Trade
- 10.3.2. Off-Trade
- 10.3.2.1. Supermarkets/Hypermarkets
- 10.3.2.2. Specialty Stores
- 10.3.2.3. Online Retailers
- 10.3.2.4. Other Distribution Channels
- 10.1. Market Analysis, Insights and Forecast - by Type
- 11. Competitive Analysis
- 11.1. Global Market Share Analysis 2025
- 11.2. Company Profiles
- 11.2.1 Bacardi Limited
- 11.2.1.1. Overview
- 11.2.1.2. Products
- 11.2.1.3. SWOT Analysis
- 11.2.1.4. Recent Developments
- 11.2.1.5. Financials (Based on Availability)
- 11.2.2 Constellation Brands Inc
- 11.2.2.1. Overview
- 11.2.2.2. Products
- 11.2.2.3. SWOT Analysis
- 11.2.2.4. Recent Developments
- 11.2.2.5. Financials (Based on Availability)
- 11.2.3 Fifth Generation Inc
- 11.2.3.1. Overview
- 11.2.3.2. Products
- 11.2.3.3. SWOT Analysis
- 11.2.3.4. Recent Developments
- 11.2.3.5. Financials (Based on Availability)
- 11.2.4 Kirker Greer Holdings Limited
- 11.2.4.1. Overview
- 11.2.4.2. Products
- 11.2.4.3. SWOT Analysis
- 11.2.4.4. Recent Developments
- 11.2.4.5. Financials (Based on Availability)
- 11.2.5 The Coca-cola Hbc Ag
- 11.2.5.1. Overview
- 11.2.5.2. Products
- 11.2.5.3. SWOT Analysis
- 11.2.5.4. Recent Developments
- 11.2.5.5. Financials (Based on Availability)
- 11.2.6 Luctor International*List Not Exhaustive
- 11.2.6.1. Overview
- 11.2.6.2. Products
- 11.2.6.3. SWOT Analysis
- 11.2.6.4. Recent Developments
- 11.2.6.5. Financials (Based on Availability)
- 11.2.7 Pernod Ricard
- 11.2.7.1. Overview
- 11.2.7.2. Products
- 11.2.7.3. SWOT Analysis
- 11.2.7.4. Recent Developments
- 11.2.7.5. Financials (Based on Availability)
- 11.2.8 LVMH Moet Hennessy Louis Vuitton (Belvedere Vodka
- 11.2.8.1. Overview
- 11.2.8.2. Products
- 11.2.8.3. SWOT Analysis
- 11.2.8.4. Recent Developments
- 11.2.8.5. Financials (Based on Availability)
- 11.2.9 Becle SAB de
- 11.2.9.1. Overview
- 11.2.9.2. Products
- 11.2.9.3. SWOT Analysis
- 11.2.9.4. Recent Developments
- 11.2.9.5. Financials (Based on Availability)
- 11.2.10 Diageo PLC
- 11.2.10.1. Overview
- 11.2.10.2. Products
- 11.2.10.3. SWOT Analysis
- 11.2.10.4. Recent Developments
- 11.2.10.5. Financials (Based on Availability)
- 11.2.1 Bacardi Limited
List of Figures
- Figure 1: Global Vodka Industry Revenue Breakdown (billion, %) by Region 2025 & 2033
- Figure 2: North America Vodka Industry Revenue (billion), by Type 2025 & 2033
- Figure 3: North America Vodka Industry Revenue Share (%), by Type 2025 & 2033
- Figure 4: North America Vodka Industry Revenue (billion), by Category 2025 & 2033
- Figure 5: North America Vodka Industry Revenue Share (%), by Category 2025 & 2033
- Figure 6: North America Vodka Industry Revenue (billion), by Distribution Channel 2025 & 2033
- Figure 7: North America Vodka Industry Revenue Share (%), by Distribution Channel 2025 & 2033
- Figure 8: North America Vodka Industry Revenue (billion), by Country 2025 & 2033
- Figure 9: North America Vodka Industry Revenue Share (%), by Country 2025 & 2033
- Figure 10: Europe Vodka Industry Revenue (billion), by Type 2025 & 2033
- Figure 11: Europe Vodka Industry Revenue Share (%), by Type 2025 & 2033
- Figure 12: Europe Vodka Industry Revenue (billion), by Category 2025 & 2033
- Figure 13: Europe Vodka Industry Revenue Share (%), by Category 2025 & 2033
- Figure 14: Europe Vodka Industry Revenue (billion), by Distribution Channel 2025 & 2033
- Figure 15: Europe Vodka Industry Revenue Share (%), by Distribution Channel 2025 & 2033
- Figure 16: Europe Vodka Industry Revenue (billion), by Country 2025 & 2033
- Figure 17: Europe Vodka Industry Revenue Share (%), by Country 2025 & 2033
- Figure 18: Asia Pacific Vodka Industry Revenue (billion), by Type 2025 & 2033
- Figure 19: Asia Pacific Vodka Industry Revenue Share (%), by Type 2025 & 2033
- Figure 20: Asia Pacific Vodka Industry Revenue (billion), by Category 2025 & 2033
- Figure 21: Asia Pacific Vodka Industry Revenue Share (%), by Category 2025 & 2033
- Figure 22: Asia Pacific Vodka Industry Revenue (billion), by Distribution Channel 2025 & 2033
- Figure 23: Asia Pacific Vodka Industry Revenue Share (%), by Distribution Channel 2025 & 2033
- Figure 24: Asia Pacific Vodka Industry Revenue (billion), by Country 2025 & 2033
- Figure 25: Asia Pacific Vodka Industry Revenue Share (%), by Country 2025 & 2033
- Figure 26: South America Vodka Industry Revenue (billion), by Type 2025 & 2033
- Figure 27: South America Vodka Industry Revenue Share (%), by Type 2025 & 2033
- Figure 28: South America Vodka Industry Revenue (billion), by Category 2025 & 2033
- Figure 29: South America Vodka Industry Revenue Share (%), by Category 2025 & 2033
- Figure 30: South America Vodka Industry Revenue (billion), by Distribution Channel 2025 & 2033
- Figure 31: South America Vodka Industry Revenue Share (%), by Distribution Channel 2025 & 2033
- Figure 32: South America Vodka Industry Revenue (billion), by Country 2025 & 2033
- Figure 33: South America Vodka Industry Revenue Share (%), by Country 2025 & 2033
- Figure 34: Middle East and Africa Vodka Industry Revenue (billion), by Type 2025 & 2033
- Figure 35: Middle East and Africa Vodka Industry Revenue Share (%), by Type 2025 & 2033
- Figure 36: Middle East and Africa Vodka Industry Revenue (billion), by Category 2025 & 2033
- Figure 37: Middle East and Africa Vodka Industry Revenue Share (%), by Category 2025 & 2033
- Figure 38: Middle East and Africa Vodka Industry Revenue (billion), by Distribution Channel 2025 & 2033
- Figure 39: Middle East and Africa Vodka Industry Revenue Share (%), by Distribution Channel 2025 & 2033
- Figure 40: Middle East and Africa Vodka Industry Revenue (billion), by Country 2025 & 2033
- Figure 41: Middle East and Africa Vodka Industry Revenue Share (%), by Country 2025 & 2033
List of Tables
- Table 1: Global Vodka Industry Revenue billion Forecast, by Type 2020 & 2033
- Table 2: Global Vodka Industry Revenue billion Forecast, by Category 2020 & 2033
- Table 3: Global Vodka Industry Revenue billion Forecast, by Distribution Channel 2020 & 2033
- Table 4: Global Vodka Industry Revenue billion Forecast, by Region 2020 & 2033
- Table 5: Global Vodka Industry Revenue billion Forecast, by Type 2020 & 2033
- Table 6: Global Vodka Industry Revenue billion Forecast, by Category 2020 & 2033
- Table 7: Global Vodka Industry Revenue billion Forecast, by Distribution Channel 2020 & 2033
- Table 8: Global Vodka Industry Revenue billion Forecast, by Country 2020 & 2033
- Table 9: United States Vodka Industry Revenue (billion) Forecast, by Application 2020 & 2033
- Table 10: Canada Vodka Industry Revenue (billion) Forecast, by Application 2020 & 2033
- Table 11: Mexico Vodka Industry Revenue (billion) Forecast, by Application 2020 & 2033
- Table 12: Rest of North America Vodka Industry Revenue (billion) Forecast, by Application 2020 & 2033
- Table 13: Global Vodka Industry Revenue billion Forecast, by Type 2020 & 2033
- Table 14: Global Vodka Industry Revenue billion Forecast, by Category 2020 & 2033
- Table 15: Global Vodka Industry Revenue billion Forecast, by Distribution Channel 2020 & 2033
- Table 16: Global Vodka Industry Revenue billion Forecast, by Country 2020 & 2033
- Table 17: Spain Vodka Industry Revenue (billion) Forecast, by Application 2020 & 2033
- Table 18: United Kingdom Vodka Industry Revenue (billion) Forecast, by Application 2020 & 2033
- Table 19: Germany Vodka Industry Revenue (billion) Forecast, by Application 2020 & 2033
- Table 20: France Vodka Industry Revenue (billion) Forecast, by Application 2020 & 2033
- Table 21: Italy Vodka Industry Revenue (billion) Forecast, by Application 2020 & 2033
- Table 22: Russia Vodka Industry Revenue (billion) Forecast, by Application 2020 & 2033
- Table 23: Rest of Europe Vodka Industry Revenue (billion) Forecast, by Application 2020 & 2033
- Table 24: Global Vodka Industry Revenue billion Forecast, by Type 2020 & 2033
- Table 25: Global Vodka Industry Revenue billion Forecast, by Category 2020 & 2033
- Table 26: Global Vodka Industry Revenue billion Forecast, by Distribution Channel 2020 & 2033
- Table 27: Global Vodka Industry Revenue billion Forecast, by Country 2020 & 2033
- Table 28: China Vodka Industry Revenue (billion) Forecast, by Application 2020 & 2033
- Table 29: Japan Vodka Industry Revenue (billion) Forecast, by Application 2020 & 2033
- Table 30: India Vodka Industry Revenue (billion) Forecast, by Application 2020 & 2033
- Table 31: Australia Vodka Industry Revenue (billion) Forecast, by Application 2020 & 2033
- Table 32: Taiwan Vodka Industry Revenue (billion) Forecast, by Application 2020 & 2033
- Table 33: Singapore Vodka Industry Revenue (billion) Forecast, by Application 2020 & 2033
- Table 34: South Korea Vodka Industry Revenue (billion) Forecast, by Application 2020 & 2033
- Table 35: Rest of Asia Pacific Vodka Industry Revenue (billion) Forecast, by Application 2020 & 2033
- Table 36: Global Vodka Industry Revenue billion Forecast, by Type 2020 & 2033
- Table 37: Global Vodka Industry Revenue billion Forecast, by Category 2020 & 2033
- Table 38: Global Vodka Industry Revenue billion Forecast, by Distribution Channel 2020 & 2033
- Table 39: Global Vodka Industry Revenue billion Forecast, by Country 2020 & 2033
- Table 40: Brazil Vodka Industry Revenue (billion) Forecast, by Application 2020 & 2033
- Table 41: Argentina Vodka Industry Revenue (billion) Forecast, by Application 2020 & 2033
- Table 42: Rest of South America Vodka Industry Revenue (billion) Forecast, by Application 2020 & 2033
- Table 43: Global Vodka Industry Revenue billion Forecast, by Type 2020 & 2033
- Table 44: Global Vodka Industry Revenue billion Forecast, by Category 2020 & 2033
- Table 45: Global Vodka Industry Revenue billion Forecast, by Distribution Channel 2020 & 2033
- Table 46: Global Vodka Industry Revenue billion Forecast, by Country 2020 & 2033
- Table 47: United Arab Emirates Vodka Industry Revenue (billion) Forecast, by Application 2020 & 2033
- Table 48: South Africa Vodka Industry Revenue (billion) Forecast, by Application 2020 & 2033
- Table 49: Rest of Middle East and Africa Vodka Industry Revenue (billion) Forecast, by Application 2020 & 2033
Frequently Asked Questions
1. What is the projected Compound Annual Growth Rate (CAGR) of the Vodka Industry?
The projected CAGR is approximately 5.5%.
2. Which companies are prominent players in the Vodka Industry?
Key companies in the market include Bacardi Limited, Constellation Brands Inc, Fifth Generation Inc, Kirker Greer Holdings Limited, The Coca-cola Hbc Ag, Luctor International*List Not Exhaustive, Pernod Ricard, LVMH Moet Hennessy Louis Vuitton (Belvedere Vodka, Becle SAB de, Diageo PLC.
3. What are the main segments of the Vodka Industry?
The market segments include Type, Category, Distribution Channel.
4. Can you provide details about the market size?
The market size is estimated to be USD 44.2 billion as of 2022.
5. What are some drivers contributing to market growth?
Demand for Premium and Super Premium Vodka; Effective Branding and Marketing by Players.
6. What are the notable trends driving market growth?
Premiumization of Vodka.
7. Are there any restraints impacting market growth?
Stringent Regulations Pertaining to Vodka; Popularity of Non-alcoholic Beverages.
8. Can you provide examples of recent developments in the market?
February 2023: Diageo expanded its portfolio by launching a new product, the Cherry Drop Smirnoff variety, consisting of a unique flavor with 37.5% ABV.
9. What pricing options are available for accessing the report?
Pricing options include single-user, multi-user, and enterprise licenses priced at USD 4750, USD 5250, and USD 8750 respectively.
10. Is the market size provided in terms of value or volume?
The market size is provided in terms of value, measured in billion.
11. Are there any specific market keywords associated with the report?
Yes, the market keyword associated with the report is "Vodka Industry," which aids in identifying and referencing the specific market segment covered.
12. How do I determine which pricing option suits my needs best?
The pricing options vary based on user requirements and access needs. Individual users may opt for single-user licenses, while businesses requiring broader access may choose multi-user or enterprise licenses for cost-effective access to the report.
13. Are there any additional resources or data provided in the Vodka Industry report?
While the report offers comprehensive insights, it's advisable to review the specific contents or supplementary materials provided to ascertain if additional resources or data are available.
14. How can I stay updated on further developments or reports in the Vodka Industry?
To stay informed about further developments, trends, and reports in the Vodka Industry, consider subscribing to industry newsletters, following relevant companies and organizations, or regularly checking reputable industry news sources and publications.
Methodology
Step 1 - Identification of Relevant Samples Size from Population Database


Step 2 - Approaches for Defining Global Market Size (Value, Volume* & Price*)

Note*: In applicable scenarios
Step 3 - Data Sources
Primary Research
- Web Analytics
- Survey Reports
- Research Institute
- Latest Research Reports
- Opinion Leaders
Secondary Research
- Annual Reports
- White Paper
- Latest Press Release
- Industry Association
- Paid Database
- Investor Presentations

Step 4 - Data Triangulation
Involves using different sources of information in order to increase the validity of a study
These sources are likely to be stakeholders in a program - participants, other researchers, program staff, other community members, and so on.
Then we put all data in single framework & apply various statistical tools to find out the dynamic on the market.
During the analysis stage, feedback from the stakeholder groups would be compared to determine areas of agreement as well as areas of divergence

