
Key Insights
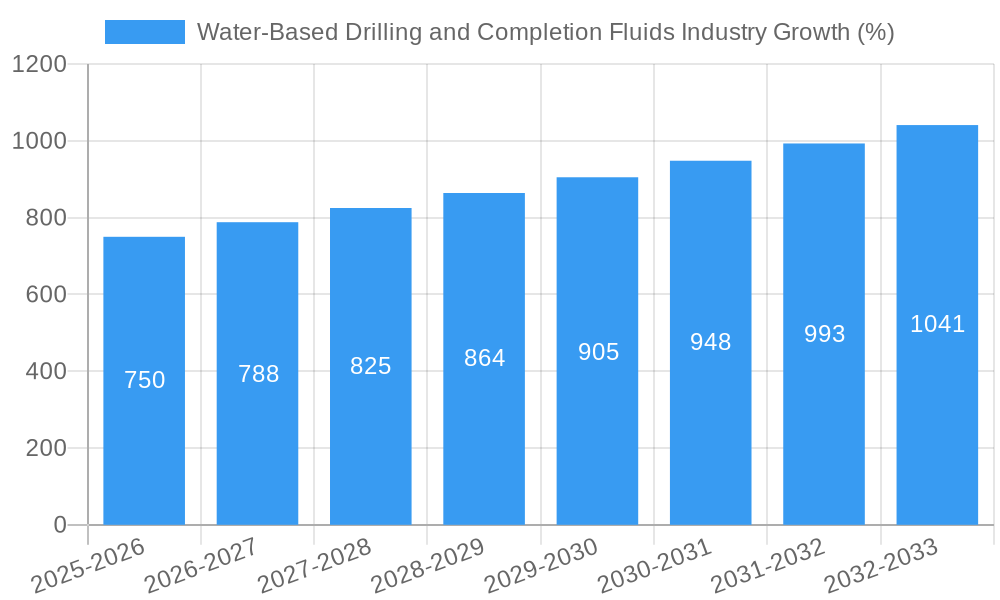
The water-based drilling and completion fluids market is experiencing robust growth, driven by increasing oil and gas exploration activities globally, particularly in unconventional resource development. The market's Compound Annual Growth Rate (CAGR) exceeding 5% signifies a consistent expansion throughout the forecast period (2025-2033). This growth is fueled by several factors, including the stringent environmental regulations promoting the adoption of environmentally friendly water-based fluids over oil-based alternatives. The rising demand for onshore drilling, especially in North America and the Asia-Pacific region, further contributes to market expansion. Technological advancements in fluid formulations, leading to enhanced performance and reduced environmental impact, are also key drivers. Segment-wise, the conventional well type currently holds a significant market share, but the HPHT (High Pressure High Temperature) segment is expected to witness substantial growth due to exploration in challenging geological formations. Major players like Schlumberger, Halliburton, and Baker Hughes are actively investing in research and development, optimizing their product portfolios to meet the evolving demands of the industry.
However, the market faces certain restraints. Fluctuations in crude oil prices directly impact exploration and production activities, potentially influencing the demand for drilling fluids. Moreover, the availability and cost of freshwater resources, a crucial component of water-based fluids, pose challenges in certain regions. Despite these limitations, the overall outlook for the water-based drilling and completion fluids market remains positive, projected to reach a significant market size by 2033, fueled by consistent technological innovation and the growing need for sustainable drilling practices. The offshore segment, while currently smaller, presents a considerable opportunity for future growth as deepwater exploration increases. The diversification across fluid types, with a focus on customized solutions for specific well conditions, will continue to shape market dynamics.
Water-Based Drilling and Completion Fluids Industry Report: 2019-2033
This comprehensive report provides a detailed analysis of the global water-based drilling and completion fluids industry, offering invaluable insights for industry professionals, investors, and strategic decision-makers. Covering the period from 2019 to 2033, with a focus on 2025, this report examines market dynamics, competitive landscapes, and future growth potential. The study encompasses key segments, including well type, application, and fluid type, providing a granular understanding of market trends and opportunities.
Water-Based Drilling and Completion Fluids Industry Market Structure & Innovation Trends
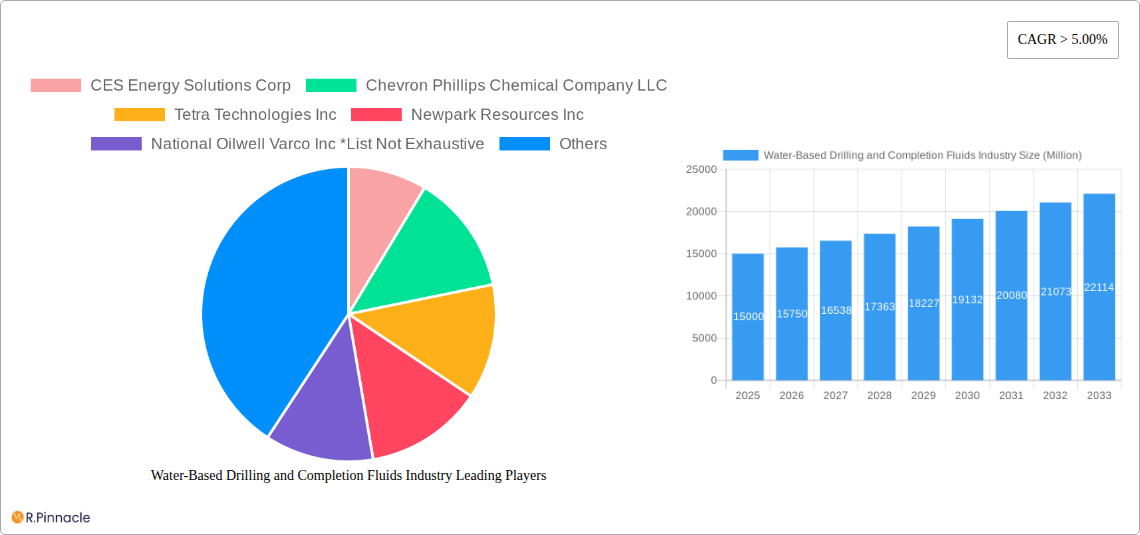
This section analyzes the market structure, focusing on concentration, innovation, and regulatory influences. The industry is characterized by a moderately consolidated market structure with key players such as CES Energy Solutions Corp, Chevron Phillips Chemical Company LLC, Tetra Technologies Inc, Newpark Resources Inc, National Oilwell Varco Inc, Weatherford International PLC, Baker Hughes Company, Halliburton Company, and Schlumberger Limited holding significant market share. The exact market share distribution for 2025 is estimated at xx%.
- Market Concentration: The top 5 companies collectively hold an estimated xx% market share in 2025.
- Innovation Drivers: Technological advancements in fluid formulations, enhanced performance additives, and environmentally friendly solutions are key drivers of innovation.
- Regulatory Frameworks: Stringent environmental regulations concerning waste disposal and emission reduction significantly influence product development and market dynamics.
- Product Substitutes: Oil-based and other synthetic fluids offer alternatives, though water-based fluids maintain dominance due to cost and environmental benefits.
- M&A Activities: The recent merger between Maersk Drilling and Noble Corporation (November 2021) exemplifies the ongoing consolidation and strategic acquisitions within the broader drilling sector, which indirectly impacts the water-based fluids market. The deal was valued at xx Million. The acquisition of 10 drilling rigs by CWC Energy Services (October 2021) indicates further expansion and investment in the sector. The total M&A deal value in the industry for 2024 is estimated to be xx Million.
Water-Based Drilling and Completion Fluids Industry Market Dynamics & Trends
The global water-based drilling and completion fluids market is projected to experience a Compound Annual Growth Rate (CAGR) of xx% during the forecast period (2025-2033), driven by several factors. Increased onshore and offshore drilling activities, particularly in regions with significant hydrocarbon reserves, fuel substantial demand. Technological advancements resulting in improved fluid performance, reduced environmental impact, and enhanced cost-efficiency are also key drivers. Furthermore, the industry is witnessing rising adoption of water-based fluids due to increasing environmental concerns and stricter regulations. This is further supported by a growing preference among operators for environmentally sustainable alternatives, driving market penetration in specific niche segments. The competitive landscape is highly dynamic, with existing players focusing on innovation and expansion, while new entrants continue to emerge, aiming to capitalize on the market's substantial growth potential. The market penetration rate for water-based fluids is projected to reach xx% by 2033.
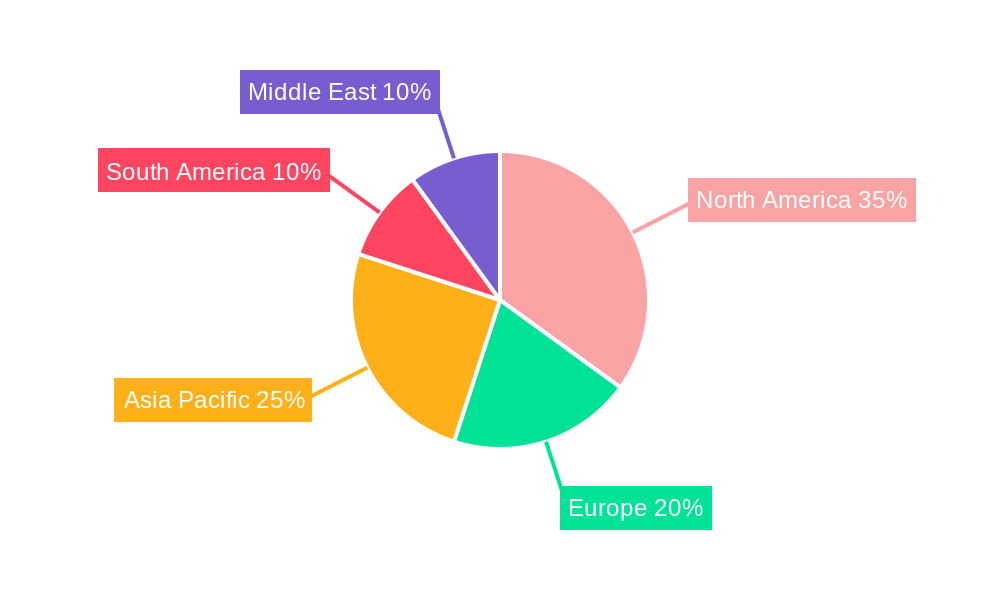
Dominant Regions & Segments in Water-Based Drilling and Completion Fluids Industry
North America is currently the dominant region for water-based drilling and completion fluids, driven by robust onshore and offshore drilling activities and a well-established oil and gas industry infrastructure.
Key Drivers for North America's Dominance:
- Abundant shale gas resources
- Strong government support for energy production
- Well-developed infrastructure
Segment Analysis:
- Well Type: The conventional well segment dominates the market due to its widespread presence and mature technology. However, the HPHT segment is expected to witness significant growth driven by increasing exploration and production in challenging environments.
- Application: Onshore drilling currently holds the largest market share, driven by significant exploration and production in various regions, while offshore drilling is experiencing modest growth.
- Fluid Type: Water-based fluids constitute the largest segment, driven by their cost-effectiveness and environmental benefits. Oil-based and other fluid types cater to niche applications.
Water-Based Drilling and Completion Fluids Industry Product Innovations
Recent innovations focus on developing high-performance, environmentally friendly water-based fluids with enhanced rheological properties, improved lubricity, and better shale inhibition capabilities. These advancements aim to optimize drilling efficiency, reduce environmental impact, and improve the overall wellbore stability. Market fit is achieved through tailored solutions for various well conditions, including HPHT environments and challenging formations.
Report Scope & Segmentation Analysis
This report segments the water-based drilling and completion fluids market by well type (conventional, HPHT), application (onshore, offshore), and fluid type (water-based, oil-based, other). Each segment is analyzed based on market size, growth projections, and competitive dynamics. For instance, the conventional well type segment is expected to grow at a CAGR of xx% from 2025-2033 due to sustained demand in mature oil and gas fields. The offshore application segment shows moderate growth due to its dependence on investment in new projects and exploration. Water-based fluids will maintain the largest market share, projected to reach xx Million by 2033, due to environmental considerations and cost advantages.
Key Drivers of Water-Based Drilling and Completion Fluids Industry Growth
Growth is driven by increased global energy demand, rising exploration and production activities in both onshore and offshore environments, and stringent environmental regulations promoting the adoption of eco-friendly drilling fluids. Technological advancements resulting in enhanced fluid performance and cost optimization also play a critical role. Specifically, the development of high-performance, environmentally friendly additives significantly contributes to market growth.
Challenges in the Water-Based Drilling and Completion Fluids Industry Sector
Significant challenges include fluctuating crude oil prices affecting project budgets, stringent environmental regulations increasing compliance costs, and intense competition among existing players and new entrants. Supply chain disruptions due to geopolitical events can also impact availability and pricing of raw materials. These factors combined are estimated to cause a xx% reduction in projected growth in specific regions over the forecast period.
Emerging Opportunities in Water-Based Drilling and Completion Fluids Industry
Emerging opportunities lie in developing advanced water-based fluids tailored for unconventional resources like shale gas and tight oil, expanding into new geographic markets with growing exploration and production activities, and focusing on the development of environmentally sustainable solutions, aligning with the global push toward cleaner energy sources.
Leading Players in the Water-Based Drilling and Completion Fluids Industry Market
- CES Energy Solutions Corp
- Chevron Phillips Chemical Company LLC
- Tetra Technologies Inc
- Newpark Resources Inc
- National Oilwell Varco Inc
- Weatherford International PLC
- Baker Hughes Company
- Halliburton Company
- Schlumberger Limited
Key Developments in Water-Based Drilling and Completion Fluids Industry Industry
- November 2021: Maersk Drilling and Noble Corporation merge, creating a larger player in the offshore drilling sector.
- October 2021: CWC Energy Services Corp. acquires 10 drilling rigs, indicating investment in the drilling industry and potentially increased demand for fluids.
Future Outlook for Water-Based Drilling and Completion Fluids Industry Market
The future outlook for the water-based drilling and completion fluids market is positive, driven by sustained growth in global energy demand and continuous technological advancements. Strategic partnerships, investments in research and development, and a focus on delivering sustainable solutions will be crucial for success in this dynamic market. The market is expected to achieve a value of xx Million by 2033.
Water-Based Drilling and Completion Fluids Industry Segmentation
-
1. Application
- 1.1. Onshore
- 1.2. Offshore
-
2. Fluid Type
- 2.1. Water-based
- 2.2. Oil-based
- 2.3. Other Fluid Types
-
3. Well Type
- 3.1. Conventional
- 3.2. High Pressure High Temperature (HPHT)
Water-Based Drilling and Completion Fluids Industry Segmentation By Geography
- 1. North America
- 2. Europe
- 3. Asia Pacific
- 4. South America
- 5. Middle East
Water-Based Drilling and Completion Fluids Industry REPORT HIGHLIGHTS
| Aspects | Details |
|---|---|
| Study Period | 2019-2033 |
| Base Year | 2024 |
| Estimated Year | 2025 |
| Forecast Period | 2025-2033 |
| Historical Period | 2019-2024 |
| Growth Rate | CAGR of > 5.00% from 2019-2033 |
| Segmentation |
|
Table of Contents
- 1. Introduction
- 1.1. Research Scope
- 1.2. Market Segmentation
- 1.3. Research Methodology
- 1.4. Definitions and Assumptions
- 2. Executive Summary
- 2.1. Introduction
- 3. Market Dynamics
- 3.1. Introduction
- 3.2. Market Drivers
- 3.2.1. 4.; Rapid Recovery in the Oil and Gas and Mining Industries4.; Surge in the Construction Industry
- 3.3. Market Restrains
- 3.3.1. 4.; High Maintenance and Operation Costs of Submersible Pump Restrain the Market
- 3.4. Market Trends
- 3.4.1. Onshore Segment to Dominate the Market
- 4. Market Factor Analysis
- 4.1. Porters Five Forces
- 4.2. Supply/Value Chain
- 4.3. PESTEL analysis
- 4.4. Market Entropy
- 4.5. Patent/Trademark Analysis
- 5. Global Water-Based Drilling and Completion Fluids Industry Analysis, Insights and Forecast, 2019-2031
- 5.1. Market Analysis, Insights and Forecast - by Application
- 5.1.1. Onshore
- 5.1.2. Offshore
- 5.2. Market Analysis, Insights and Forecast - by Fluid Type
- 5.2.1. Water-based
- 5.2.2. Oil-based
- 5.2.3. Other Fluid Types
- 5.3. Market Analysis, Insights and Forecast - by Well Type
- 5.3.1. Conventional
- 5.3.2. High Pressure High Temperature (HPHT)
- 5.4. Market Analysis, Insights and Forecast - by Region
- 5.4.1. North America
- 5.4.2. Europe
- 5.4.3. Asia Pacific
- 5.4.4. South America
- 5.4.5. Middle East
- 5.1. Market Analysis, Insights and Forecast - by Application
- 6. North America Water-Based Drilling and Completion Fluids Industry Analysis, Insights and Forecast, 2019-2031
- 6.1. Market Analysis, Insights and Forecast - by Application
- 6.1.1. Onshore
- 6.1.2. Offshore
- 6.2. Market Analysis, Insights and Forecast - by Fluid Type
- 6.2.1. Water-based
- 6.2.2. Oil-based
- 6.2.3. Other Fluid Types
- 6.3. Market Analysis, Insights and Forecast - by Well Type
- 6.3.1. Conventional
- 6.3.2. High Pressure High Temperature (HPHT)
- 6.1. Market Analysis, Insights and Forecast - by Application
- 7. Europe Water-Based Drilling and Completion Fluids Industry Analysis, Insights and Forecast, 2019-2031
- 7.1. Market Analysis, Insights and Forecast - by Application
- 7.1.1. Onshore
- 7.1.2. Offshore
- 7.2. Market Analysis, Insights and Forecast - by Fluid Type
- 7.2.1. Water-based
- 7.2.2. Oil-based
- 7.2.3. Other Fluid Types
- 7.3. Market Analysis, Insights and Forecast - by Well Type
- 7.3.1. Conventional
- 7.3.2. High Pressure High Temperature (HPHT)
- 7.1. Market Analysis, Insights and Forecast - by Application
- 8. Asia Pacific Water-Based Drilling and Completion Fluids Industry Analysis, Insights and Forecast, 2019-2031
- 8.1. Market Analysis, Insights and Forecast - by Application
- 8.1.1. Onshore
- 8.1.2. Offshore
- 8.2. Market Analysis, Insights and Forecast - by Fluid Type
- 8.2.1. Water-based
- 8.2.2. Oil-based
- 8.2.3. Other Fluid Types
- 8.3. Market Analysis, Insights and Forecast - by Well Type
- 8.3.1. Conventional
- 8.3.2. High Pressure High Temperature (HPHT)
- 8.1. Market Analysis, Insights and Forecast - by Application
- 9. South America Water-Based Drilling and Completion Fluids Industry Analysis, Insights and Forecast, 2019-2031
- 9.1. Market Analysis, Insights and Forecast - by Application
- 9.1.1. Onshore
- 9.1.2. Offshore
- 9.2. Market Analysis, Insights and Forecast - by Fluid Type
- 9.2.1. Water-based
- 9.2.2. Oil-based
- 9.2.3. Other Fluid Types
- 9.3. Market Analysis, Insights and Forecast - by Well Type
- 9.3.1. Conventional
- 9.3.2. High Pressure High Temperature (HPHT)
- 9.1. Market Analysis, Insights and Forecast - by Application
- 10. Middle East Water-Based Drilling and Completion Fluids Industry Analysis, Insights and Forecast, 2019-2031
- 10.1. Market Analysis, Insights and Forecast - by Application
- 10.1.1. Onshore
- 10.1.2. Offshore
- 10.2. Market Analysis, Insights and Forecast - by Fluid Type
- 10.2.1. Water-based
- 10.2.2. Oil-based
- 10.2.3. Other Fluid Types
- 10.3. Market Analysis, Insights and Forecast - by Well Type
- 10.3.1. Conventional
- 10.3.2. High Pressure High Temperature (HPHT)
- 10.1. Market Analysis, Insights and Forecast - by Application
- 11. North America Water-Based Drilling and Completion Fluids Industry Analysis, Insights and Forecast, 2019-2031
- 11.1. Market Analysis, Insights and Forecast - By Country/Sub-region
- 11.1.1. undefined
- 12. Europe Water-Based Drilling and Completion Fluids Industry Analysis, Insights and Forecast, 2019-2031
- 12.1. Market Analysis, Insights and Forecast - By Country/Sub-region
- 12.1.1. undefined
- 13. Asia Pacific Water-Based Drilling and Completion Fluids Industry Analysis, Insights and Forecast, 2019-2031
- 13.1. Market Analysis, Insights and Forecast - By Country/Sub-region
- 13.1.1. undefined
- 14. South America Water-Based Drilling and Completion Fluids Industry Analysis, Insights and Forecast, 2019-2031
- 14.1. Market Analysis, Insights and Forecast - By Country/Sub-region
- 14.1.1. undefined
- 15. Middle East Water-Based Drilling and Completion Fluids Industry Analysis, Insights and Forecast, 2019-2031
- 15.1. Market Analysis, Insights and Forecast - By Country/Sub-region
- 15.1.1. undefined
- 16. Competitive Analysis
- 16.1. Global Market Share Analysis 2024
- 16.2. Company Profiles
- 16.2.1 CES Energy Solutions Corp
- 16.2.1.1. Overview
- 16.2.1.2. Products
- 16.2.1.3. SWOT Analysis
- 16.2.1.4. Recent Developments
- 16.2.1.5. Financials (Based on Availability)
- 16.2.2 Chevron Phillips Chemical Company LLC
- 16.2.2.1. Overview
- 16.2.2.2. Products
- 16.2.2.3. SWOT Analysis
- 16.2.2.4. Recent Developments
- 16.2.2.5. Financials (Based on Availability)
- 16.2.3 Tetra Technologies Inc
- 16.2.3.1. Overview
- 16.2.3.2. Products
- 16.2.3.3. SWOT Analysis
- 16.2.3.4. Recent Developments
- 16.2.3.5. Financials (Based on Availability)
- 16.2.4 Newpark Resources Inc
- 16.2.4.1. Overview
- 16.2.4.2. Products
- 16.2.4.3. SWOT Analysis
- 16.2.4.4. Recent Developments
- 16.2.4.5. Financials (Based on Availability)
- 16.2.5 National Oilwell Varco Inc *List Not Exhaustive
- 16.2.5.1. Overview
- 16.2.5.2. Products
- 16.2.5.3. SWOT Analysis
- 16.2.5.4. Recent Developments
- 16.2.5.5. Financials (Based on Availability)
- 16.2.6 Weatherford International PLC
- 16.2.6.1. Overview
- 16.2.6.2. Products
- 16.2.6.3. SWOT Analysis
- 16.2.6.4. Recent Developments
- 16.2.6.5. Financials (Based on Availability)
- 16.2.7 Baker Hughes Company
- 16.2.7.1. Overview
- 16.2.7.2. Products
- 16.2.7.3. SWOT Analysis
- 16.2.7.4. Recent Developments
- 16.2.7.5. Financials (Based on Availability)
- 16.2.8 Halliburton Company
- 16.2.8.1. Overview
- 16.2.8.2. Products
- 16.2.8.3. SWOT Analysis
- 16.2.8.4. Recent Developments
- 16.2.8.5. Financials (Based on Availability)
- 16.2.9 Schlumberger Limited
- 16.2.9.1. Overview
- 16.2.9.2. Products
- 16.2.9.3. SWOT Analysis
- 16.2.9.4. Recent Developments
- 16.2.9.5. Financials (Based on Availability)
- 16.2.1 CES Energy Solutions Corp
List of Figures
- Figure 1: Global Water-Based Drilling and Completion Fluids Industry Revenue Breakdown (Million, %) by Region 2024 & 2032
- Figure 2: North America Water-Based Drilling and Completion Fluids Industry Revenue (Million), by Country 2024 & 2032
- Figure 3: North America Water-Based Drilling and Completion Fluids Industry Revenue Share (%), by Country 2024 & 2032
- Figure 4: Europe Water-Based Drilling and Completion Fluids Industry Revenue (Million), by Country 2024 & 2032
- Figure 5: Europe Water-Based Drilling and Completion Fluids Industry Revenue Share (%), by Country 2024 & 2032
- Figure 6: Asia Pacific Water-Based Drilling and Completion Fluids Industry Revenue (Million), by Country 2024 & 2032
- Figure 7: Asia Pacific Water-Based Drilling and Completion Fluids Industry Revenue Share (%), by Country 2024 & 2032
- Figure 8: South America Water-Based Drilling and Completion Fluids Industry Revenue (Million), by Country 2024 & 2032
- Figure 9: South America Water-Based Drilling and Completion Fluids Industry Revenue Share (%), by Country 2024 & 2032
- Figure 10: Middle East Water-Based Drilling and Completion Fluids Industry Revenue (Million), by Country 2024 & 2032
- Figure 11: Middle East Water-Based Drilling and Completion Fluids Industry Revenue Share (%), by Country 2024 & 2032
- Figure 12: North America Water-Based Drilling and Completion Fluids Industry Revenue (Million), by Application 2024 & 2032
- Figure 13: North America Water-Based Drilling and Completion Fluids Industry Revenue Share (%), by Application 2024 & 2032
- Figure 14: North America Water-Based Drilling and Completion Fluids Industry Revenue (Million), by Fluid Type 2024 & 2032
- Figure 15: North America Water-Based Drilling and Completion Fluids Industry Revenue Share (%), by Fluid Type 2024 & 2032
- Figure 16: North America Water-Based Drilling and Completion Fluids Industry Revenue (Million), by Well Type 2024 & 2032
- Figure 17: North America Water-Based Drilling and Completion Fluids Industry Revenue Share (%), by Well Type 2024 & 2032
- Figure 18: North America Water-Based Drilling and Completion Fluids Industry Revenue (Million), by Country 2024 & 2032
- Figure 19: North America Water-Based Drilling and Completion Fluids Industry Revenue Share (%), by Country 2024 & 2032
- Figure 20: Europe Water-Based Drilling and Completion Fluids Industry Revenue (Million), by Application 2024 & 2032
- Figure 21: Europe Water-Based Drilling and Completion Fluids Industry Revenue Share (%), by Application 2024 & 2032
- Figure 22: Europe Water-Based Drilling and Completion Fluids Industry Revenue (Million), by Fluid Type 2024 & 2032
- Figure 23: Europe Water-Based Drilling and Completion Fluids Industry Revenue Share (%), by Fluid Type 2024 & 2032
- Figure 24: Europe Water-Based Drilling and Completion Fluids Industry Revenue (Million), by Well Type 2024 & 2032
- Figure 25: Europe Water-Based Drilling and Completion Fluids Industry Revenue Share (%), by Well Type 2024 & 2032
- Figure 26: Europe Water-Based Drilling and Completion Fluids Industry Revenue (Million), by Country 2024 & 2032
- Figure 27: Europe Water-Based Drilling and Completion Fluids Industry Revenue Share (%), by Country 2024 & 2032
- Figure 28: Asia Pacific Water-Based Drilling and Completion Fluids Industry Revenue (Million), by Application 2024 & 2032
- Figure 29: Asia Pacific Water-Based Drilling and Completion Fluids Industry Revenue Share (%), by Application 2024 & 2032
- Figure 30: Asia Pacific Water-Based Drilling and Completion Fluids Industry Revenue (Million), by Fluid Type 2024 & 2032
- Figure 31: Asia Pacific Water-Based Drilling and Completion Fluids Industry Revenue Share (%), by Fluid Type 2024 & 2032
- Figure 32: Asia Pacific Water-Based Drilling and Completion Fluids Industry Revenue (Million), by Well Type 2024 & 2032
- Figure 33: Asia Pacific Water-Based Drilling and Completion Fluids Industry Revenue Share (%), by Well Type 2024 & 2032
- Figure 34: Asia Pacific Water-Based Drilling and Completion Fluids Industry Revenue (Million), by Country 2024 & 2032
- Figure 35: Asia Pacific Water-Based Drilling and Completion Fluids Industry Revenue Share (%), by Country 2024 & 2032
- Figure 36: South America Water-Based Drilling and Completion Fluids Industry Revenue (Million), by Application 2024 & 2032
- Figure 37: South America Water-Based Drilling and Completion Fluids Industry Revenue Share (%), by Application 2024 & 2032
- Figure 38: South America Water-Based Drilling and Completion Fluids Industry Revenue (Million), by Fluid Type 2024 & 2032
- Figure 39: South America Water-Based Drilling and Completion Fluids Industry Revenue Share (%), by Fluid Type 2024 & 2032
- Figure 40: South America Water-Based Drilling and Completion Fluids Industry Revenue (Million), by Well Type 2024 & 2032
- Figure 41: South America Water-Based Drilling and Completion Fluids Industry Revenue Share (%), by Well Type 2024 & 2032
- Figure 42: South America Water-Based Drilling and Completion Fluids Industry Revenue (Million), by Country 2024 & 2032
- Figure 43: South America Water-Based Drilling and Completion Fluids Industry Revenue Share (%), by Country 2024 & 2032
- Figure 44: Middle East Water-Based Drilling and Completion Fluids Industry Revenue (Million), by Application 2024 & 2032
- Figure 45: Middle East Water-Based Drilling and Completion Fluids Industry Revenue Share (%), by Application 2024 & 2032
- Figure 46: Middle East Water-Based Drilling and Completion Fluids Industry Revenue (Million), by Fluid Type 2024 & 2032
- Figure 47: Middle East Water-Based Drilling and Completion Fluids Industry Revenue Share (%), by Fluid Type 2024 & 2032
- Figure 48: Middle East Water-Based Drilling and Completion Fluids Industry Revenue (Million), by Well Type 2024 & 2032
- Figure 49: Middle East Water-Based Drilling and Completion Fluids Industry Revenue Share (%), by Well Type 2024 & 2032
- Figure 50: Middle East Water-Based Drilling and Completion Fluids Industry Revenue (Million), by Country 2024 & 2032
- Figure 51: Middle East Water-Based Drilling and Completion Fluids Industry Revenue Share (%), by Country 2024 & 2032
List of Tables
- Table 1: Global Water-Based Drilling and Completion Fluids Industry Revenue Million Forecast, by Region 2019 & 2032
- Table 2: Global Water-Based Drilling and Completion Fluids Industry Revenue Million Forecast, by Application 2019 & 2032
- Table 3: Global Water-Based Drilling and Completion Fluids Industry Revenue Million Forecast, by Fluid Type 2019 & 2032
- Table 4: Global Water-Based Drilling and Completion Fluids Industry Revenue Million Forecast, by Well Type 2019 & 2032
- Table 5: Global Water-Based Drilling and Completion Fluids Industry Revenue Million Forecast, by Region 2019 & 2032
- Table 6: Global Water-Based Drilling and Completion Fluids Industry Revenue Million Forecast, by Country 2019 & 2032
- Table 7: Global Water-Based Drilling and Completion Fluids Industry Revenue Million Forecast, by Country 2019 & 2032
- Table 8: Global Water-Based Drilling and Completion Fluids Industry Revenue Million Forecast, by Country 2019 & 2032
- Table 9: Global Water-Based Drilling and Completion Fluids Industry Revenue Million Forecast, by Country 2019 & 2032
- Table 10: Global Water-Based Drilling and Completion Fluids Industry Revenue Million Forecast, by Country 2019 & 2032
- Table 11: Global Water-Based Drilling and Completion Fluids Industry Revenue Million Forecast, by Application 2019 & 2032
- Table 12: Global Water-Based Drilling and Completion Fluids Industry Revenue Million Forecast, by Fluid Type 2019 & 2032
- Table 13: Global Water-Based Drilling and Completion Fluids Industry Revenue Million Forecast, by Well Type 2019 & 2032
- Table 14: Global Water-Based Drilling and Completion Fluids Industry Revenue Million Forecast, by Country 2019 & 2032
- Table 15: Global Water-Based Drilling and Completion Fluids Industry Revenue Million Forecast, by Application 2019 & 2032
- Table 16: Global Water-Based Drilling and Completion Fluids Industry Revenue Million Forecast, by Fluid Type 2019 & 2032
- Table 17: Global Water-Based Drilling and Completion Fluids Industry Revenue Million Forecast, by Well Type 2019 & 2032
- Table 18: Global Water-Based Drilling and Completion Fluids Industry Revenue Million Forecast, by Country 2019 & 2032
- Table 19: Global Water-Based Drilling and Completion Fluids Industry Revenue Million Forecast, by Application 2019 & 2032
- Table 20: Global Water-Based Drilling and Completion Fluids Industry Revenue Million Forecast, by Fluid Type 2019 & 2032
- Table 21: Global Water-Based Drilling and Completion Fluids Industry Revenue Million Forecast, by Well Type 2019 & 2032
- Table 22: Global Water-Based Drilling and Completion Fluids Industry Revenue Million Forecast, by Country 2019 & 2032
- Table 23: Global Water-Based Drilling and Completion Fluids Industry Revenue Million Forecast, by Application 2019 & 2032
- Table 24: Global Water-Based Drilling and Completion Fluids Industry Revenue Million Forecast, by Fluid Type 2019 & 2032
- Table 25: Global Water-Based Drilling and Completion Fluids Industry Revenue Million Forecast, by Well Type 2019 & 2032
- Table 26: Global Water-Based Drilling and Completion Fluids Industry Revenue Million Forecast, by Country 2019 & 2032
- Table 27: Global Water-Based Drilling and Completion Fluids Industry Revenue Million Forecast, by Application 2019 & 2032
- Table 28: Global Water-Based Drilling and Completion Fluids Industry Revenue Million Forecast, by Fluid Type 2019 & 2032
- Table 29: Global Water-Based Drilling and Completion Fluids Industry Revenue Million Forecast, by Well Type 2019 & 2032
- Table 30: Global Water-Based Drilling and Completion Fluids Industry Revenue Million Forecast, by Country 2019 & 2032
Frequently Asked Questions
1. What is the projected Compound Annual Growth Rate (CAGR) of the Water-Based Drilling and Completion Fluids Industry?
The projected CAGR is approximately > 5.00%.
2. Which companies are prominent players in the Water-Based Drilling and Completion Fluids Industry?
Key companies in the market include CES Energy Solutions Corp, Chevron Phillips Chemical Company LLC, Tetra Technologies Inc, Newpark Resources Inc, National Oilwell Varco Inc *List Not Exhaustive, Weatherford International PLC, Baker Hughes Company, Halliburton Company, Schlumberger Limited.
3. What are the main segments of the Water-Based Drilling and Completion Fluids Industry?
The market segments include Application, Fluid Type, Well Type.
4. Can you provide details about the market size?
The market size is estimated to be USD XX Million as of 2022.
5. What are some drivers contributing to market growth?
4.; Rapid Recovery in the Oil and Gas and Mining Industries4.; Surge in the Construction Industry.
6. What are the notable trends driving market growth?
Onshore Segment to Dominate the Market.
7. Are there any restraints impacting market growth?
4.; High Maintenance and Operation Costs of Submersible Pump Restrain the Market.
8. Can you provide examples of recent developments in the market?
In November 2021, Danish offshore drilling contractor Maersk Drilling announced that it had entered a definitive agreement to merge with its US rival Noble Corporation in a primarily all-stock transaction, which will result in the creation of a combined company with a fleet of 20 floaters and 19 jack-up rigs.
9. What pricing options are available for accessing the report?
Pricing options include single-user, multi-user, and enterprise licenses priced at USD 4750, USD 5250, and USD 8750 respectively.
10. Is the market size provided in terms of value or volume?
The market size is provided in terms of value, measured in Million.
11. Are there any specific market keywords associated with the report?
Yes, the market keyword associated with the report is "Water-Based Drilling and Completion Fluids Industry," which aids in identifying and referencing the specific market segment covered.
12. How do I determine which pricing option suits my needs best?
The pricing options vary based on user requirements and access needs. Individual users may opt for single-user licenses, while businesses requiring broader access may choose multi-user or enterprise licenses for cost-effective access to the report.
13. Are there any additional resources or data provided in the Water-Based Drilling and Completion Fluids Industry report?
While the report offers comprehensive insights, it's advisable to review the specific contents or supplementary materials provided to ascertain if additional resources or data are available.
14. How can I stay updated on further developments or reports in the Water-Based Drilling and Completion Fluids Industry?
To stay informed about further developments, trends, and reports in the Water-Based Drilling and Completion Fluids Industry, consider subscribing to industry newsletters, following relevant companies and organizations, or regularly checking reputable industry news sources and publications.
Methodology
Step 1 - Identification of Relevant Samples Size from Population Database


Step 2 - Approaches for Defining Global Market Size (Value, Volume* & Price*)

Note*: In applicable scenarios
Step 3 - Data Sources
Primary Research
- Web Analytics
- Survey Reports
- Research Institute
- Latest Research Reports
- Opinion Leaders
Secondary Research
- Annual Reports
- White Paper
- Latest Press Release
- Industry Association
- Paid Database
- Investor Presentations

Step 4 - Data Triangulation
Involves using different sources of information in order to increase the validity of a study
These sources are likely to be stakeholders in a program - participants, other researchers, program staff, other community members, and so on.
Then we put all data in single framework & apply various statistical tools to find out the dynamic on the market.
During the analysis stage, feedback from the stakeholder groups would be compared to determine areas of agreement as well as areas of divergence


